🚀 Unveiling Trade Opportunities: FACT Fertilizers & ChemicalsWe're diving into the charts of FACT Fertilizers and Chemicals to uncover potential trade setups.
Current Situation 📊:
LTF Analysis: Currently, FACT is nestled in the 75-min demand zone, specifically the Rally 2 Base Rally (R2BR) zone.
ITF Overview: The Intermediate Time Frame (ITF) shows a clear uptrend. The price is comfortably trading at the daily EMA20
HTF Insights: Zooming out to the Higher Time Frame (HTF), the weekly chart indicates a strong uptrend, and there's a clear path upside with no resistance in sight.
Enter at the 75-min current demand zone, Risk-to-Reward Ratio: Aim for a lucrative 1:3.
🌟Thank you for your support! Your likes & comments. If you want to give any feedback then you can give in the comment section🌟
Trade with confidence, and let your profits run like a river. Embrace the journey!
Disclaimer 🚨:
This analysis is for educational purposes only. We aren't SEBI registered analysts. Trade responsibly.
Demand Zone

EUR/CHF ↗️ long Trade Setup ↗️Hello Everyone 🙋🏽♂️
Demand zone + RSI Oversold
🟠 EP 0.94538
🔴 SL 0.93986
🟢 TP1 0.95143 ⚠️( Close 50% of the trade and Set the SL on EP )⚠️
🟢 TP2 0.95656
We are not responsible of any losses for anyone, our trades are profitable more for long terms and we take losses as everyone,
manage your lot size as well and your SL and TP and my opinion is 0.01 lot for each 500 $.
Don't forget to hit the like bottom and write a comment to support us.
Follow us for more 🙋🏻♂️
Best Regard / EMA Trading .
Disclaimer:
----------------
It's not a financial advise, As everyone we take losses sometime but for long term trading we are profitable traders, so manage your account well with SL and TP and your lot size to keep your account safe and stay in the market

AUD/CHF ↗️ Long Trade Setup ↗️Hello Everyone 🙋🏽♂️
Demand zone + RSI Oversold
🟠 EP 0.57310
🔴 SL 0.57177
🟢 TP1 0.57463 ⚠️( Close 33% of the trade and Set the SL on EP )⚠️
🟢 TP2 0.57647 ⚠️ ( Close 33% of the trade )⚠️
🟢 TP3 0.57851🔥 ( Final result)🔥
We are not responsible of any losses for anyone, our trades are profitable more for long terms and we take losses as everyone,
manage your lot size as well and your SL and TP and my opinion is 0.01 lot for each 500 $.
Don't forget to hit the like bottom and write a comment to support us.
Follow us for more 🙋🏻♂️
Best Regard / EMA Trading .
Disclaimer:
----------------
It's not a financial advise, As everyone we take losses sometime but for long term trading we are profitable traders, so manage your account well with SL and TP and your lot size to keep your account safe and stay in the market

EUR/CAD ↗️ Long Trade Setup ↗️Hello Everyone 🙋🏽♂️
Demand zone + RSI Oversold
🟠 EP 1.46743
🔴 SL 1.46196
🟢 TP1 1.47322 ⚠️( Close 33% of the trade and Set the SL on EP )⚠️
🟢 TP2 1.47884 ⚠️ ( Close 33% of the trade )⚠️
🟢 TP3 1.48385 🔥 ( Final result)🔥
We are not responsible of any losses for anyone, our trades are profitable more for long terms and we take losses as everyone,
manage your lot size as well and your SL and TP and my opinion is 0.01 lot for each 500 $.
Don't forget to hit the like bottom and write a comment to support us.
Follow us for more 🙋🏻♂️
Best Regard / EMA Trading .
Disclaimer:
----------------
It's not a financial advise, As everyone we take losses sometime but for long term trading we are profitable traders, so manage your account well with SL and TP and your lot size to keep your account safe and stay in the market

the Gopher swimming in significant liquidity pool since 17 November the Gopher has been trading in a parallel bearish channel failing to trade/close above and above it, with the top and bottom trendline of the channel acting also as dynamic support and resistance.
price has found itself in weekly liquidity pool made of significant levels - (i) weekly supply of proximal price of 146.700 now acting as demand on smaller timeframes (ii) weekly demand CP of proximal price of 146.400.
i forecast higher USDJPY prices because price has found support on the bottom trendline of channel and is reacting to liquidity pool with the bottom price of the liquidity pool being demand level which is currently the significant level in control of price.
i have bullish targets to 4HR previous demand of proximal price @ 148.900.
put together by : Pako Phutietsile ( @currencynerd )

The Concept of Supply / Demand TradingThe principle of supply and demand trading involves identifying a counter-trend candle that precedes a sequence of three consecutive candles exhibiting strong bullish or bearish momentum. This specific candle is designated as the supply or demand level. The underlying theory posits that when the price retraces to the region where demand previously triggered a robust price movement, it is likely to encounter renewed demand, consequently attracting a larger number of buyers, thereby sustaining the prevailing trend.
Rule 1: The aggressive price movement must consist of 2-3 (3 preferred) candles that demonstrate remarkable strength in their respective directions.
Rule 2: The candle retracing to the demand zone should close outside of the zone, accompanied by a wick that reflects considerable strength.

Gold Rush with AI: Is a Bullish Trend broken?Dear Esteemed TradingView Members,
I n the intricate dance of financial markets, recent analytics hinted at a potential dip in Gold prices towards the next support zone, resting delicately around the current trendline and $1920. In a broader view of gold, the prevailing trend remains steadfastly bullish. The recent descent, therefore, wasn't a harbinger of a bearish trend but rather a retracement within the overarching bullish narrative. Retracements, akin to ripples in a vast river, move against the current without altering its course.
I n this light, the bullish trajectory of Gold persists, despite the transient shadow of bearish developments. The true nature of this episode—whether a mere retracement within a bullish trajectory or the inception of a bearish divergence—might unveil itself by the first quarter of 2024. For those inclined towards the former, signs may include ascending RSI values, dwindling volume bars, and price actions hovering modestly above the demand zone.
H owever, should this unfold as a pivot towards a bearish trajectory, anticipate a descent where RSI mirrors the fall in price, breaching the demand zone, and volume maintains its pressure at a consistent or escalating level? While my inclination leans towards the bullish scenario, it's imperative to remain vigilant of the alternate narrative.
N avigating the dynamic terrain of financial markets involves intuition and a judicious blend of analytical prowess and cutting-edge tools. In my recent analysis, I utilized Gradient Boosting Machines (GBMs) to sculpt the contours of my demand zone, adding a layer of sophistication to the predictive landscape.
So, what are GBMs?
G radient Boosting Machines stand as a formidable force in machine learning. A distinguished member of the ensemble learning family, GBMs artfully weave together multiple decision trees, harmonizing their collective insights to refine predictions. While their computational prowess is undeniable, it's worth noting that GBMs tread on the more resource-intensive side, making them a powerful yet demanding ally in the quest for accuracy.
A dvantages of GBMs include the capacity to attain high accuracy levels and tackle intricately woven datasets with finesse. However, this prowess comes at a cost—GBMs can be computationally demanding during the training phase and exhibit sensitivity to the choice of hyperparameters.
I n tandem with GBMs, my analysis delves into the nuanced language of financial indicators, such as the Relative Strength Index (RSI) and volume. RSI, a stalwart in technical analytics, gauges the magnitude of recent price changes, offering insights into the overbought or oversold nature of an asset. Volume is the heartbeat of market movements, signaling the intensity and sustainability of price shifts.
T ogether, these tools form a symphony of insights, guiding us through the intricate dance of market dynamics. As always, this isn't investment advice but a shared exploration of market intricacies. Your funds are your responsibility, and understanding the tools at your disposal empowers you in this journey.
It isn't investment advice but a nudge to delve into your research. Your funds are your responsibility—handle them with care. Embrace risk-management strategies, explore available safety nets, and prioritize the preservation of funds over fleeting gains.
Warm regards,
Ely

DXY's Recent Shifts: Insights and ObservationsD ear Esteemed TradingView Community,
I'm sharing my recent analytical insights into the movements of the Dollar Index (DXY). Please note that the following reflections are not financial advice but rather a comprehensive analysis based on my observations.
This week, DXY experienced a notable descent, and my analysis, driven by AI natural language processing, suggests a correlation with global news developments. Strikingly, the influence of news events appears to have a more significant impact on price action than technical indicators. As DXY found its way down, it eventually landed in a support zone. While this decline signals a bearish sentiment, it's crucial to recognize that the current position also places DXY in a support zone. Historical data indicates that predictions originating from support zones tend to favor upward price trends. Although some indicators still hint at a potential bearish outcome, extending downwards to the underlying support zone around $101 (as indicated by the blue rectangle), this zone might also act as a reversal point. Notably, the current support level aligns with the Exponential Moving Average (EMA) of 200, adding a layer of significance to its potential impact.
In this scenario, careful observation becomes paramount. One can monitor whether the price breaks below EMA 200, potentially signaling a short position with a target at the underlying support zone. Conversely, a long idea could play out if the observed support level, coinciding with EMA 200, acts as a shield, propelling DXY upward. It's essential to exercise caution when contemplating short positions from the current level, given its classification as a support zone. The risk-reward ratio may not favor such a strategy at this juncture. Adding a layer of complexity to the analysis is DXY's correlation with the stock market. The potential for DXY to follow a bearish trajectory could be heightened by a flourishing stock market. Conversely, a bounce in DXY might indicate a retracement in the context of a thriving stock market.
In conclusion, the intricacies of DXY's current position warrant careful consideration. The interplay between support zones, technical indicators, and global events introduces a degree of uncertainty. As we navigate these waters, it's crucial to remain vigilant and adaptable in our approach to market analysis.
With regard and an understanding heart,
Ely

aussie forecast. on the daily chart price has been on a steady rally breaking previous bearish structure where i witness resistance levels now acting as support.
this upside movement is due to price finding demand around the 0.63700 to 0.62800 price areas with the most impactful price being demand at proximal price 0.63500 which is currently in control of price.
this increase in bull momentum resulted in price breaking and trading above liquidity pool ranging from 0.65300 to 0.65200, price retested this important market structure failing to close below it, with extra bullish confirmation of price breaking also and trading above dynamic resistance trendline forming several OHLO candlesticks indicating increasing bullish momentum and strong demand dominance in price.
i have a long bias on the currency pair all the way to next above crucial price level which is supply CP(imbalance continuation pattern) of proximal price 0.66300.
put together by : Pako Phutietsile ( @currencynerd )

SNX/USDT Long Trade Setup ⬆️Hello Everyone 🙋🏽♂️
RSI +Demand zone
🟠 EP 3.236
🔴 SL 3.051
🟢 TP1 3.434 ⚠️( Close 33% of the trade and Set the SL on EP )⚠️
🟢 TP2 3.617 ⚠️ ( Close 33% of the trade )⚠️
🟢 TP3 3.803 🔥 ( Final result)🔥
We are not responsible of any losses for anyone, our trades are profitable more for long terms and we take losses as everyone,
manage your lot size as well and your SL and TP and my opinion is 0.01 lot for each 500 $.
Don't forget to hit the like bottom and write a comment to support us.
Follow us for more 🙋🏻♂️
Best Regard / EMA Trading .
Disclaimer:
----------------
It's not a financial advise, As everyone we take losses sometime but for long term trading we are profitable traders, so manage your account well with SL and TP and your lot size to keep your account safe and stay in the market

Cardano ADA - Bull Cycle - BUY & HODLCardano is getting ready for Black Friday.
It's on Sale, and it's time to lead some more, on each big dip.
ADAUSD ( ADAUSDT , ADABUSD ) is showing a "beautiful" Reversal Pattern.
I am holding and loading more.
My next good level: $0.15 .
Technicals:
* Elliott Wave A-B-C Pattern
* Fibonacci Retracement
* Demand Zone
* Cycle Analysis
* Bullish Divergence
My Fibonacci Time Zones tell me that early '23 is BOOMING!
One more dip please, and then we wait for Valhalla.

Decoding Market Trends: Platinum's Dance with AI-Predicted ShiftDear Esteemed TV Members,
P latinum has been swaying within a bearish trend. However, insights from Support Vector Machines (SVMs) applied to daily candles suggest a potential weakening of this bearish momentum. This predictive analysis, coupled with a possible rising channel pattern on the Relative Strength Index (RSI), indicates that the bearish trend might be approaching its conclusion, paving the way for a potential shift towards a bullish scenario.
S VMs, a formidable machine learning algorithm, serve a dual purpose in classification and regression tasks. In market analysis, SVMs are invaluable for identifying candlestick patterns, forecasting price momentum, and pinpointing crucial support and resistance levels. As per my SVMs, Platinum's price seems to be on the verge of entering a support zone, marked by the blue rectangle on the chart. This support zone could act as a catalyst, drawing in sufficient demand to instigate a reversal of the trend into a bullish trajectory.
V isualizing this potential scenario, I've outlined it with blue arrows and proposed a long position in the chart. However, a word of caution: Should Platinum experience a downturn below the outlined demand zone (as indicated by the purple forecast), it would be prudent to steer clear of the long position. In such a scenario, an alternative bullish outlook may emerge, capitalizing on Platinum's oversold conditions—a phenomenon observed previously on March 19, 2020, and a possibility hinted at in the alternative blue forecast.
Happy Trading!
A crucial disclaimer accompanies this insight: This is not investment advice, and the responsibility for trading decisions rests solely with the individual. It's imperative to conduct thorough research, exercise caution, and embrace effective risk management strategies.
Best regards,
Ely

How The Bitcoin PUMP Machine Works: SUPPLY And DEMAND Shocks!Every wonder why Bitcoins price seems to always go up over the long run? In this Video we examine the mechanism that continuously drives the price higher and higher from cycle to cycle. There are 2 parts to this pumping mechanism, part 1 before the halving and part 2 after the halving. Let's take a closer look!

USOIL Long Trade Setup ⬆️Hello Traders 🙋🏽♂️
The price hit the demand zone, with oversold on RSI with it a buy signal.
🟠 EP 73.15
🔴 SL 71.50
🟢 TP1 74.85
🟢 TP2 76.65
🟢 TP3 78.25
⚜️ Please support us with like & comment & Follow
Disclaimer
---------------
Trading is risky we all take loses
your responsibility is to not take more than 1% to 2% loss per trade and double your profits.

🚀 Seizing Opportunities: Cipla's High-Reward Trade Potential!Embark on a journey into the charts of Cipla as we uncover a compelling trade opportunity, breaking down the analysis in simple terms for both new and experienced traders.
Current Market Dynamics 📊:
LTF (75 min): Cipla is currently positioned within the 75-min demand zone, characterized by a Rally Base Rally (RBR) structure.
ITF (Daily): The daily time frame indicates an upward trend at price trading at 20 EMA, a sideways movement when considering smaller swing levels.
HTF (Weekly): Zooming out to the weekly chart, there's a clear absence of resistance, setting the stage for potential bullish movements.
Trade Strategy 📈:
Zone Analysis: The 75-min demand zone is robust and presents a prime opportunity for a low-risk, high-reward trade.
Risk-Reward Ratio: Planning for a Risk-to-Reward Ratio of 1:4, ensuring a favourable balance between risk and potential profit.
Why This Trade Stands Out 🌟:
The 75-min demand zone serves as a stronghold for potential price movements.
The daily trend, Price trading at Daily EMA 20.
A lack of resistance on the weekly chart provides a favourable backdrop for an upward trajectory.
Final Considerations 🚀:
Cipla's current positioning offers not just a good trade but a high-reward opportunity. With a focus on the strong demand zone and a promising risk-reward ratio, this trade deserves attention.
Trade Smart, Trade Confidently! 💹✨
Disclaimer 🚨:
This analysis is for educational purposes only. I am not a SEBI registered analyst. Trade responsibly.

Stages of a Downtrend: Insights from AI AnalysisDear Respected Members of the TradingView Community,
I start with some straightforward insights. I've executed significant crypto sales this month. However, my decision was not because of any pre-established forecasts. The motivation behind my decision to part with cryptocurrencies like BTC was primarily due to liquidity challenges. I found it increasingly difficult to execute orders without impacting the market by moving prices, widening spreads, or settling for unfavorable market orders. Often, I had to exercise more patience than desired while waiting for the fulfillment of my limit orders. Eventually, when suitable over-the-counter (OTC) opportunities presented themselves, I decided to divest from these challenging assets. It's important to note that this decision was independent of price predictions.
Y ou can consider various factors beyond price movement for an investment choice. Factors such as trading volume, liquidity, spreads, and transaction fees can add value to your decision-making process. The focus points of this discussion are price forecasts, where trading volume is one of the influential variables.
F or those of you who have been tracking the trading volume candles from December 20, 2020, to the present, you may have observed a consistent decline in trading volume. Deep Neural Networks (DNN) tend to associate this declining volume with a waning interest in BTC-USD. While the overall trend for BTC has been bullish since November 14, 2022, DNN suggests that this rising trend could be a retracement within a broader bearish development that began on November 15, 2021. The significance of understanding the trend lies in assessing the risk-reward ratio. Generally, positions aligned with the prevailing trend offer a more favorable risk-reward ratio. An adaptive DNN model can add more than programmed indicators as it can adapt to changing market conditions and provide certainty metrics regarding potential trends.
A s per my adaptive DNN analysis, there is a 70% probability that the bearish trend will persist, compared to a 30% probability for a bullish trend. However, market dynamics are influenced by multiple trends, each exerting varying degrees of impact at different times. Fuzzy Logic Trading (FLT) reveals that factors associated with the bearish trend currently hold a 60% influence on BTC-USD, with bullish parameters contributing 40%. Probabilities offer insights into potential future scenarios, while membership degrees provide a more nuanced perspective on the actual forces at play within a given scenario.
A t present, the price of Bitcoin is approaching a juncture defined by multiple trendlines that may serve as resistance levels. One of these resistance lines previously served as a support level for local bottoms on January 2, 2023, March 13, 2023, and June 12, 2023. However, since Bitcoin breached this support line, it may have transitioned into a resistance line. It is just one example of a trendline that could act as a barrier, given the broader horizontal resistance zone extending between $38,000 and $32,000.
A nother notable resistance line within this zone is the trendline connecting the peaks of the bullish retracement tail on April 10, 2023, July 3, 2023, and the present. These examples illustrate the potential resistance trendlines, with the entire zone representing a supply margin where additional barriers may exist. It's worth noting that bullish trends can possess the strength to break through resistance trendlines or zones, transforming them into support trendlines and demand zones.
W hile an AI-driven analysis suggests a 30% probability of a continuing bullish trend, the market exhibits a 40% bullish influence from external factors such as news and prominent opinions, as determined by my Natural Language Processing (NLP) algorithm and mathematical tools from FLT. Should the BTC price establish a demand zone and initiate an upward trajectory from the support trendlines, the market could witness new local highs, potentially surmounting at least one of the aforementioned resistance trendlines within the supply zone. While this scenario does not guarantee a parabolic surge, it remains a possibility.
O n one hand, optimistic investor sentiment could potentially transform even the sharply rising resistance trendline into a support level, as indicated by the blue forecast in the chart. On the other hand, a 70% probability of a continuing bearish trend, as suggested by dynamic DNN, and a 60% bearish influence per FLT, even in the presence of a bullish trend, implies a degree of caution.
I n Finance, the path to profit is often a winding road, with ups and downs that can confound even the most seasoned investors. While many market participants tend to focus on bullish scenarios, it's essential to understand the various stages of a downtrend. Let's explore these phases and gain some insights from artificial intelligence. Every significant downtrend begins with a subtle sign – a warning of what's to come. Unfortunately, this early signal is soft while the bullish sentiment prevails. This initial warning is crucial for astute investors who pay attention to the nuances of the market. As the uptrend falters and inevitably fails, it becomes evident that the market is in a state of decline. This point often lures individuals into considering an all-in strategy, driven by the conviction that "It always goes back up." This misguided belief can lead to significant losses. Following the decline, there's typically a rally, which sometimes recovers a significant percentage from the previous drop. This rally can be deceptive, luring investors believing that a new bullish trend is underway. However, it's crucial to exercise caution and not be swayed solely by short-term gains. Tragically, the anticipated bullish trend often turns out to be a trap, leading to a prolonged and persistent downtrend. This phase can be particularly challenging for investors who have been misled by the allure of the initial rally.
M oreover, artificial intelligence has made significant strides in the field of market analysis. By employing Dimensionality Reduction (DR) techniques, AI can detect potential bearish butterfly patterns on full-timeframe BTC charts available through pricing engines. Additionally, AI has identified the presence of a bearish Head and Shoulders pattern in the yearly timeframe of 2023. It's important to bear in mind that patterns are essentially estimations of probabilities and potential volatility structures. Any pattern can break in either an upward or downward direction, signaling either a bullish or bearish scenario, respectively.
E xamining the Relative Strength Index (RSI) and the spread between the price and Exponential Moving Average (EMA) 20 reveals that they currently fall within a historically and statistically oversold range. Additionally, there is a lack of confirmation for breaching any of the aforementioned resistance lines, let alone the supply zone itself.
I n summary, a scalping strategy within the supply zone from the upper trendline to the lower boundary, as depicted in the short position on the chart, could be considered. If the bearish trend persists, other strategies may extend this short position beyond the resistance zone, potentially reaching the EMA 200 at around $25,000, where Bitcoin could encounter an underlying demand zone and various support trendlines.
I t's essential to remember that trading decisions should not be solely based on price forecasts. The cryptocurrency market is influenced by various factors, and price is just one of them. This is not intended as investment advice. I encourage you to conduct your research and take full responsibility for your funds. Past performance does not guarantee future results.
I n conclusion, understanding the stages of a downtrend is vital for any investor seeking to navigate the complexities of financial markets. Additionally, the integration of AI analysis can provide valuable insights, enhancing our ability to make informed decisions in the ever-evolving world of finance. Remember that no prediction is foolproof, and prudent risk management remains essential in the world of investment.
Warm regards,
Ely

black gold under bearish pressure + OPEC, weak global demandthe oil markets find themselves in a bearish chokehold with a number of factors weighing down on it such as the OPEC ( Organization Of Petroleum Exporting Countries) are expected to meet later this month on the 26 November 2023, there is a strong sentiment that they are expected to continue to cut production and distribution due to weak global demand.
technically i find that supply of proximal price @ 78.20 is in control of price and price is struggling to gain bullish momentum to keep trading above price of interest (support and resistance) @ 77.20
i have overall targets to liquidity areas @ 75.00
put together by Pako Phutietsile ( @currencynerd )

CAD/CHF ↗️ Long Trade Setup ↗️Hello Everyone 🙋🏽♂️
Oversold + Demand zone
🟠 EP 0.64492
🔴 SL 0.64130
🟢 TP1 0.64861 ⚠️( Close 33% of the trade and Set the SL on EP )⚠️
🟢 TP2 0.65228 ⚠️ ( Close 33% of the trade )⚠️
🟢 TP3 0.65607 🔥 ( Final result)🔥
We are not responsible of any losses for anyone, our trades are profitable more for long terms and we take losses as everyone,
manage your lot size as well and your SL and TP and my opinion is 0.01 lot for each 500 $.
Don't forget to hit the like bottom and write a comment to support us.
Follow us for more 🙋🏻♂️
Best Regard / EMA Trading .
Disclaimer:
----------------
It's not a financial advise, As everyone we take losses sometime but for long term trading we are profitable traders, so manage your account well with SL and TP and your lot size to keep your account safe and stay in the market

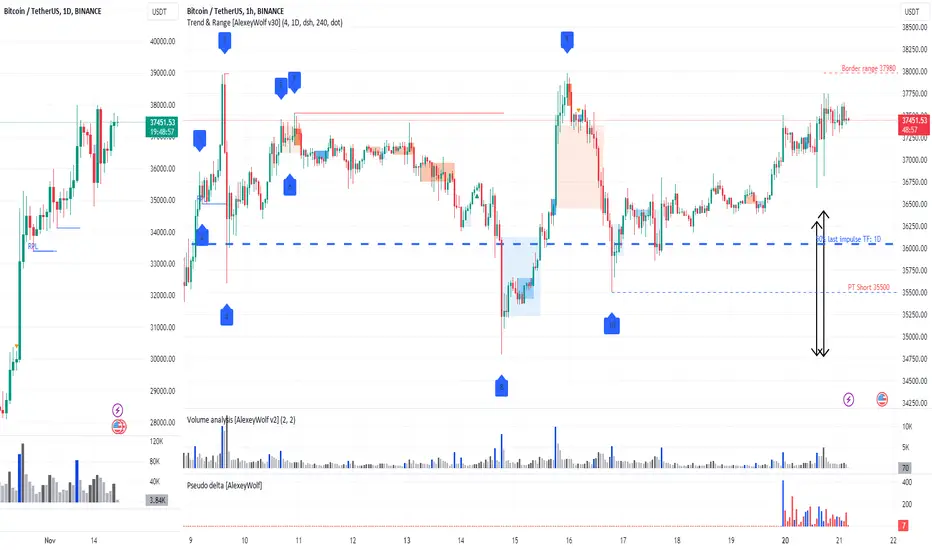
BTCUSDT. Waiting for the local high to be updated. Highlights
Waiting for the price to interact with the upper boundary of the sideways range at 37980.
Preference (buying/selling) - neutral.
Description
On the hourly timeframe, a sideways movement has been observed since November 9th. The upper boundary of the sideways range is at 37980. Judging by the wicks of yesterday's hourly candles (see chart), buyers are pushing the prices beyond the sideways range. Buying at the top of the range is not systematic. But if you really want to trade, you can aggressively look for buys when buyers defend the wicks of yesterday's hourly candles. (if the price returns there before breaking out of the sideways range).
31812, 36677 - boundaries on the five-minute timeframe
37302 - boundary on the one-minute timeframe.
XAGUSD buy setuphi dear traders. based on this chart, we can set a buy limit above our zone for 1:1 or 1:2 R/R
consider this based on your prespective and strategy.
Cheers.

Balancing Bullish Trends and Counter-Trend PossibilitiesGBPAUD seems to be in a Bullish Trend, and you're focusing on potential buying opportunities. Here are three strategies you're considering:
Type2 Bullish Fib-3 Bat (1-hourly chart) : This setup aligns within the support level of the 4-hourly chart at 1.9053, providing an initial buying opportunity.
Bullish Deep Gartley Pattern (4-hourly chart) : Should the market decline further, your plan includes waiting for the completion of the Bullish Deep Gartley Pattern at 1.8948 on the 4-hourly chart, presenting another potential buying opportunity.
GBPAUD appears to offer multiple setups for potential long positions based on your analysis.
What are your thoughts on GBPAUD, and what trade plans or strategies are you considering for this pair?
Feel free to share your insights or plans below!

USD/JPY ↗️ Long Trade Setup ↗️Hello Everyone 🙋🏽♂️
Oversold + Demand zone
🟠 EP 149.635
🔴 SL 149.065
🟢 TP1 150.225 ⚠️( Close 33% of the trade and Set the SL on EP )⚠️
🟢 TP2 150.805 ⚠️ ( Close 33% of the trade )⚠️
🟢 TP3 151.415 🔥 ( Final result)🔥
We are not responsible of any losses for anyone, our trades are profitable more for long terms and we take losses as everyone,
manage your lot size as well and your SL and TP and my opinion is 0.01 lot for each 500 $.
Don't forget to hit the like bottom and write a comment to support us.
Follow us for more 🙋🏻♂️
Best Regard / EMA Trading .
Disclaimer:
----------------
It's not a financial advise, As everyone we take losses sometime but for long term trading we are profitable traders, so manage your account well with SL and TP and your lot size to keep your account safe and stay in the market

AUD/CHF ↗️ Long Trade Setup ↗️Hello Everyone 🙋🏽♂️
Oversold + order block + Demand zone
🟠 EP 0.57523
🔴 SL 0.57369
🟢 TP1 0.57675 ⚠️( Close 33% of the trade and Set the SL on EP )⚠️
🟢 TP2 0.57830 ⚠️ ( Close 33% of the trade )⚠️
🟢 TP3 0.57986 🔥 ( Final result)🔥
We are not responsible of any losses for anyone, our trades are profitable more for long terms and we take losses as everyone,
manage your lot size as well and your SL and TP and my opinion is 0.01 lot for each 500 $.
Don't forget to hit the like bottom and write a comment to support us.
Follow us for more 🙋🏻♂️
Best Regard / EMA Trading .
Disclaimer:
----------------
It's not a financial advise, As everyone we take losses sometime but for long term trading we are profitable traders, so manage your account well with SL and TP and your lot size to keep your account safe and stay in the market
