GU long trade playing outThe 15 minute setup is playing out quite nicely. Going to be looking for a re entry tomorrow as well this time leaving the full position open to target the 4H high.
I will start posting more trade updates like this regularly after my analysis
Demand Zone

Navigating GBP/JPY with Care and Confidence this weekA promising setup for GBP/JPY this week would be to closely monitor the potential supply levels around and keep an eye on any bearish confirmation forming in that region. Additionally, watching for any negative news releases or economic data related to both the British pound and Japanese yen could provide valuable insights into potential price movements. Remember to incorporate risk management strategies and stay adaptable to market conditions throughout the week.

15m time frame demand level crude oil
I've spotted a key demand zone for crude oil on a 15m chart. The demand level range is between 82.126-81.746. If the price retraces to this zone, I'll be considering a long position. Target for this demand level is set at 82.93, with a potential for a 2 risk/reward ratio.
I plan to exit the trade if there's a 15-minute candle closing below the demand zone

GU bullish setup targeting 4H highVery quick analysis on GU. Didn't go into a lot of detail of everything that could happen just focusing on what I'm currently seeing and that GU going long targeting the 4H high

USD/BRLFOREXCOM:USDBRL price is at a major resistance zone and seems to be forming a double top on the daily time frame. Price should start heading down. Worst case it breaks the daily zone and hits the Monthly descending trendline (red). Price is currently overbought on the RSI and Bollinger Bands so there is a high probability it will go down.

NASDAQNASDAQ showing bullish setup from different bullish confluences. As in longer perspective index is in bullish channel. Within bullish channel it has formed bearish correction which coincide with recent broken level and now a retest. Will bulls took benefit from these levels ?

Bitcoin ~~ 12k $I think Bitcoin is still in a bearish trend in its monthly trend and needs to complete its 5th Elliott Wave to continue its upward trend.
Bitcoin needs more demand to continue climbing, which is clearly seen in the $12,000 range.
#Bitcoin

HOOKUSDTHOOKUSDT was trading in bearish trend and now has given the breakout from declining trendline. currently the price is creating support zone around breakout region, 0.9395, will the buyers attach this region and push price even higher?

AUDCADAUDCAD is reaching to very strong demand zone. As the pair is still in local bearish parallel channel, the bottom of channel is also coinciding at demand zone around 0.8750 region.
In past this region shown a strong bullish rally, are the buyers still waiting for this level?

FETUSDTFETUSDT is trading in bearish parallel channel and reached at very strong demand zone. In past this demand zone shown very fine bullish reaction. Currently the price is also giving respect to declining trendline. Once the price is able to break declining trendline it will be a nice bullish run.

15m time frame demand level for GoldI've spotted a key demand zone for Gold on a 15m chart. The demand level range is between 1949.615-1947.885. If the price retraces to this zone, I'll be considering a long position. My target is set at 1959.645, with a potential for a 5.1 R reward.
I plan to exit the trade if there's a 15-minute candle closing below the demand zone

31 JUL Monday nifty 50 LEVEL Red selling zone and green buying zone level learning and education purpose only
Like share and follow

CADJPY - Bearish Double TOP📉Hi Traders👋🏻
On The Daily Time Frame The CADJPY Price Reached A Resistance Level (107.400-107.812) and 61.8 fibonacci retracement level !
Currently, The Price Formed a Double Top Pattern📉
The Neckline is Broken🔥
So, I Expect a Bearish Move📉
i'm waiting for a retest...
-----------
TARGET: 104.950🎯
___________
if you agreed with this IDEA, please leave a LIKE, SUBSCRIBE or COMMENT!

GBPCHFGBPCHF is been in strong bearish trend and hitted the long term daily demand zone. As of now the the price has shown the fairly good reaction from this level. Currently the price is been range bound and seems like it is ready to break range.

USDJPYUSDJPY broke through bearish parallel channel. The market has created local demand zone around 140 region and showing good bullish momentum from that zone. Will the market sustain this momentum and continue to rally ?

EURCADEURCAD broke through bearish parallel channel. The market has created local demand zone and showing good bullish momentum from that zone. Will the market sustain this momentum and continue to rally ?

CTSIUSDTCTSIUSDT has given the breakout from falling trendline and has created the local support zone and now showing good bullish momentum from this zone. Will this bullish momentum will be hold and CTSI will fly ?

📈🐂 EURUSD Technical Analysis: Bouncing on Demand Zone! 🚀🐂Hey traders! 🐂📈 Exciting times ahead as we've got a bullish setup on the EURUSD forex pair in the 1-hour timeframe. Let's dive into this opportunity! 📈🐂
💹 Demand Zone Bounce: The price action bounced strongly on the demand zone, indicating an area where institutions have placed their orders and are likely to defend this level.
📈 Descending Channel Breakout: Adding to the bullish momentum, the price broke out of a descending channel and retested it successfully, signaling the start of a highly potential bullish impulse.
💡 Take Profit Zones: As we ride this uptrend, my take profit zones are strategically placed at 1.11300, 1.12000, and finally, my target at 1.12600. Keeping an eye on these key levels is essential for managing the trade effectively.
🧐 Remember, trading requires careful analysis and risk management. Let's keep a close eye on this setup and make the most of potential trading opportunities. Wishing you success in your trading journey!
Feel free to share your toughts in the comments section, follow me for updates and don't forget to press the like button if this insight was helpful🚀

CADCHF - BEARISH MOVE📉Hello Traders👋🏻
On The Daily Time Frame The CADCHF Price Reached a Support Level (0.66430 - 0.65980).
Currently, This Key Level is Broken (Support Becomes New Resistance Level)🔥
So, I Expect a Bearish Move📈
i'm waiting for a retest...
-----------
TARGET: 0.65000🎯
___________
if you agreed with this IDEA, please leave a LIKE, SUBSCRIBE or COMMENT!

EURUSD LONG Long opportunity on the EURUSD pair from the point where buys where injected into the market. close attention should be given and also look for LTF confirmations

XVGUSDTXVGUSDT is in under strong sell pressure and has created strong demand zone with bullish divergence. These confluences giving the strong buy setup signals. What you guys think of it ?

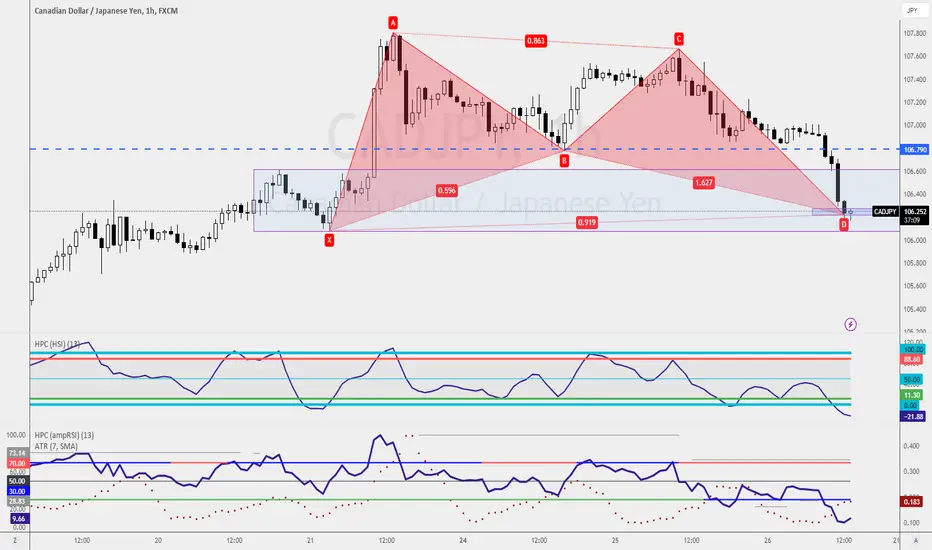
Bullish Bat Pattern within Buy Zone📈 CADJPY Bullish Bat Pattern 📈
Exciting opportunity on CADJPY! 🦅 A Bullish Bat Pattern is forming within the buy zone. 📊 Conservative traders target 106.79, while adventurous traders set their own targets. Remember to manage risk and stay informed. Follow @raynlim for more trading insights. Happy trading! 🚀
EURAUD I Long from bottom of the channelWelcome back! Let me know your thoughts in the comments!
** EURAUD Analysis - Listen to video!
We recommend that you keep this pair on your watchlist and enter when the entry criteria of your strategy is met.
Please support this idea with a LIKE and COMMENT if you find it useful and Click "Follow" on our profile if you'd like these trade ideas delivered straight to your email in the future.
Thanks for your continued support!
