RENDER Descending Triangle 4HBINANCE:RENDERUSDT seems to be forming a descending triangle on the 4H timeframe.
3 clear touches on resistance, and well-defined two-tap horizontal support at $2.50.
Key Levels to Watch 🔑
• $2.50-$2.75 Main support and daily demand zone
• $3.80-$4.20 Daily sell order block (potential resistance)
• $5.00-$5.20 4H sell order block (potential resistance)
Breakout Targets 🎯
⬆️ $5.00
⬇️ $1.50
Still in a No-Trade Zone, wait for confirmation (breakout candle close with good volume).
Demand Zone

LONG ON GBP/AUDGPB/AUD Has dropped to a nice demand level and has given a change of character on the lower timeframe.
I will be buying GBP/AUD expecting it to reach the nearest supply level for 400-600 pips.

ONDO Falling Wedge + Bullish DivergenceBITGET:ONDOUSDT is compressing inside a falling wedge, now trading near key support. Signs of potential reversal are building.
🔹 Key Observations
• Pattern: Falling wedge (bullish bias)
• Support: Price is holding just above the ~$0.68–$0.75 demand zone
• Volume: Declining throughout the wedge – typical pre-breakout behavior
• RSI: Bullish divergence forming + compression under 50, often seen before breakouts
🔸 What to Watch
• Breakout trigger: Daily close above wedge resistance (orange trendline), ideally with volume
• Target zones: $1.30 to $1.60, then $1.90 to $2.10 (prior S/R levels)
• Invalidation: Breakdown below the green demand zone ($0.68)
⚠️ As always, confirmation matters – no breakout yet. But the setup is clean and worth watching closely.

OptionsMastery: In a MONTHLY demand on UPS!🔉Sound on!🔉
📣Make sure to watch fullscreen!📣
Thank you as always for watching my videos. I hope that you learned something very educational! Please feel free to like, share, and comment on this post. Remember only risk what you are willing to lose. Trading is very risky but it can change your life!

Buy idea on NZDJPYBased On :
- Cycle analysis and quantitative data
- Poiv divergence on 4H
- Demand zone created by engulfing candle
-All cot operators are in the 156 extremes giving strong buy signal and open interest as well

GBP/USD Long up towards a short 1.28400 up to 1.30000GBP/USD (GU) Analysis – This Week
This week, GBP/USD presents multiple opportunities depending on how price reacts at key levels. Recently, price has been moving bearish due to the impact of Trump’s tariffs, but this doesn’t change the fact that the overall market structure remains bullish, with strong upside momentum over the past few weeks.
If price breaks this major structural level, we could see bearish pressure dominate in the coming weeks. However, this could also be a deep retracement before another bullish continuation.
Right now, I’m watching a clean 4-hour demand zone positioned below liquidity. If price moves lower first, I’ll also be keeping an eye on the 3-hour supply zone as a potential area for shorts.
Confluences for GU Buys:
- GU has been bullish over the past few weeks despite recent short-term bearishness.
- The U.S. dollar has dropped significantly, which is generally bullish for GBP/USD.
- There is liquidity resting above, along with imbalances that need to be filled.
- A clean 4-hour demand zone sits below liquidity, with an additional 5-hour demand zone further below.
Note: If price reacts to the current demand zone and moves higher, I will wait for a deeper supply zone, such as the one marked in Scenario D at 1.30800. However, I’ll remain patient and watch where price starts to slow down, accumulate, or distribute before making a decision.

Buy idea on AMAZON (AMZN)Based On :
- Presidential cycle and quinquennial cycle
- quantitative data
- strong demand zone covered by weekly and 2w as well
- divergence on Poiv (open interest from Nq) and Progo
- Undervalued conditions on weekly timeframe

Buy Idea on ADIDAS (ADS)Based on :
- Quinquennial Cycle and other years with similar european monetary policies
- Quantitative data
- Divergence on POIV (with 6E open interest) and Progo
- Undervalued Conditions
- Strong Demand zone covered by weekly demand as well

OptionsMastery: Looking for an immediate buy on RIOT!🔉Sound on!🔉
📣Make sure to watch fullscreen!📣
Thank you as always for watching my videos. I hope that you learned something very educational! Please feel free to like, share, and comment on this post. Remember only risk what you are willing to lose. Trading is very risky but it can change your life!

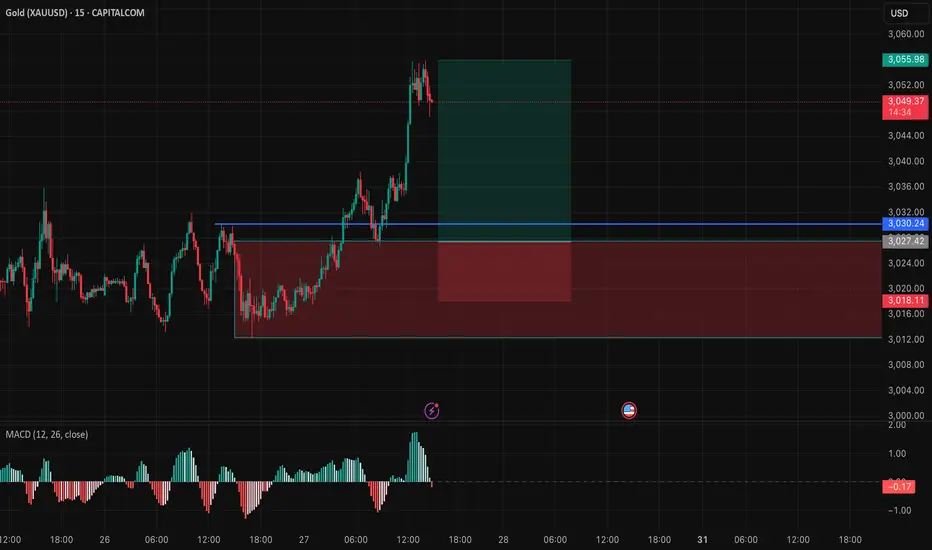
XAUUSD 15 min Chart Long IdeaHello Friends,
Gold had fly today without taking us let's try to catch up again oncenit will take the pullback with better entry positions.
Entry = 3027.42
SL = 3017.98
TP = 3055
We can break even the position after crossing the price 3040.
Please like, share, follow, and comment for more ideas
Thanks
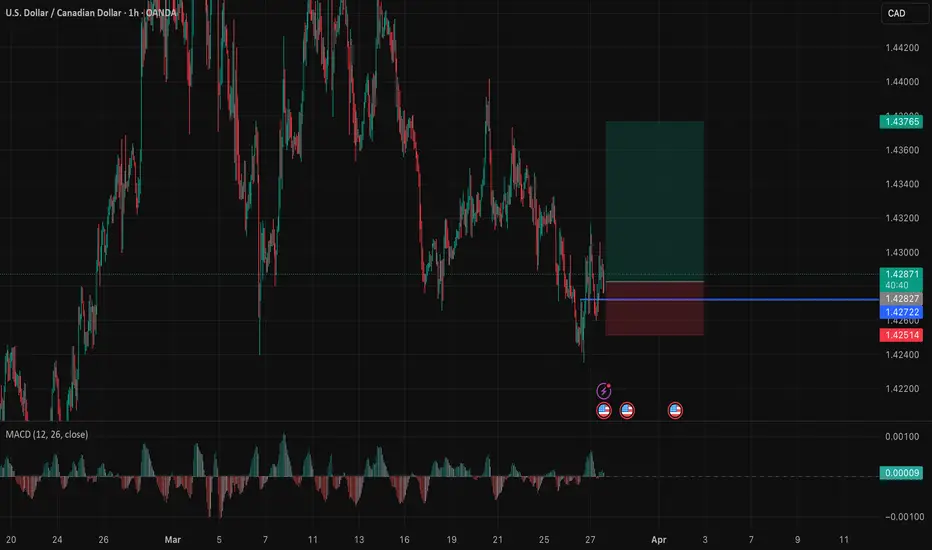
USDCAD 1 hr Chart Long IdeaHello Friends,
USDCAD found support on 4h timeframe and thus gives us opportunity for long positions.
Entry = Market Price
SL = 1.42509
TP = 1.43751
We can break even the position after crossing 1st resistance at 1.43077
Please like, share, and follow for more ideas.
Thanks
$NEO is back at its historical demand zone!NASDAQ:NEO is back at its historical demand zone 👇
Accumulated here for over 6 years — every bounce from this range led to massive rallies.
If it plays out again, $25–$45 isn't far-fetched.
Low risk, high reward? You decide.

Buy Idea On CADCHFBased on :
- Cycles and quantitative analysis
- Demand zone created by engulfing candle
- Small speculators shorting are 156w extremes on weekly chart
- Divergence on Poiv and Progo

GOLD 1H | Demand Zone Reaction & Breakout Plan – CelestiaPipsGOLD on the 1H timeframe is reacting from a previously tested demand zone around 3000 .
Watching for a clean break & retest above 3044 for bullish continuation toward 3065.
Trendline break could act as early confirmation.
Structure-based idea shared by CelestiaPips.

Nvdia has a new Aggressor.The boxes you are observing are the Larger scale supply and demand zones. These areas map out the current large liquidity. This includes the newest Player (collective players). This new player has been aggressively on the 17th and 18th.
Why does identifying a new aggressor matter?
New aggressors shape the way we view previous areas of supply and demand. Some look at the price getting to their target, without giving any thought to HOW it gets there.
In this instance:
Previous supply and demand have been established (we do not know how big they are or who is stronger). Some clues we do have is how it approaches these areas, and new aggressors can give us the clues we need... Will it bounce off demand? or fulfill it and continue lower?
New aggressors can put more pressure on these Demand or supply zones simply because they are becoming more aggressive closer to these areas.
Prediction
Scenario 1
Rolling over, and touching the 106 demand zone. Get's bought up, and new aggressors presents themself (bringing more demand). Price Target = 123.
If there is continued demand through this area, a case can be made for a 138 target before a correction/ reversal.
Scenario 2
New demand chews up this new aggressor. We should then have a bullish run to 131. 131 would present itself as a great short-term options (short).
Scenario 3
Rolling over with NEW (short) aggressors. This will put tons of pressure on the 106 players, and hopefully the 96's hang on (not charted).
Please feel free to share you input, thank you for taking the time.
Happy Trading!

GBP/USD Market Analysis: Potential Short Setup at ResistanceThe GBP/USD pair is trading near the **1.3000** psychological level, showing signs of consolidation after a strong bullish move. The chart suggests a potential reversal as price approaches a key resistance zone, with an apparent liquidity grab at the recent high.
The highlighted area around **1.2946 - 1.2921** represents a significant **H4 demand zone**, where price could retrace before continuing its next move. A break below this zone would indicate a deeper correction, with potential downside targets towards **1.2870** (OA level).
**Key Considerations:**
- A sustained break above **1.3000** could invalidate the bearish setup, leading to further upside momentum.
- A rejection at this level, combined with bearish price action, could confirm a short opportunity with a target towards the demand zone and lower support areas.
**Conclusion:** Traders should monitor price action around the resistance level and confirmation of a bearish reversal before committing to short positions. If bullish momentum persists, a breakout could open the door for further gains.

SOL Trading Plan: Stacking Entries Like a ProSolana (SOL) has been in a slow uptrend over the past five days, after hitting the low at $112. The current price action looks like an ABC corrective pattern, which could mean we’re setting up for lower prices.
To get the best trade execution, we'll use a laddered entry approach, meaning we’ll scale into positions gradually instead of going all in at once. This helps us get a better average entry price while managing risk effectively. By placing orders at key levels, we increase our chances of catching the right move without overcommitting too early.
Resistance Zone ($136 - $143.80)
A major resistance zone has formed between $136 - $143.80, where price is likely to struggle. This area contains multiple technical confluences that suggest a potential reversal or strong reaction:
$136 – 0.618 Fibonacci Retracement
$140.09 – 1:1 Trend-Based Fibonacci Extension
$141.40 – Anchored VWAP from the $179.85 swing high
$143.80 – Point of Control (POC) from the 19-day Fixed Range Volume Profile
This makes $136 - $143.80 a prime area to consider short positions, especially if price starts showing weakness.
Support Zone ($102.1 - $98.50)
On the downside, a major demand zone is forming between $102.1 - $98.50, where buyers are likely to step in aggressively. This zone has multiple technical confluences, making it a high-probability long entry area:
$102.1 – 2024 Yearly Open & Monthly Support
$100 – Bullish Monthly Order Block & Anchored VWAP Support
$98.50 – Final key demand zone
This zone presents a solid long opportunity, allowing for gradual scaling into positions as price moves deeper into support.
Short Trade Setup – Laddered Entry Approach
Instead of entering all at once, we’ll ladder into the short position gradually, starting small and increasing size as price moves deeper into resistance.
Short Entry Levels & Position Sizing
Trade Details
Average Entry Price: $140.12
Take Profit Target: slightly above $102.10 (Monthly Level)
Stop Loss: slightly above $146.70 (Above POC)
Risk-Reward Ratio (R:R): ~6:1
Long Trade Setup – Laddered Entry Approach
For the long setup, we start with small entries at higher prices and increase size as price moves deeper into support, ensuring a better average entry in a key demand zone.
Long Entry Levels & Position Sizing
Trade Details
Average Entry Price: $102.72
Take Profit Target: slightly below $120.00
Stop Loss: slightly below $95.00
Risk-Reward Ratio (R:R): ~2.45:1
Market Outlook
Short Bias: Until price reclaims $143.80, this remains a strong resistance zone for potential short trades.
Short Setup: Laddering into resistance ensures better risk management and higher average entry efficiency.
Long Setup: Starting small at $112 and increasing position size down to $98.50 ensures strong positioning in a high-confluence demand zone.
By scaling into trades rather than committing at a single price, we increase flexibility, improve trade execution, and adapt better to price movements. 🚀
Weekly Timeframe - 200 EMA Support
$100 coincides with the 200 EMA on the weekly timeframe, adding confluence to this area as strong support.
If Solana decisively breaks above $144, it would invalidate the short thesis and suggest a potential move higher toward $150. Conversely, a strong rejection from the resistance zone would likely accelerate the move toward $112 to test demand at swing low.

Chart is crystal clear. Reaction on divergence at support.All liquidity on the upperside are left open. No reason to not go down while these are open.

Buy idea on USD/SEKBased on
- Cycle analysis and quantitative data
- Strong Demand Zone
- Undervalued Conditions

US30 (Dow Jones) 4H & 1H Analysis US30 is currently trading in a well-defined downward channel, making lower highs and lower lows. The next critical support sits near the 31,880 “Major Low,” where any decisive break could lead to further downside. On the upside, watch for a potential bullish bounce targeting the fair value gap and Fib confluence around 32,400–32,500. A breakout above the channel top may signal a trend shift, while a rejection there would likely keep the bearish momentum intact. Always monitor price action and manage risk around these key levels.

Buy Idea on Amazon (AMZN)Based On Post Election Cycle,Demand Zone, Quantitative data and undervalued conditions
stop 194.99
entry 207.93
tp 246.84

Buy Idea On Rice (ZR1!)Based on
Decennial Pattern Cycle and quantitative Data
Strong Demand Zone
Entry 13.610
Stop 13.260
TP 14.660

How to Find Best Supply and Demand Zones/Areas in Forex & Gold
In this article, I will show you the strongest supply and demand zones.
These zones are called confluence zones.
I will teach you to identify these areas properly and explain how to apply it in Forex and Gold trading.
Let's start with a short but important theory.
In technical analysis, there are 2 types of supports and resistances.
Horizontal structures are supports and resistance that are based on horizontal key levels.
Vertical structures are supports and resistance that are based on trend lines.
A confluence supply or demand zone, will be the area of the intersection between a horizontal and vertical structures.
Look at GBPJPY pair. I underlined a significant horizontal support and a rising trend line - a vertical support.
We see a clear crossing of both structures.
The trend line and a horizontal support will compose a narrow, contracting area. It will be a confluence demand zone.
Within, with a high probability, a high volume of buying orders will concentrate, and a strong bullish movement will initiate after its test.
Above is one more example of a powerful demand zone.
It was spotted on a Gold chart.
Now let's discuss the supply zone.
There are 2 strong structures on GBPNZD: a vertical resistance - a falling trend line and a horizontal resistance.
These 2 resistances will constitute a confluence supply zone.
That is a powerful resistance cluster that will concentrate the selling orders. Chances will be high to see a strong bearish movement from that.
There is a strong supply zone on CHFJPY that is based on the intersection of a wide horizontal resistance and a falling trend line.
Supply and demand zones that we discussed are very significant. Very often, strong bullish and bearish waves will initiate from these clusters.
Your ability to recognize these zones will help you to make accurate predictions and identify a safe point to open a trading position from
❤️Please, support my work with like, thank you!❤️
