DENTUSDT - LONGBased on technical factors there is a long position in DENTUSDT
DENTUSDT
Score 3️⃣
🔵Long Now or set on Key Level 0.004025
🟢Target 1 0.004375
🟢Target 2 0.004850
❌Stop loss 0.003945
#K_Level
Every signal has a score from 1 to 5, so accordingly adjust your risk for each signal. The signals with the score of 5 are the most probable ones.
Please support our activity with your likes and comments.
Dentusdtlong

DENTUSDT - LONGThere is a long position in DENTUSDT Dent
DENTUSDT Dent
🔵Long Now or set on Key Level 0.004040
🟢Target 1 0.004430
🟢Target 2 0.004850
❌Stop loss 0.003920
#K_Level
Please support our activity with your likes and comments.

DENTUSDT AnalysisHello friends.
Please support my work by clicking the LIKE button(If you liked).Thank you!
Everything on the chart.
open pos: market and lower
target: 0.082 - 0.01 - 0.012
after first target reached move ur stop to breakeven
stop: ~0.005 (depending of ur risk). ALWAYS follow ur RM .
risk/reward 1 to 3
risk is justified
Good luck everyone!
Follow me on TRADINGView, if you don't want to miss my next analysis or signals.
It's not financial advice.
Dont Forget, always make your own research before to trade my ideas!
Will be very APPRECIATE FOR UR DONAT/coins :)
Open to your questions or suggestions(Looking for investors!).

?DENTUSDT to peak around $0.05 before BTCUSD peaks?• DENT has many similarities with LRC.
• One, both been depreciating against both BTC and ETH.
• Two, I’ve doubts about their real life use cases.
• Three, both are bubbly assets which I picked up during BTCUSD’s Consolidation Phase.
• Four, both do not acquiesce easily to TA (especially for short-term trading).
• Regarding the last point. I suspect the main contributing factor to be TradingView’s limited data for DENTUSDT. The earliest data is from Aug’19.
• However, a reasonable TA can be accomplished if we obtain DENTUSDT’s ATH of $0.10060 during the previous bullrun from CoinGecko, and compare DENTUSDT together with DENTBTC.
From the DENTBTC chart:
• During the previous bullrun, the 8.236 Fib from DENTBTC’s 1st peak to bottom brings us to 0.000007032, very close to her 2nd peak of 0.000006890.
• *My gut sense* is that with the pandemic, and DENT’s delayed launch of her eSim, DENTBTC will not fare as well as the previous bullrun when DENT was pumped up by the ICO hype. DENTBTC may very well only hit the 0.786 Fib level of 0.0000003169.
• Note: DENTBTC just turned bullish with the 8WSMA crossing over the 21W EMA.
From the DENUSDT chart:
• The 2.272 Fib from DENTUSDT’s peak during the previous bullrun to her bottom in Mar’20 gives us $0.022772. This is very close to DENTUSDT’s 1st peak during this bullrun of $0.022700.
• *If history is any indication*, applying the same 2.272 Fib to this bullrun’s 1st peak will give us a theoretical 2nd peak of $0.049589.
Putting both together
• *Assuming* our calculations to be accurate, 0.0000003169 BTC and a 2nd DENTUSDT peak of $0.049589 suggests that DENTUSDT will peak at around the point when BTCUSDT is at $156.5K.
• *Assuming BTCUSD macro trends persist*, DENTUSDT will peak before BTCUSD peaks.
• This $0.05 DENTUSDT peak may seem like an overly conservative target as it nears, and DENT moonbois may point out that DENTBTC has not surpassed its ATH of 0.000007032. RSI may also not reach overbought levels.
• However, as with many things, I’d rather be wrong but rich.

DENT/USDT Dent going to form Head &Shoulders pattern
your short target will be zone 0.006790
support my work by clicking the LIKE button(If you liked) and follow me .Thank you!

DENT Price ProjectionAnother good buy opportunity for DENT wireless. From the bullish pattern inverted HNS, it just pulled back for confirmation.
This project is good for long term as well because fundamentally it disrupt the telecommunication industry.
#DENTWireless #DENTUSDT

DENTDENT (USDT)
buy if breaking down trend line
sell 25% of your profit at target 1
and sell 50% of your profit at target 2
and sell the last 25% at target number 3 .
Good luck ......

DentusdtDent Forecast Basically on Elliott wave Principles and Priceactuon Strategy
You Can Buy and Hold

DENT breakout sideways potential Based on my TA, DENT is currently trading in sideways and is forming higher lows. and its trending above the 200MA which is a good indication to for an uptrend market structure.
I'd go long with 2-3 4hrs candles closure above $0.0082
SL: $0.0066
TP1:$0.0102
TP2:$0.0129
TP3:$0.0156


DENT looking very exciting .There is a big resistance her but dent trying to break trough it. Don't miss.

DENTUSDTIf Daily close above red line
Every thing is clear in the chart
Red is resistance
Happy trade
not a advice

Dentusdt breaking out Dent usdt is giving breakout after symmetric triangle and inverse Head and shoulder. Good gains are on the way.
DENT USDT Descending triangle Based on my TA on the weekly TF, DENT is forming a descending triangle, and currently is forming higher highs and higher lows. and its trading above the 50MA
I'd enter with a confirmation on the daily 2-3 candle sticks above $0.0068 most probably enter around $0.0069
with a SL = $0.006236
TP1: $0.0087
TP2: $0.011
TP3: $0.0139
TP4: $0.01736
TP5: $0.0226
*market structure was determined on the weekly TF
*Entry and TP points were determined on the daily TF
What do you think of this trade?


DENTUSDT DAILY UPDATEDivergence towards Stochastic and price action.
MA 50-200 Cross.
Await for enough liquidity.
Crucial retest zone.
Accumulation in price divergence.
Possible breakthrough.

Dent looks bullishDent looks bullish as the next target is 0.05$
So don’t forgot it from your investment

DENTUSDT Daily TimeframeSNIPER STRATEGY (new version)
It works ALMOST ON ANY CHART.
It produces Weak, Medium and Strong signals based on consisting elements.
NOT ALL TARGETS CAN BE ACHIEVED, let's make that clear.
TARGETS OR ENTRY PRICES ARE STRONG SUPPORT AND RESISTANCE LEVELS SO THEY CAN ACT LIKE PIVOT POINTS AND REVERSE THE WAVE (or act like a mirror that can reflects light) BASED ON STRENGTH OF THAT LEVEL.
ENTRY PRICE BLACK COLOR
MOST PROBABLE SCENARIOS TARGETS GREEN COLOR
LEAST PROBABLE SCENARIOS TARGETS RED COLOR
TARGETS ARE NOT EXACT NUMBERS THEY ARE MORE LIKE A ZONE.
DO NOT USE THIS STROTEGY FOR LEVERAGED TRADING.
It will not give you the whole wave like any other strategy out there but it will give you a huge part of the wave.
The BEST TIMEFRAMES for this strategy are Daily, Weekly and Monthly however it can work on any timeframe.
Consider those points and you will have a huge advantage in the market.
There is a lot more about this strategy.
It can predict possible target and also give you almost exact buy or sell time on the spot.
I am developing it even more so stay tuned and start to follow me for more signals and forecasts.
START BELIEVING AND GOOD LUCK
HADIMOZAYAN

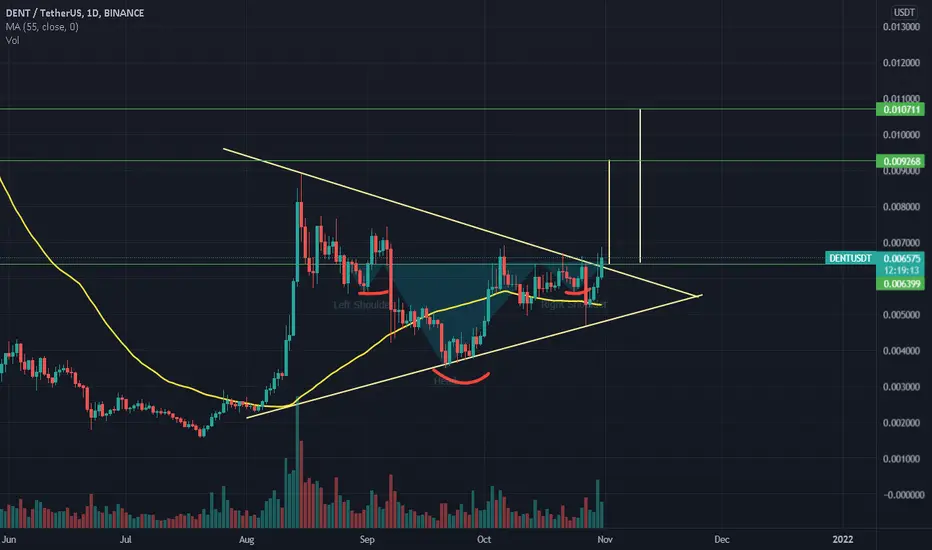
DENT Bullish Breakout soonSince DENT broke its trendline resistance of 1D chart, it has been consolidating near the newly created Demand zone while forming Right shoulder of the H&S pattern which can be observed on the chart.
It tried to break the Weekly Trendline resistance but failed to hold the price upward pushing the price below trendline again. The newly created demand zone managed to hold the support and it has been keeping the price stable for last couple of days while forming Right shoulder.
It wont be long before DENT tries for another breakout and this time combined with the Head and Shoulder pattern, it will most likely manage to successfully break above the resistance pushing the price towards its Local High.

DENT Bullish 📈DENT is in this lovely trend where it looks like it can break out on the daily chart.
I would wait for a confirmation of a break to enter, and then enter more position size if we have a pull back to that resistance and test it as new support.
I believe this should send DENT to its trend high.
Play with a tight stop loss and take profits on resistance levels.
Thanks to member Kyle for bringing this to my attention.

DENT USDTFor those who are interested in having a different wallet
Buy dent to get on your nerves every day
your own risk


DENTUSDT LONGFrom historic data it is evident that if the trend keep following the mirror reflection then DENT is all set to moon to 0.02 level.
