Hmm. Are we about to pop? Howdy.
SO..
Given the way BTC has been acting, it's hard for me to accept that this is a possibility.
- We have a descending broadening wedge, a BULLISH REVERSAL PATTERN that, if confirmed -will give us a TARGET OF $10.4K
- We also appear to be in the business end of the huge CUP AND HANDLE pattern
- ALSO, we are at the apex of the RIGHT SHOULDER in what many traders are calling an extremely large INVERSE HEAD AND SHOULDERS.
This is looking EXTREMELY BULLISH to me, but it's hard to believe considering the few days we've had.
BUT some things to consider:
BULLISH DIVERGENCE ON THE 8HR RSI
CME GAPS ABOVE, FIRST ONE AT $9K..
What do you all think?
Are we about to MOVE UP or head back down?
Descending Broadening Wedge

UVXY PROSHARES , Inverse Trade Fun!The ETF fund UVXY has exited out of a descending wedge and seems to be playing out. Regardless of the fact that it does reverse splits, this does seem to be a good play if not just in the short term. I have Fibonacci targets at $42, $63, and $79

XRP/USD Descending WedgeHello traders,
XRP/USD is breaking a descending wedge on 4h intraday charts, the Bitcoin is going up as well, giving space to altcoins grow in USD pairs, we belive XRP has a chance to test the Key Resistance level (Key Level is one point the price worked as support and resistance many times over those last moments.
Please, push like button and follow us to receive more trading ideas like this.


NZDUSD, a buy signal is starting to form!we are seeing price has reached the daily key support level (last roadmap link attached below!) and starting to form a descending broadening wedge pattern, please wait for trendline resistance breakout before placing any buy order. be patient!
Plan : trendline breakout --> wait for price to bounce off from daily key support level --> wait for the rejection candle pattern to form e.g. bullish engulfing , pinbar etc --> BUY
**Disclaimer** the content on this analysis is subject to change at any time without notice, and is provided for the sole purpose of assisting traders to make independent investment decisions.
Traders!! if you like my ideas and do take the same trade like i do, please write it in comment so we can manage the trade together.
_____________________________________________________________________________________________________________________
Thank you for your support ;)
GWBFX

UBER - Descending broadening wedge, look for breakoutUber looking for a potential short term rebound through the pivot point around $33.00
Look for opportunity to take profit at 35 where it initially lowered months back.
15% profit swing trade set-up.

EOS Descending Broadening Wedge Formation |Bull Flag|Low Volume Hello Traders!
Today’s chart update will be on EOSUSD which has a bull flag forming above the 200 MA average after breaking bullish from a descending broadening wedge formation.
Points to consider,
- Trend broke bullish
- 200 MA serving as support
- Local resistance from Fibonacci Extensions
- RSI respecting support
- Stochastics projected downwards
- Volume clearly declining
EOSUSD trend has broken bullish with a confirmation of an influx in volume from its descending broadening wedge. The technical target is associated with the first price touch in the formations upper resistance line.
The 200 MA is currently serving as support; EOS is consolidating and forming a bull flag which is a continuation pattern in this instance.
Local resistance is provided by the Fibonacci Extensions, EOS technical target aligns with the 1.277 Fibonacci Extension – a level prone to profit taking.
The RSI has bounced of support, currently holding in the upper regions as price consolidates. Stochastics is currently projected downwards, can stay trading in current region for an extended period of time as price develops.
Volume in clearly declining, an influx of volume will come to fruition in either direction, EOS needs bull volume for follow through from current probable bull flag formation.
Overall, in my opinion, a break will come to fruition, key levels have been broken which has changed the trend of EOS. Consolidation above the 200 MA is very bullish; especially with a bull flag forming, which will be confirmed with volume.
What are your thoughts?
Please leave a like and comment,
And remember,
“There are no guarantees in trading. The sooner you accept that you sooner you can release your expectations and focus unconditionally on a proven process.”
― Yvan Byeajee,

Qurate Retail LongMixed signals on this ,
Primary wedge ( white ) got broken but failed to rally due to lack of buyers, Head and shoulders pattern created from a secondary impulse up after break out , sending us to lower levels, secondary descending channel has been created where price consolidates in at the moment,
RSI on Daily shows class A bullish divergence, I was originally long on this and will be for as long as RSI confirms it.

Rolls Royce PLC longDesceding wedge with Bullish divergence on the MACD as shown on the Daily,
profits will be taken at the 0.5 Fib retrace level from previous all time high to current lows

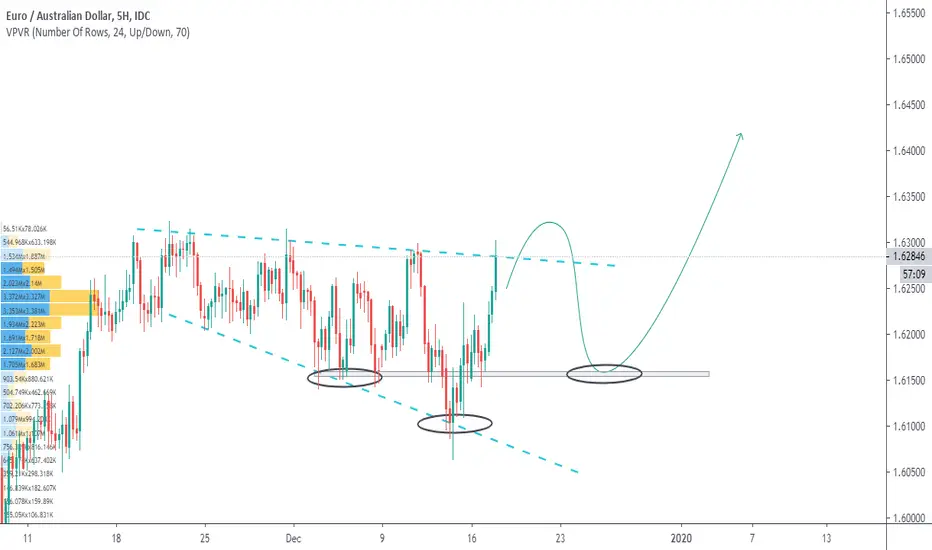
EURAUD forecast on H5, potential inverted H&S patternNote : i see the possibility of descending broadening wedge and inverted H&S pattern formation, we'll see ;)
**Disclaimer** the content on this analysis is subject to change at any time without notice, and is provided for the sole purpose of assisting traders to make independent investment decisions.
Traders!! if you like my ideas and do take the same trade like i do, please write it in comment so we can manage the trade together.
_____________________________________________________________________________________________________________________
Thank you for your support ;)
GWBFX
EURJPY, Buy on H5Note : descending broadening wedge pattern has been formed, then we can buy when the price returns to the support level, wait for the rejection candle to form (e.g bullish engulfing candle, pinbar .. etc)
**Disclaimer** the content on this analysis is subject to change at any time without notice, and is provided for the sole purpose of assisting traders to make independent investment decisions.
Traders!! if you like my ideas and do take the same trade like i do, please write it in comment so we can manage the trade together.
_____________________________________________________________________________________________________________________
Thank you for your support ;)
GWBFX

XBTUSD 4h Potential intraday/week bounce play, class A bulldivDescending wedge + class A bulldiv take profits early if there is any. I remain net short but opening this as a hedge.

EURGBP for buyThe price is near a support zone and it is forming a divergence with the MACD indicator.
There is also a descending wedge that has been broken and confirmed the change of trend.
The trendline indicates us a bounce in the price and it is been respected
Comment your ideas!

XBTUSD 1D DESCENDING WEDGE BULLISH BREAKOUT CHART PATTERNDescending Wedge is a repeatable Triangle trading chart pattern.
Descending Wedge chart pattern will have a directional bias depending on the previous incoming trend.
Each chart pattern will have defining trendlines of the support/resistance levels creating the pattern.
What ever time frame you are trading this chart pattern, wait for a candle close outside of the trendline in the direction of the breakout candle. (Our time frame preference is the Daily chart).
Add volume indicator - Volume is the amount of $ that went into a particular candle or in Forex the # of trades that took place.
Add ATR indicator - Volatility is the amount of price movement that occurred. Use the ATR to measure the price movement.
When you see descending Volume bars and descending ATR line (which indicates volatility) this shows
a dis-interest in traders to invest in this pair creating consolidation which creates the chart pattern.
Trade Management after there is a breakout candle close.
1 - Position size (compare volume bar to volume ma line).
a - Breakout candle must be 100% of average volume for a full position size.
b - If 75% of average volume then ½ position size. (To find 75% of Volume
look at the charts volume settings – divide smaller # into larger # = 75%+)
2 - Enter two trades.
3 - SL for both trades will be 1.5 x ATR.
4 - 1st trade TP will be 1 x ATR.
5 - No TP on 2nd trade – letting profit run and adjusting SL to follow price.
6 - When 1st TP hit – move 2nd trade SL to breakeven.
7 - Adjust the 2nd trade SL to follow price.
*8 – After Breakout candle – if price closes back into chart pattern close trade
*9 - When breakout candle is more than 1 ATR from breakout candle open.
a - Enter 1st trade at candle close with ½ position size.
b - Enter 2nd trade with a pending limit order that is 1 ATR of breakout candle open.
c – Price should pullback to that pending limit order for 2nd trade.
d – If Price returns back into chart pattern close trade before SL is hit.

McDONALDS 1D BULLISH WEDGEWedges are repeatable trading chart patterns.
Wedges are a form of Triangle chart pattern and will have a specific directional breakout bias.
A descending wedge has a bullish long breakout bias.
Each chart pattern will have defining trendlines of the support/resistance levels creating the pattern.
What ever time frame you are trading this chart pattern, wait for a candle close outside of the trendline in the direction of the breakout candle. (Our time frame preference is the Daily chart).
Add volume indicator - Volume is the amount of $ that went into a particular candle or in Forex the # of trades that took place.
Add ATR indicator - Volatility is the amount of price movement that occurred. Use the ATR to measure the price movement.
When you see descending Volume bars and descending ATR line (which indicates volatility) this shows
a dis-interest in traders to invest in this pair creating consolidation which creates the chart pattern.
Trade Management after there is a breakout candle close.
1 - Position size (compare volume bar to volume ma line).
a - Breakout candle must be 100% of average volume for a full position size.
b - If 75% of average volume then ½ position size. (To find 75% of Volume
look at the charts volume settings – divide smaller # into larger # = 75%+)
2 - Enter two trades.
3 - SL for both trades will be 1.5 x ATR.
4 - 1st trade TP will be 1 x ATR.
5 - No TP on 2nd trade – letting profit run and adjusting SL to follow price.
6 - When 1st TP hit – move 2nd trade SL to breakeven.
7 - Adjust the 2nd trade SL to follow price.
*8 – After Breakout candle – if price closes back into chart pattern close trade
*9 - When breakout candle is more than 1 ATR from breakout candle open.
a - Enter 1st trade at candle close with ½ position size.
b - Enter 2nd trade with a pending limit order that is 1 ATR of breakout candle open.
c – Price should pullback to that pending limit order for 2nd trade.
d – If Price returns back into chart pattern close trade before SL is hit.

ZEC weekly log scale SharkUsually when measuring the retracements for potential harmonics we use the Linear Fibonacci scale but i think it might be acceptable to use the FIB tool adjusted for log scale in certain instances and this is one of them.
Pay no mind to the numbers auto generated by the Cypher tool as those numbers are only Linear scale retracements and the tool doesn't have a log scale adjusted option like the FIB tool does.
For those who would like to check the measurements themselves I have color coded each individual set of waves:
XA-B retrace in Orange
AB extension to C in Blue
BC extension to D in Green
X to C retrace to D in Black.
I have also marked the PCZ of the shark in the Blue Box if pattern is valid we will see a reversal between the 886 and 1.13 retracements.
Price-wsie that's between 37-15 dollars
Yea i know, that's a huge zone of reversal but that's the nature of a Shark pattern.
because of how big the reversal zone is it is too early to plot fib targets for the pattern for i currently don't have a definite price to fib from yet but something i can say is no matter where it reverses in this zone even a 0.382 and 0.50 retrace would yield a 100-200% move.
Alternatively I have also spotted a broadening and descending wedge marked in the green trendlines and are currently showing TDI-RSI bullish divergence from the lows back in December and February to our current lows a breakout of the wedge on it's own gives us a measure move back to around 300 if we're being conservative.
ZEC has never been my favorite coin but based off the technicals presented here i find no harm in trying to own atleast a few of them then forgetting about them to see how this pattern plays out.

BIOT LongGood Entry for a little swing
Biot tripple bottomed and tripple bullish divergence on the RSI.
Trading inside a descending wedge for the last couple of weeks that signals that price action sending the price north is due .

Natural Gas LongLoading on the long position for Natural Gas, being trading in the descending broadening wedge for a while price gives first signals of bullish divergence on the MACD and the RSI on the 1H timeframe , a signal that we gained some value on these levels and buyers are coming in .

USDJPY, Buy on H1**Disclaimer** the content on this analysis is subject to change at any time without notice, and is provided for the sole purpose of assisting traders to make independent investment decisions.
Traders!! if you like my ideas and do take the same trade like i do, please write it in comment so we can manage the trade together.
___________________________________________________________________________________________________________________________________________
Thank you for your support ;)
GWBFX

Tesla Long Here is a macro picture for Tesla on the weekly time frame.
Tesla broke out that descending channel that was trading in for months , retested forming a descending wedge that also broke up to the upside , and now and on its way up .
Long term positions with profits at 0.5 => 279, 0.618 => 302 , 0.786 => 335
Currently price is above the 21 ema -blue line- and 20 ema -white line - with the 21 ema being higher than the 20 ma
In most cases while 21 ema stays above the 20 ema price runs to the upside, when the opposite occurs price action tends to become less volatile and retests the 20 ema with possible change on trend .

BTC ready for a swing up Head and Shoulders played out , What followed was a retest on of the level of the last peak of the descending wedge we broke out from yesterday ,
While doing that price did consolidate inside a descending broadening wedge which is bullish, Broke out to the upside , retested back on the top side of it and now we are set for another run to the upside,classic text book wedge analysis is manifesting nicely on the price action of bitcoin the last couple of days.
Being on a weekend though where volume tends to drop ,liquidation hunts from platforms are in full action , so one has to pay extra attention while swing trading - especially with stop limit orders -

BTCUSD H1 chart (8/23/2019)Good morning, traders. Price hit our target from yesterday. The H1 chart is what I posted to our premium Discord community prior to price popping up this morning. At this time, the H1 RSI and Stoch RSI still have room to continue higher. If price closes above the ascending channel resistance in the next two hours, then we should be looking for it to target the ~$10800 level which is at the EQ of the H4 supply. That will then take price above the descending channel/broadening wedge resistance which should indicate a target of the R2 pivot at $12500. Obviously price won't spike up to that point, so traders should expect pullbacks along the way.
Zooming out to the D1 chart, traders will notice the large ascending channel whose EQ price just popped through. Price is now on the topside of that channel once again, which is bullish. Today's large green candle, if it closes as such, should confirm yesterday's possible reversal doji. The H4 is starting to look more bullish with this recent move up. We can see expanding volume and candle spread from the August 21st swing low. A close above the pivot would be considered bullish. H4 RSI is nearing its descending resistance with a close above it likely signalling the larger move up. Stoch RSI is overbought but has room to continue moving up for now.
_____________________________________________________________
Be sure to hit the "thumbs up!"
Every day, we have a choice to act positively or negatively, so if you get a chance, do something decent for someone today which could be as simple as sharing a nice word with them. You just might change their day, or even their life.
You can always click on the "share" button in the lower right hand of the screen, under the chart, and then click on "Make it mine" from the popup menu in order to get a live version of the chart that you can explore on your own. When you do, be sure to explore the other TFs to see what I'm watching on those TFs.
