MANA/USDT upward momentum from bullish OB? 👀🚀MANA analysis💎 Paradisers! #MANAUSDT closely as it demonstrates robust signs of a bullish continuation from the Bullish OB.
💎 Observing its recent price movements, EURONEXT:MANA has successfully breached its descending resistance and is now primed for an ascent starting from the Bullish OB at $0.4317. Should this momentum sustain, we anticipate a strong push towards the supply area at $0.5597, though we may see some initial resistance that could trigger a substantial rise.
💎 It's also important to note the reduced intensity of rejections at this OB level, suggesting a weakening of resistance. If this level fails, we are ready to leverage a bullish rebound from the foundational support at $0.3910. The significant liquidity at this level suggests that #MANA could experience a powerful bullish recovery. However, a break below this Order Block might precipitate a considerable drop in price.
MyCryptoParadise
iFeel the success🌴
Descending Channel

GBPUSD → A false breakout draws a pin bar. Sellers are winning FX:GBPUSD is forming a test of the resistance level at 1.271. There is a struggle for the level during the week and apparently the sellers are winning (pinbar is formed and consolidation under the level).
Technically, the downtrend was broken earlier, but there was no confirmation of the boundaries and confirmation of the trend change, so the area of 1.271 may become the zero point for the beginning of the correction. The currency pair on the background of fundamentally strong dollar may go down to 1.2664 with the subsequent breakout and fall to 1.257. Overall, the environment is unstable due to high inflation and regulators' decisions.
Resistance levels: 1.271, 1.28
Support levels: 1.2664, 1.257
I expect the beginning of correction to the support area, although the bearish channel was broken earlier, but there are no strong bulls in the market yet.
Regards R. Linda!

BLURUSDT → Trend break and positive fundamental background BINANCE:BLURUSDT breaks the trend resistance and forms a retest of the upper flat boundary, which will keep the bulls from strong growth for some time. A pullback is possible before further growth
The cryptocurrency market is reviving on the back of bitcoin rally as well as Ethereum rally due to positive news.
As for BLUR: The coin is breaking resistance, but ahead of it is a strong area 0.4367-7375 - the upper boundary of the pullback or flat, previously there was a strong trend and bears are quite actively defending this zone. A small pullback or consolidation may be formed, the market needs to gather liquidity to overcome this area.
Support levels: 0.36
Resistance levels: 0.4367, 0.4375
The market is forming a trend change signal, but we need to wait for its confirmation: consolidation above 0.4367. This may cause a rally to 0.6 - 0.7.
Regards R. Linda!

APEUSDT → The coin gives indications to possible growthBINANCE:APEUSDT forms a conglomerate of patterns, the realization of which can lead to a trend change or forging rally. A bear market may change to a bull market
The coin has found a bottom by forming a strong pattern. Consolidation is forming, but local prerequisites give an opportunity to the growth of the coin.
On the local timeframe the price broke the trend resistance and is testing the upper boundary of the triangle. A break of the resistance will give the bulls confidence, which may provoke the formation of a rally. It is worth paying attention to 1.321. Consolidation above this area will be a strong confirmation of the trend change.
Support levels: 1.120
Resistance levels: 1.25, 1.32
I expect the growth to continue after consolidation above the key liquidity area. Consolidation may move to the realization phase.
Regards R. Linda!

Bitcoin - new ATH soon. Best time to buy nowBitcoin looks very strong at this moment. We can see that the price is breaking out of the descending parallel channel on the daily chart. The price is above the channel and has already retested the downward-sloping trendline. We should see a strong pump from the current price.
Why is bitcoin pumping? From a technical perspective, it's pretty easy to say. Take a look at the previous price action. We have a false breakout below the key levels; it was a bear trap created by market makers to get as much liquidity as possible for their huge orders, as they cannot simply do so whenever they want.
From the Elliott Wave perspective, there is nothing bearish at this moment. I see that the corrective pattern WXYXZ has been completed, and we are starting a brand new impulse wave to the upside. The next target is around 71k because we have his important red trendline, so make sure you are aware of it.
Let me know what you think about my analysis, and please hit boost and follow for more ideas. Trading is not hard if you have a good coach! Thank you, and I wish you successful trades.

GOLD - Buy after this pullback!Gold is extremely bullish and is expected to double its value in the next few years. We want to take advantage of this bull market and implement long-only strategies on futures. Right now, GOLD is breaking out of the descending channel, but I want to see a retest of it. The price broke out of this channel but created a fair value GAP. These GAPs tend to be filled sooner or later, so do not FOMO in and wait for a proper retest. Then we can open a leveraged trade with a high probability of success and a high risk-to-reward ratio.
From the Elliott Wave perspective, we have finished the WXYXZ corrective pattern, which is also great to see! We are starting a brand new impulse wave to the upside, so prepare your limit orders. It's time to buy gold again.
The next significant resistance is the previous ATH. I do not really see anything special that is worth mentioning. Take only the best opportunities with a high success rate.
Let me know what you think about my analysis, and please hit boost and follow for more ideas. Trading is not hard if you have a good coach! Thank you, and I wish you successful trades.

NZDUSD sell setupNZDUSD is in a downward trend channel. This suggests that the New Zealand dollar is weaker than the US dollar. Price has recently showed some rejection at the top of the channel therefore we are looking to sell. The Take Profits target should be 0.58807 .We will set our Stop Loss at 0.60400 to manage risk in case the price reverses. It is important to closely monitor the trade and adjust the Stop Loss as needed to protect profits. Trading in the direction of the trend channel can help increase the probability of a successful trade.

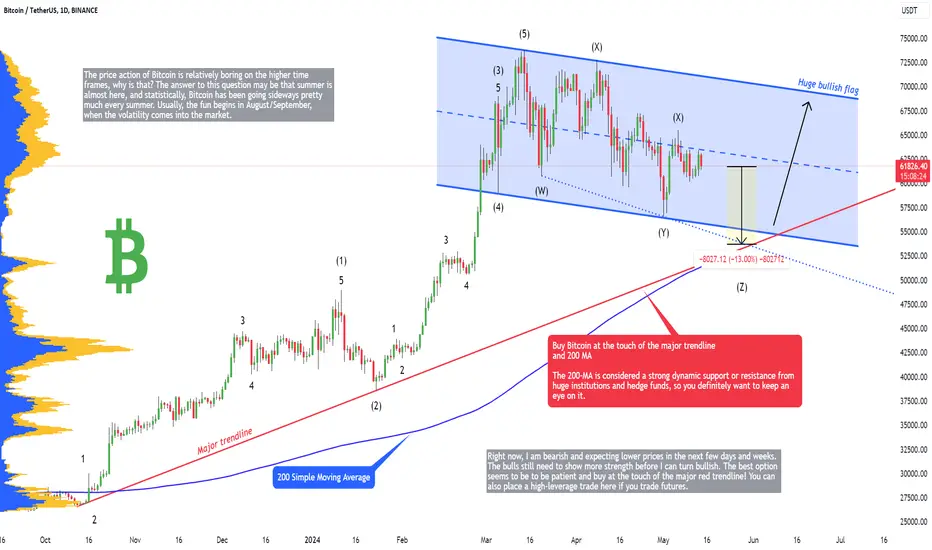
Bitcoin - Ultimate bottom will be here, but now 13% crash!The price action of Bitcoin is relatively boring on the higher time frames, why is that? The answer to this question may be that summer is almost here, and statistically, Bitcoin has been going sideways pretty much every summer. Usually, the fun begins in August/September, when the volatility comes into the market.
What can we expect from Bitcoin in the following weeks? I am expecting a 13% crash because we need to hit the major red trendline on the daily chart. This trendline should hold the price of Bitcoin to the end of the bull market, so you want to buy every touch of it! We also have a 200-daily moving average that is currently pretty much at the same price as the mentioned trendline. The 200-MA is considered a strong dynamic support or resistance from huge institutions and hedge funds, so you definitely want to keep an eye on it.
The price of Bitcoin is inside the bullish flag pattern, as you can see on the chart. This is a pretty strong confluence with the trendline to buy cheaper Bitcoin. Right now, I am bearish and expecting lower prices in the next few days and weeks. The bulls still need to show more strength before I can turn bullish. The best option seems to be to be patient and buy at the touch of the major red trendline! You can also place a high-leverage trade here if you trade futures.
Let me know what you think about my analysis in the comment section, and please hit boost and follow for more ideas. Trading is not hard if you have a good coach! Thank you, and I wish you successful trades.
EURUSD → Retest of downtrend resistance amid weak $FX:EURUSD is heading towards trend resistance with interest. This is also supported by the weak dollar, which is standing still. But, the currency pair is still in a bearish trend
Buyers are trying to strengthen the euro. On D1 a consolidation format of movement is formed. In this case, the pair may test the trend resistance, but it will be difficult to break it the first time, because the dollar will continue to rise in price for some time due to the actions of regulators, which will affect the euro.
Resistance levels: 1.0802, 1.0864
Support levels: 1.0736, 1.0703
At the moment there is a probability of a retest of the resistance area, but the bears can give strong resistance to the buyers' interests, which in general can be reflected as a pullback from the upper boundary of the trend.
Regards R. Linda!

GBP/USD Testing Daily Resistance Ahead of UK Data Sterling ended the week a touch lower versus the US dollar, down -0.2% and snapping a two-week bullish phase. As we enter the second full week of May, the GBP/USD currency pair will be monitored closely ahead of Tuesday’s employment and wage data out of the UK, with technical studies indicating a bearish move could be on the table.
Long-Term Picture
Price action on the monthly chart continues to hold under resistance at $1.2715, which has been the case since late 2023. This is currently reinforced by the daily chart wrapping up the week testing channel resistance, drawn from the high of $1.2894, a descending line complemented by a horizontal resistance level at $1.2527.
While one may argue that the monthly chart is in the early stages of an uptrend, the high at $1.3142, located near the next layer of resistance at $1.3111, would likely need to be breached before a long-term uptrend can be confirmed with any conviction.
As things stand, the monthly support level at $1.2173 is viewed as the next logical longer-term downside target for GBP bears and the trend currently supports sellers (this would be strengthened were a break of $1.2173 to be seen). This is also aligned with the daily chart’s downtrend, printing clear lower lows and lower highs since pencilling in a top at $1.2894. Further supporting bears, both monthly and daily charts reveal that the Relative Strength Index (RSI) is testing the underside of the 50.00 centreline, indicating possible resistance.
Short-Term Picture
From the H1 timeframe, price action concluded the week at the underside of resistance from $1.2530, set just ahead of the $1.25 handle. Space north of current resistance draws attention to prime resistance coming in from $1.2583-$1.2560. Knowing that the longer-term trend is facing southbound and daily price is testing resistance from $1.2527, H1 resistance from $1.2530 or the prime resistance at $1.2583-$1.2560 could be areas that sellers welcome this week, taking aim at $1.25, followed by H1 support from $1.2459 and perhaps $1.24.

Possible BTC Breakout! Eyeing $70k!!Hello everyone! If you enjoy this content, please consider giving it a like and following for more updates.
The chart suggests a potential breakout from a descending channel pattern for Bitcoin (BTC), followed by a retest of the broken trendline as support. If this retest holds, there could be a significant price increase towards $70k. The 50MA is also acting as a potential support level.
Here's what could invalidate this bullish scenario: A daily candle close below $61.5k.
What do you think about this potential price movement? Share your thoughts in the comments below!

TRBUSDT → Trend change, buyers provoke growth. 150.0?BINANCE:TRBUSDT finds its buyer. A breakthrough of the downtrend resistance is formed and the accumulated potential is realized. The probable target may become the area of 150-160.
The retest of the bottom forms a strong enough medium-term reversal pattern - double bottom. A buyer appears on the market, which is generally seen in candlestick patterns and price movement on the background of volume growth. The price breaks the resistance of 99.3 and enters the local range where it can form consolidation. There is a high probability of catching a retest of support before further breaking 110.0 and rising to the previously mentioned targets.
Support levels: 99.32, 89.75
Resistance levels: 110.0, 126
Technically, the coin has an interesting potential, the realization of which may continue with the breakout of 110.0.
Regards R. Linda!

GOLD → The correction is ending. Rally to 2400FX:XAUUSD is moving from the consolidation phase, to the phase of realization of accumulated potential and rallying to 2400. The price enters one of the key ranges.
The fourth wave of correction is coming to an end and a rally within the V wave is being formed. The potential target could be 2400-2550. The price is returning to the range of 2398-2362. If the bulls keep the price above the 2362-2352 area, it will confirm their intentions and open the way to 2400-2450. Fundamentally, gold has a good potential on the back of the falling dollar index
Resistance levels: 2382, 2398, 2417
Support levels: 2362, 2352
Within the framework of the bullish wave after the rally may be followed by a small correction or consolidation, but the bullish movement and the trend as a whole may get its continuation.
Regards R. Linda!

Bitcoin is ready to reach 70k! Here is why.Bitcoin has finished its corrective pattern (ABC ZigZag) and is ready to go higher. My next target is 70k (69577) because we have a 1:1 FIB extension level at this price. Usually this Fibo level is pretty significant; that's why I am expecting a small crash from it, but after that, we should continue much higher, to the 1.618 FIB extension. Of course, we need more information and data to precisely establish long-term targets.
On the chart, we can see 2 parallel channels, the first is larger than the second. The larger one is still valid as the price is inside it, so we can use this knowledge to our advantage and potentially sell/short Bitcoin at the touch of the upper sloping trendline of the ascending parallel channel. But not now, Bitcoin is bullish, so enjoy the ride!
From the Elliott Wave perspective, I also have to be bullish because I see the dream setup of every Elliott Wave trader. What you want to do is catch the 3rd impulse wave and ride it until the end before the 4th corrective wave occurs. Basically, you want to trade a breakout of the 2nd wave or catch the bottom of the 2nd wave with the Fibonacci retracement tool.
Let me know what you think about my analysis in the comment section, and please hit boost and follow for more ideas. Trading is not hard if you have a good coach! Thank you, and I wish you successful trades.

✈️Bitcoin is Ready to Go Up✈️🏃♂️ Bitcoin is moving near the 🟡 Potential Reversal Zone(PRZ)($61,800-$60,900) 🟡 and 100_SMA(Daily) and Support lines .
🌊According to Elliott's wave theory , Bitcoin is completing corrective waves , most likely a Zigzag(ABC) corrective wave structure.
💡We can consider corrective waves in the form of a pullback to the upper line of the descending channel .
📈According to Classical Technical Analysis , Bitcoin seems to have formed a Falling Wedge pattern . ( Of course, it is not very standard ).
🔔I expect Bitcoin to start rising from the 🟡 PRZ 🟡 and at least rise to the 🔴 Resistance zone($65,650-$64,200) 🔴.
❗️⚠️Note⚠️❗️: An important point you should always remember is capital management and lack of greed.
Bitcoin Analyze ( BTCUSDT ), 1-hour time frame ⏰.
Do not forget to put Stop loss for your positions (For every position you want to open).
Please follow your strategy; this is just my Idea, and I will gladly see your ideas in this post.
Please do not forget the ✅' like '✅ button 🙏😊 & Share it with your friends; thanks, and Trade safe.

EURUSD → How will NFP affect the pair? Down to 1.0600?FX:EURUSD is facing strong support at 1.0600. A rebound and counter-trend correction within the downtrend is forming. Traders are waiting for Friday's NFP
Globally, the currency pair is in a bear market phase. There is a strong struggle for the 1.0700 area, especially ahead of Non Farm Payrolls, which may determine the medium-term outlook. Traders expect the NFP to be lowered to 238K, compared to the previous 303K. On the background of high news volatility, the price may test the liquidity zones above the price before continuing to fall, as the general background for the currency pair is still negative.
Resistance levels: 1.07365, 1.0800, 1.08643
Support levels: 1.0703, 1.0606
Based on the general data there is a probability to see a positive NFP for the dollar, which in general will continue to have a negative impact on the currency pair. But the problem with economic news is still that it is high uncertainty.
Regards R. Linda!

Bullish confliuence on the btc falling wedge & bear flag targetsWe can see here if price action can break above the top trendline of the chartreuse bearflag by next week and then hold that trendline as solidified support, thereby confirming the bullish breakout, that the measured move of the break out would be identical to the measured move of the bullish breakout of the monthly pink falling wedge pattern. This is very encouraging bullish confluence. The wedge being on the monthly time frame is more powerful than the bearflag which is on the weekly timeframe and the wedge has already confirmed a bullish break greatly increasing the likelihood that the bearflag which is a weekly timeframe pattern will also have a bullish breakout. To add to this the flag of the bear flag is a falling channel and those types of channels tend to break bullish far more often than they break bearishly. Bearflags usually only break up instead of down at the end of a downtrend or beginning of an uptrend as well, so if it does break up it is a very good sign that bullish momentum has control. One last thing that increases the probability of a break upward instead of downward is the measured move target for a break down from the bearflag is an impossible low negative number. All this combined I think we should see it break upward, but for the target to identically match the wedge target it is gonna need to break above the channel of the flag by the next 2 weekly candles. If this can happen then we are pretty much guaranteed the bottom is in. *not financial advice*

CHZ will 50x in 2024/2025! Buy now.Technical analysis
CHZ is breaking out of the descending parallel channel after an incredible 1085 days! This is a huge event for this coin, and of course, I am expecting a massive pump in the near future. The pump is starting right now, so I recommend buying this coin right now. From the Elliott Wave perspective, we have completed a WXYXZ correction inside this channel, which is always good to see! This coin can 50x in the upcoming months.
Let me know what you think about my analysis, and please hit boost and follow for more ideas. Trading is not hard if you have a good coach! Thank you, and I wish you successful trades.
What Is Chiliz (CHZ)?
Chiliz is the leading digital currency for sports and entertainment by the eponymous Malta-based FinTech provider. It operates the blockchain-based sports entertainment platform Socios, which enables users to participate in the governance of their favorite sports brands. Multiple fan tokens by Socios.com are an example of that. For sports clubs and associations, fan tokens offer a way of connecting with their fans and unlocking new revenue streams.
For instance, fans can participate and influence club-related decisions through surveys and polls, such as messages the captain should wear on his armband. The company aims to bridge the gap between being an active and a passive fan. Chiliz has developed partnerships with some of the biggest sporting institutions in the world: FC Barcelona, Manchester City, Juventus Turin, and Paris Saint-Germain. It also boasts partnerships with the UFC and gaming organizations. By purchasing CHZ, fans get access to various fan tokens and literally have a stake in their club.
Let me know what you think about my analysis, and please hit boost and follow for more ideas. Trading is not hard if you have a good coach! Thank you, and I wish you successful trades.

OM - this altcoin can 37x this year, here is whyOM looks very bullish. We can see that the previous downtrend ended with a descending parallel channel on the weekly chart. Now the price is finally breaking out! What is important is to always take a look at the volume indicator. Bullish volume is absolutely very high and at record levels, which confirms the breakout. Whales are buying it, and they cannot hide it. From the Elliott Wave perspective, the complex correction WXYXZ is complete, which is another sign of strength. Let me know what you think about my analysis, and please hit boost and follow for more ideas. Trading is not hard if you have a good coach! Thank you, and I wish you successful trades.
MANTRA (OM) is a first of its kind, vertically-integrated and regulatory compliant blockchain ecosystem. The MANTRA OMniverse encompasses the DAO; MANTRA Nodes: a blockchain infrastructure-as-a-service business that includes retail staking, institutional delegation, node management and white-label validator operations; MANTRA Chain: a protocol for regulated assets for the Cosmos ecosystem; and MANTRA Finance: a globally-regulated DeFi platform that brings the speed and transparency of DeFi to the world of traditional finance.

SUPER: 5800% profit in 2024/2025Technical analysis
SUPER is pumping hard; there is no doubt about it, and the trend should continue in the next few weeks and months! I recommend buying SUPER right now for a 50x profit in 2024/2025. We can see that the downtrend has ended with a descending parallel channel, and bullish volume is very high, which is always good to see! From the Elliott Wave perspective, we have completed a triple-three corrective pattern (WXYXZ), and we are in a new impulse wave.
Let me know what you think about my analysis, and please hit boost and follow for more ideas. Trading is not hard if you have a good coach! Thank you, and I wish you successful trades.
"What is the SuperVerse (SUPER)?
The SuperVerse is building and delivering Web3 products that empower crypto natives with next-generation NFT functionality, and onboard Web2 users through immersive blockchain gaming experiences.
The SuperVerse comprises two core verticals: NFT marketplace technology and video games. This wide array of Web3 tools and features is supported and governed by a single protocol and token: SUPER ERC20 (formerly known as SuperFarm).
The SuperVerse harbors two central products: GigaMart, a next-gen NFT marketplace with advanced analytics tools and unique social features, and Impostors, a social-gaming metaverse."
"What makes them unique?
By creating fun and inclusive games that appeal to modern gaming culture, the SuperVerse aims to overcome the current limitations of the Web3 space and take blockchain technology and NFTs mainstream. The SuperVerseDAO is dedicated to creating a user experience that bridges the gap between Web2 users and Web3 natives.
The SuperVerse is enabled by cutting-edge Web3 technology. By adopting and refining the latest Web3 functionality, the SuperVerse aims to be a pioneer in this industry and bring NFT marketplace technology and Web3 gaming to a new level. The use of the latest scaling technologies and ingenious in-house engineering make the SuperVerseDAO a leader in Web3 innovation."
Let me know what you think about my analysis, and please hit boost and follow for more ideas. Trading is not hard if you have a good coach! Thank you, and I wish you successful trades.

GOLD - New all-time-high soon! (Buy now)Gold looks extremely bullish in the short-term and also in the long-term. 5000 USD or 10000 USSD in the next few years is definitely very likely, but right now let's focus on the short-term price action.
We can see that GOLD is in a strong uptrend, and we can use a simple trendline tool to measure its strength. The price respects the blue trendline pretty accurately, and the uptrend is valid as long as this trendline holds. Of course, nothing lasts forever, and to be bearish, we need to wait for more confirmation.
It's always important to do an Elliott Wave technical analysis because markets always move in waves, not in a straight line. This helps us see the full picture of price action. As per my Elliott Wave count, we are in the final wave (5) of a major impulse wave of higher degree. This is something we need to take into consideration when establishing profit targets.
What is the profit target for this final wave (5)? Usually, what you want to do is take the Fibonacci extension tool and target the 0.382 or 0.618 Fibonacci extension. As you can see on my chart, I am expecting this wave to finish on the 0.382 fibo (at 2462), but I am also taking into consideration the next 0.618 fibo (at 2567). If you want to place your limit order as a profit target, place it slightly below these levels.
What will happen after we reach my profit target? I will show you in one of my next analyses, so make sure you follow my account! Let me know what you think about my analysis, and please hit boost and follow for more ideas about GOLD. Trading is not hard if you have a good coach! Thank you, and I wish you successful trades.

GBPUSD → Attempting a trend change. Up to 1.2700?FX:GBPUSD , influenced by a positive fundamental backdrop and the dollar's decline since the opening of the session on Monday, is strengthening above previously broken trend resistance.
GBPUSD is strengthening, the currency pair is in a bearish trend reversal phase. The market and traders are readjusting after the negative NFP for the dollar released last Friday. The currency pair is testing the local high and on the pullback is consolidating above the bearish trend resistance. Confirmation of the trend change will be the consolidation of the price above 1.2634.
Resistance levels: 1.2668, 1.2570
Support levels: 1.2487, 1.2422
Most likely the market will make an attempt to change the trend, at the moment the realization phase is being formed. We are waiting for confirmation of the trend change with the purpose of further strengthening.
Regards R. Linda!

Bitcoin is Ready to ⚔️Attack⚔️ the Resistance zone🎉Hi guys, I hope that you have a great weekend .
💡Bitcoin failed to break the 🟢 Heavy Support zone($61,100-$58,700) 🟢 and 100_SMA(Daily) and created a 🐻 Bear Trap 🐻, one of the reasons for which was the release of the US employment rate .
🏃♂️ Bitcoin currently seems to have succeeded in breaking the upper line of the descending channe l and is moving in the 🔴 Resistance zone($65,650-$64,200) 🔴.
🔔I expect Bitcoin to rise at least to the upper 🔴 Resistance zone($65,650-$64,200) 🔴 and possibly to the 50_SMA(Daily) .
❗️⚠️Note⚠️❗️: An important point you should always remember is capital management and lack of greed.
Bitcoin Analyze ( BTCUSDT ), 1-hour time frame ⏰.
Do not forget to put Stop loss for your positions (For every position you want to open).
Please follow your strategy; this is just my Idea, and I will gladly see your ideas in this post.
Please do not forget the ✅' like '✅ button 🙏😊 & Share it with your friends; thanks, and Trade safe.
