GOLD → Retest of risk zone 2880. A pullback is possibleFX:XAUUSD is breaking the local trend and is testing the panic and risk zone of 2880 as part of the correction. A retest of this area will increase the chances of a trend change
Gold is losing growth due to uncertainty of Trump's tariff plans and economic problems in the US. Contradictory statements from the president are supporting the dollar, while rising bond yields are holding back gold prices.
Markets are waiting for US GDP data: if the figures are lower than forecast (2.3%), gold may rise. Fed speeches are also important, but the key will be Trump's statement, which may change the market sentiment
Technically, locally we have a bearish market structure and in this case we expect the decline to continue after a small correction.
Support levels: 2878, 2888
Resistance levels: 2890, 2907
False breakdown of the above support, after such a strong fall, may form a correction. Initially, the price may head towards 0.5 Fibo, after a small pullback we may test 0.7 Fibo. But then we will have to watch the price reaction.
If the gold will go down, the focus will be on 2880.
If the movement will be difficult and the price will start to test the resistance, then in this case, against the background of high risks, we can return to the growth phase.
Regards R. Linda!
Descending Channel

OPUSDT → There's still a chance for an alt seasonBINANCE:OPUSDT is showing positive momentum relative to what bitcoin has put up this night. The coin is in consolidation and testing trend resistance
The main reason for the lack of an altcoin season is bitcoin's huge dominance of the cryptocurrency market. The fall of BTC (open channel to 75K) and further growth after the formation of an intermediate bottom in the 75-80K zone may reduce the dominance phase, which in general will give a chance to the altcoin market, which is going through bad times.
I like OP in the fact that it is not falling in the wake of the flagship, but stands in consolidation, where we have clear boundaries for strategy formation. Focus on resistance: 1.212.
Resistance levels: 1.212
Support levels: 1.044, 0.983
Thus, a break of the resistance at 1.212 could trigger a rally and an attempt to change the trend.
It may happen after correction to 0.5 fibo, or after formation of pre-breakdown consolidation on H1-H4.
The structure of the setup will be broken if the coin starts to break 1.044-0.983.
Regards R. Linda!

The descending channel on btc is wider than originally thought Now that we have had a bounce from yesterday’s big red candle I was able to find two new parallell trendlines that essentially widened the descending channel price has been consolidating in. We need price to get back above the red line soon however for that is a double top neckline, a double top with a full breakdown target of 70k, so we definitely wanna avoid triggering that breakdown by getting price action back above the red line ASAP. *not financial advice*

BITCOIN → Testing $88K - $90K. False or true breakdown?BINANCE:BTCUSD enters the risk zone and forms a false breakdown of the key support zone. All eyes are on the bulls, whether they can keep their defense on the market or not....
On D1 - W1 price in global consolidation after strong growth. The focus is on 90-91K, a zone that is a strong support for the global trend. A false breakout is forming at the moment.
On the Local timeframe H1 - H4 the price is testing the local channel support, as well as the risk zone 89400.
If the bulls can keep the defense above 89400 - 90K, bitcoin may strengthen. The primary target in this case could be 94K
Support levels: 91280, 89400
Resistance levels: 94800, 99200
Statistically, the strongest dvjeniyas are formed after a false breakdown. But there is another question here, what kind of breakout will be - true or false.
In our case, we need to wait for confirmation, namely, for the price to consolidate above the key zones and levels. Emphasis on 89400, 90000, 91300
Regards R. Linda!

Daily Descendng Channel structure on XRPUSDLots of support here and price action should maintain support near the middle of these series of descending channels. *not financial advice*

GBP/USD - Fair Value Gap (FVG) Short SetupOverview:
A bearish reversal setup based on Fair Value Gaps (FVGs), a concept used in Smart Money trading strategies.
Key Technical Insights:
🔹 Fair Value Gap (FVG) Zones:
The price is approaching an FVG entry zone around 1.2700, which may act as resistance.
A second FVG zone is located around 1.2850 - 1.2900, offering a secondary entry for shorts.
🔹 Bearish Trade Setup:
The plan anticipates a reaction at the first FVG zone, leading to a downside move.
If price continues higher, the second FVG zone provides another opportunity to enter shorts.
🔹 Stop Loss & Target:
Stop Loss: Placed above 1.2928 to protect against invalidation.
Target: 1.2350 - 1.2400, aligning with previous demand zones and imbalance filling.
Trade Plan:
📌 Entry Strategy:
Watch for bearish confirmation (e.g., rejection candles, lower time frame structure shift) at the FVG entry zone.
If price moves beyond the first FVG, consider a second entry at 1.2850 - 1.2900.
📌 Exit Strategy:
Take Profit: At the 1.2350 - 1.2400 target zone for a favorable risk-to-reward trade.
Stop Loss: Above 1.2928 to mitigate risk.
Final Thoughts:
✅ Bearish bias unless price breaks above 1.2928.
✅ Look for rejection at FVG zones for ideal entries.
✅ Potential downside move towards 1.2350 target.
📉 Patience is key—wait for confirmation before entering! 🚀

Bitcoin (BTC/USD) Trade Setup – Potential Long Opportunity ChartChart Overview:
A possible bullish retracement setup. The price has recently experienced a sharp decline, but a recovery is forming, suggesting a potential buying opportunity.
Key Trading Zones:
🔹 Entry Zones:
1st Entry: Around 95,790 USD, where the price is currently consolidating.
2nd Entry: Near 97,150 USD, an intermediate resistance level.
3rd Entry: Close to 97,678 - 98,205 USD, marking a stronger resistance area.
🔹 Stop Loss:
Placed above 99,000 USD to protect against further upside risk.
Trade Plan:
📌 Entry Strategy:
Buyers may step in near the current support zone (~95,790 USD) for a potential upside move.
If the price breaks above the 97,150 USD level, a further rally toward 98,205 USD could occur.
📌 Target Levels:
A possible short-term bullish retracement toward the entry zones (97,150 - 98,205 USD) before deciding further direction.
📌 Stop Loss Strategy:
If price moves above 99,000 USD, it invalidates the short-term bearish scenario.
Market Structure Analysis:
✅ Previous Strong Drop: Indicates sellers' control, but a retracement is expected.
✅ Potential Retracement Levels: Buyers may attempt to push BTC back into the entry zones.
✅ Risk-to-Reward Ratio: The trade setup suggests a favorable risk-reward balance if price follows the expected path.
Final Thoughts:
Watch for confirmation of a bullish retracement before entering.
A break below 95,000 USD could invalidate the setup.
Manage risk properly and adjust stop losses accordingly.
📈 Trade carefully and monitor market conditions! 🚀

BITCOIN → Price is in consolidation, but there are bullish signsBINANCE:BTCUSD broke resistance and gave a 4% momentum, it is not enough yet, but we have triggers and key zones. Price is still in consolidation, but it is likely that spring may be close.
You may ask - why are there two scenarios here? Up↑ and down↓ (before growth) ?
Well, the price is in consolidation and we have no clear assumptions in which direction the price will go. But we have key levels and zones, price behavior relative to them will tell us where the price will go.
So, let's get to the bottom of it!
Fundamentally , there is a small but important nuance: This week Trump said: “I am done with the war against cryptocurrencies”.
Followed by almost $ 1bn dollars flowing into binance. Is someone getting ready for something?)
1) Technically, we have a trigger for further growth: $99000 - $99300 zone. If the bulls hold the price above the previously broken descending line, the price will head to attack the trigger in the medium term. A breakdown and price consolidation above 99K could trigger a rally.
2) But, chances of reaching 90-91K before rising are still high. If the price continues to test 94.8 - 95K and gradually push through this zone, everything will become obvious. In this case we will wait for a retest of 90K and further growth.
Resistance levels: 99200, 102700
Support levels: 94800, 91280, 90К
On the daily and weekly timeframe we can see that the price is forming a strong consolidation after a strong growth. Globally, this is a positive sign for a continuation of growth, but locally, inside the range, set-ups can be both short and long.
Regards R. Linda!

USDJPY → Retest of key resistance before fallingFX:USDJPY breaks the bullish structure of the market. Dolla in the correction phase has a favorable impact on the market. The currency pair is forming a retest of the previously broken trendline after a strong impulse
The yen reached a 10-week high on Thursday, causing the USDJPY pair to fall to 149.5. Investors are looking for safe-haven assets due to increased trade tensions caused by Donald Trump's aggressive tariff policy.
The Japanese currency received additional support due to expectations of an interest rate hike by the Bank of Japan, which will increase its attractiveness for investors
For now, the focus is on the 0.5 fibo resistance zone, 150.95, and previously broken upside support
Support levels: 149.5, 148.64
Resistance levels: 150.95, 151.4
Most likely, before a possible fall, the price will be able to test the previously broken support, and now it is resistance 150.95 - 151.4. False breakdown of the key Fibo zones may provoke further fall.
Regards R. Linda!

Btc consolidating in a descending channel on the 1 day chartIf bitcoin can flip the 1 day 50ma(in orange) back to solid support it should confirm a breakout from this yellow descending channel it has been consolidating in. If it were to do so where I blacked the vertical dotted yellow lne the target would be about 105k or so. *not financial advice*

EURJPY → Consolidation before further declineEURJPY is forming a downtrend. The price is bouncing off the channel resistance and has approached strong support, the breakout of which may trigger further decline
Global EURJPY is in a neutral trend, but locally, due to economic nuances, the euro is weakening against the Japanese yen
There are two key zones on the chart - resistance at 159.112 against which a false breakdown can be formed before the price continues its decline. And support at 158.45 - support of the pre-breakdown consolidation and at the same time a strong level, the break of which will open the way to 156.29.
Resistance levels: 159.11, 160.16, 160.9
Support levels: 156.29
Technically, the situation is weak and hints that in the short term the bears could overcome the key support, which could trigger a bearish momentum
Regards R. Linda!

XAUUSD - Gold H1 analysis and possible move! 2861!Gold is currently forming a symmetrical triangle pattern, indicating potential breakout opportunities. The price is near $2,915, trading between key support and resistance levels.
Key Levels:
🔹 Resistance Zone: $2,940 - $2,950
Price has rejected this level multiple times.
A breakout above this area could trigger a bullish move.
🔹 Support Trendline: $2,880 - $2,900
A key rising trendline providing support.
A break below could lead to a bearish move.
🔹 Major Support Zone: $2,861 - $2,865
If price reaches this level, buyers may step in.
A confirmed break below could accelerate selling pressure.
Potential Scenarios:
📉 Bearish Breakdown (Main Outlook):
1️⃣ Price consolidates within the triangle.
2️⃣ A break below the support trendline signals further downside.
3️⃣ Target: $2,861 - $2,865 support zone.
4️⃣ If this level breaks, expect a deeper drop.
📈 Bullish Breakout Alternative:
If price breaks and holds above $2,940, expect bullish momentum.
Next Target: $2,960 - $2,970.
Trading Plan for Traders:
✅ Wait for a clear breakout before entering trades.
✅ Short below trendline support, targeting $2,861.
✅ Long above $2,940 with confirmation.
✅ Use stop-loss to manage risk effectively.

SOL Retesting the Descending ChannelBINANCE:SOLUSDT drops back to retest the descending channel.
The last two times it touched this level, it held and bounced up.
Let’s see if it can hold again this time—if not, it might drop to $146.
From the last two experience of bouncing back, we might know if it can hold this key support within a week.
🔴 Read my signature & publications for more info you don’t want to miss.
🔥 for more future "guesses" like this!

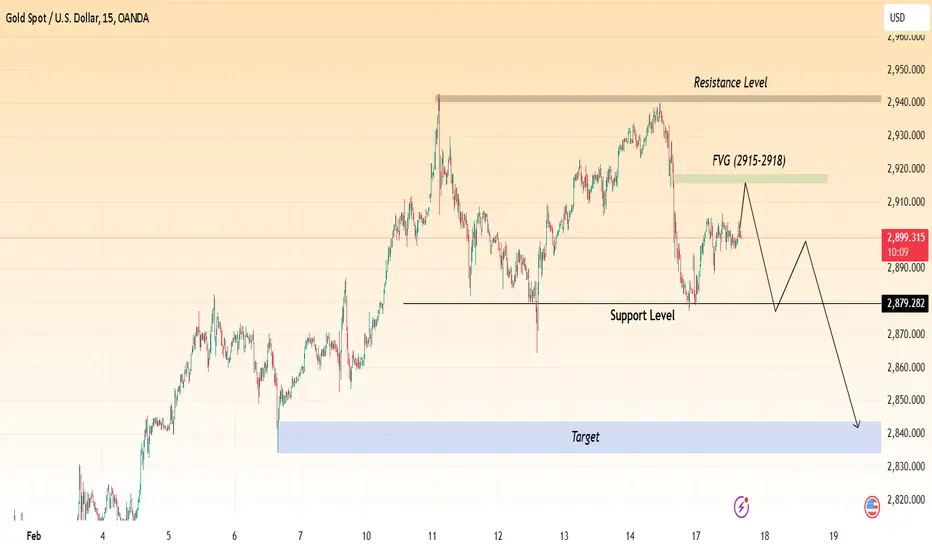
XAUUSD 15-Minute Chart Analysis! 2840!Overview:
Gold is currently trading around $2,900, showing a potential bearish setup based on key technical levels. The chart highlights an important Fair Value Gap (FVG), support and resistance levels, and a possible price movement scenario.
Key Levels:
🔸 Resistance Zone: $2,940 - $2,950
A strong supply zone where price previously reversed.
If price reaches this level, sellers might step in.
🔸 Fair Value Gap (FVG: $2,915 - $2,918)
A price imbalance that could act as a short-term resistance.
If price taps into this zone, it may reject downward.
🔸 Support Level: $2,879
A key horizontal level that has acted as support before.
If price holds here, a bounce is possible.
A break below could trigger further downside movement.
🔸 Target Zone: $2,840 - $2,830
A demand zone where buyers could re-enter.
Projected Price Movement:
📉 Bearish Scenario (Main Outlook):
1️⃣ Price moves into FVG ($2,915 - $2,918) and rejects.
2️⃣ Drops towards support at $2,879 for a retest.
3️⃣ A break below $2,879 confirms further downside.
4️⃣ Targeting the $2,840 - $2,830 zone.
📈 Bullish Invalidations:
If price breaks and holds above $2,920, it could push higher toward $2,940 - $2,950 resistance.
A breakout above $2,950 would shift bias to bullish.
How to Use This on TradingView:
✅ Look for bearish signals (rejection wicks, strong red candles) near FVG before shorting.
✅ Watch for a breakdown below $2,879 to confirm further downside.
✅ If price holds above $2,920, reconsider bearish bias.
USDCHF → Struggle for the 0.900 zone. Trend change?FX:USDCHF earlier broke the uptrend when the fundamental background changed and the dollar went into correction. A set-up appears on the chart, which can strengthen the maneuver
Fundamentally, the situation is complicated because of the tariff war, which was organized by Trump, and European countries are reciprocating. Economic risks are on the rise. In addition, after Trump and Powell's hints about possible rate cuts, the dollar went into correction, which has a favorable impact on forex.
Technically, the 0.9000 level plays an important role as it is quite a strong zone. If the bears are able to keep the price below this mark, in the selling zone, it will be a confirmation of the trend change and the price will be able to head down.
Resistance levels: 0.9000, 0.9045, 0.9065
Support levels: 0.89157
I do not exclude the fact that the price may return to the range and test 0.5 Fibo, but the technical and fundamental background hints at a possible decline. Emphasis on 0.900.
Regards R. Linda!

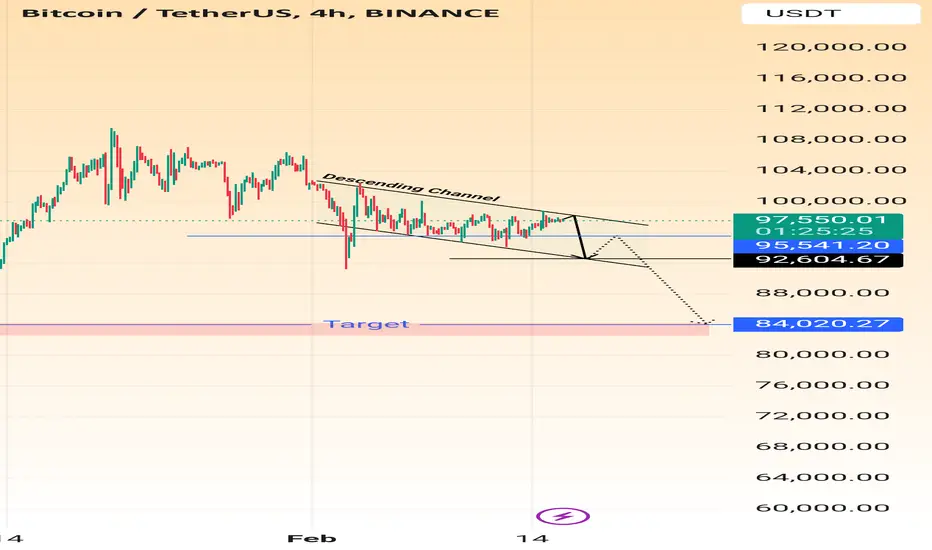
BTCUSDT - H4 Analysis For Next Possible Move!Hello Traders!
As price is moving within a downward-descending channel, which suggests a bearish trend.
The chart labels this pattern as a Descending Channel, which typically signals continued downward movement unless a breakout occurs.
Bitcoin is currently priced at $97,680.
A breakdown from the descending channel, leading to lower price levels.
The target price is set at $84,020.27.
The price is expected to test the lower boundary before breaking further down.
If BTC breaks below $92,604.67, it may trigger further declines toward $84,020.27.
Alternative scenario
May wait for a breakout above the descending channel to confirm a trend reversal.
If BTC breaks upward, a move toward $100,000+ could be considered.
Thanks
Regard: PipsOptimizer
GBPUSD → Attempting a trend change. 1.257 - triggerFX:GBPUSD is trying to take a chance for a trend change amid the dollar correction. The price is testing consolidation resistance for a breakout
On the daily timeframe, the price is consolidating above the previously broken trendline and the attempt to break the resistance is generally indicative of the market sentiment. A dollar correction could favor the pound if the index breaks 107 and heads towards 106-105.
Technically, the focus is on 1.257, a key resistance trigger. A break and price consolidation above this zone could trigger a rally.
Resistance levels: 1.2575, 1. 2718
Support levels: 1.250, 1.2377
I do not exclude the possibility of a retest of 1.250 support in order to accumulate liquidity before further growth. The dollar is likely to continue its correction after Trump's and Powell's comments on rate cuts
Regards R. Linda!

AUDUSD bullish signs visible,- can we see higher bullish?
FX:AUDUSD we having DESCENDING CHANNEL which is breaked, a little above its visible and BULLISH FLAG pattern which is also breaked. Price currently on zone.
Yesterday we are have inauguration day, from which expect having bullish impact here.
SUP zone: 0.61900
RES zone: 0.63800, 0.64300

EURUSD → Pending a breakout of resistanceFX:EURUSD is trying to take a chance amid the dollar correction. The price is forming a retest of consolidation resistance for a breakout and further growth
After an attempt to break the downtrend resistance, the price moves into consolidation and forms a range of 1.053 - 1.021. Inside this set-up a local channel (consolidation) is formed and the price tests the resistance at 1.038. The market is still trying to confirm the change of trend and get stronger on the background of the dollar correction.
The fundamental background is complicated due to the tariff war and economic crisis....
Resistance levels: 1.038, 1.053
Support levels: 1.033, 1.021
A breakthrough of the resistance at 1.038 and price consolidation above this area may trigger further growth within the distribution of the accumulated potential
Regards R. Linda!

Potential 10X - 200X, Don't Miss EOSEOS has been stuck in a 6-year downtrend channel and a 4-year falling wedge.
Volume has been drying up while price kept bleeding for years—most weak hands are likely already shaken out, meaning the supply is highly concentrated now.
📌 Current Setup:
Price has bounced off the wedge and is sitting near the lower boundary of the long-term downtrend channel.
If BINANCE:EOSUSDT closes a daily candle above the high-volume Feb 3rd level, it could signal the start of a major bullish move.
⚠️ No guarantees—always use a stop-loss and trade safely!
But if this setup plays out, COINBASE:EOSUSD could easily see a 10x move and a potential to 200x in this bull run.
🔴 for more future script “guesses” like this! 😉

BITCOIN → Down to $90,000. Downside risks are risingBINANCE:BTCUSD feels the change of mood and continues to form set-ups hinting at a possible continuation of the correction. Another retest of the 90K risk zone is possible.
On the medium-term timeframe bitcoin failed to hold near ATH, in the upper consolidation range and entered the local selling zone, under the level of 99800. A negative note is felt in the cryptocurrency market, as well as a change in sentiment. Altcoins continue to break through bottom after bottom without any positive prospects. Bitcoin at this time is most likely resentful of the US governing apparatus due to the fact that no promises from Trump have been kept so far, and the price is moving into a protracted correction in the local perspective
Briefly, here's what's going on:
Expectations: Bitcoin reserve, cryptocurrency market support, transparent regulation, pumping the market ...
Reality: new scam coins created before the US election that sucked all liquidity, market manipulation, trade war with almost every country on the planet, dumping the market into the abyss.
Support levels: 95.8 (trigger), 91300, 90K
Resistance levels: 100.2, 102.67
Technically, the situation is that bitcoin may continue its decline and test 90K again, from which the risks around 90K will grow.
At the moment, the price is in consolidation between 95.8 - 100.2. A pre-breakdown consolidation is forming near the support, foreshadowing the support breakdown and further fall to 90K. But, due to the dependence of the asset before the actions of politicians in the U.S., the price may shake out to 100.2 before further falling
Regards R. Linda!

PEPE/USD Bullish Breakout: Demand Zone Holds, Reversal in Sight?PEPE/USD has been gaining attention as it trades near a critical juncture. With the daily demand zone holding strong and signs of a downside channel reversal, the pair could be on the brink of a bullish breakout. In this analysis, we’ll break down the technical indicators and patterns that suggest PEPE/USD might be ready to reverse its downtrend.
Daily Demand Zone Holding Firm
One of the most significant factors supporting a potential bullish move is the respected daily demand zone. This area has provided strong support, acting as a floor for buyers to step in. A failure to break below this zone increases the probability of an upward momentum shift.
Key Support Levels: Highlight exact price levels in the demand zone.
Volume Analysis: Look for increased buying volume around these levels, which could signal accumulation by bullish traders.
What to Watch For Before Confirmation
While the technical signs are promising, traders should remain cautious. Key events to watch include:
Breakout Above Resistance: Identify the breakout level for confirmation
Retest of the Channel Top: Look for a retest and bounce as confirmation of strength.
Market Sentiment and Volume: Monitor trading volume and broader market sentiment.
Conclusion: A Bullish Opportunity?
The combination of a respected daily demand zone and a downside channel reversal pattern makes PEPE/USD a pair to watch. A confirmed breakout could set the stage for a bullish run, providing traders with an exciting opportunity. As always, use risk management and stay updated with the latest price action.

GBPUSD → A breakout of trend resistance. Change?FX:GBPUSD is forming a local trend change attempt. The price breaks the resistance of the descending price channel and forms a consolidation above the line, in the buying zone.
The fundamental background is very complicated and not stable because of Trump's policy and the tariff war with the whole world. Sharp shifting statements have a huge impact on the markets.
Technically, the price is breaking the resistance of the long downtrend and we have a chance to change the local trend. A breakout of the resistance at 1.2488 and a price consolidation above this zone may motivate a buyer to support this move.
Resistance levels: 1.2488, 1.26
Support levels: 1.2414, 1.2377
The price may test the previously broken channel resistance before rising further, but the 1.2488 trigger plays an important role. If the bulls can keep the defense above this area, the currency pair may rally a bit in the short term.
Regards R. Linda!
