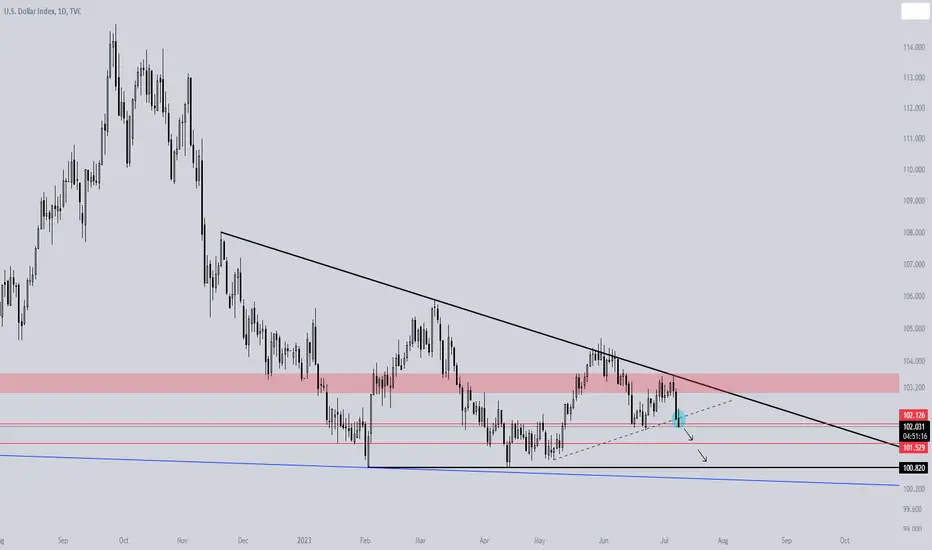
Dollar(DXY) - descending triangle pattern
* 1D
The dollar is drawing a descending triangle pattern.
There is a high probability of going to check the bottom because it hit the upper resistance of the descending triangle for the fourth time and the upward trend line is broken.
Descending Triangle
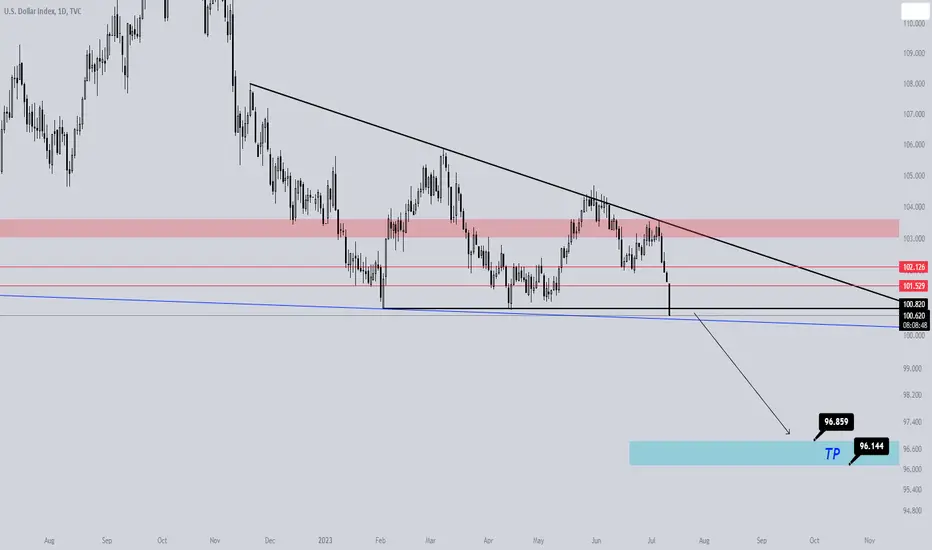
DOLLAR INDEX(DXY) - Descending Triangle Pattern TP
* 1D
The dollar can set a pattern target price by completing a descending triangle pattern.
There is a high probability that the drop will accelerate.
Mid- to Long-Term Target Price is $96.1 - $96.8
If the dollar falls, stocks and cryptocurrencies are likely to continue their upward rally on the contrary.
Let's see
💱EURGBP - A break of support forms a signal EURGBP is breaking the descending triangle support and at the same time forming a retest of the previously broken boundary. Global trend, 0.85220 resistance plays a key role
TA on the high timeframe:
1) A break of flat support defines a new path for price. A channel to 0.84600 is opened
2) Price is in the liquidity zone. The resistance level at 0.85220 may form a sell entry point
TA on the low timeframe:
1) Bears are developing their scenario. After the support breakout, a predictable retest is formed
2) Global trend and local trend coincide. Both are downtrending
3) If the price enters the triangle range, an impulse to the resistance of the figure may be formed, but in the long term I expect a decline from both the triangle resistance and the level 0.85220
Key support📉: 0.84600
Key resistance📈: 0.85220, 0.85550

GOLD → The price is standing still. What's going on? OANDA:XAUUSD continues to stand still and form a consolidation within the 1938 - 1912 sideways range. The rebound to resistance is likely to continue in the format of a bounce to support.
On the daily and weekly chart there is a consolidation in the red zone, after the breakdown of the key support levels. Most likely an energy buildup is forming before the rally in one direction or the other.
In order for the counter-trend correction to be recognized as a trend change, the price has to break the resistance 1935-1939. In this case the market will start to form a strengthening of the price and a bullish trend will start to form.
At the moment within the counter-trend correction you should wait for the decline from the resistance 1933, or the retest to 1920 (1912) with further breakout and decline to the global minimum.
Support levels: 1920, 1212
Resistance levels: 1933, 1935, 1939
I expect a local rise followed by a fall - since that is how the price behaves inside the range. The Fed is still aggressive policy and most likely, the market has decided to rest a bit before the further movement.
Regards R.Linda!

GOLD → Mid-term perspective OANDA:XAUUSD breaks the uptrend. A break of the support of the bullish price channel ends the impulse to 1893 and forms a smooth transition to the state of consolidation in the flat boundaries
On Friday, the price makes a retest of the previously broken support level of 1935. Tandem of technical and candlestick analysis does not give the preconditions for a possible breakout of the resistance in the near future. In the first half of the week the price might again test the 1935-1939 area and make a false-break. The situation looks bearish at the moment, so my main priority is the downside of the price to 1907 with a new attempt to break-through this support.
The moving averages are also pointing at the formation of a global flat. 1954-1870. The strong pressure from the sellers is likely to be still present in the market.
The medium-term outlook points to a possible further decline.
To make a bet on further growth from the technical analysis point of view, the price should break through the resistance area of 1935-1935, and then the momentum to 1960-1981 will be formed.
There are some interesting news in the week ahead. The inflation in the west is still high and in that case the gold has negative fundamentals as the Fed continues to aggressively look at the rates.
Regards R. Linda!

💱EURCHF - A triangle is formed. We wait for a bounceEURCHF continues to decline and forms a pattern. a break in the support of which will form the continuation of the trend.
TA on a high timeframe:
1) A flat is forming. But, the price does not reach the resistance and continues to fall to the support.
2) The retest at 0.97505 might form a breakthrough, which will send the price to 0.97200.
TA on the low timeframe:
1) Within the triangle, the price drops to 0.97375. A retest of the figure support and subsequent pullback is possible. At the moment the price continues to form a pattern
2) Within the figure we may buy from support and sell from resistance.
3) I expect strengthening of the price from the support area till the retest, then from the upper border we will consider short set-ups
Key support📉: 0.97357
Key resistance📈: 0.97660

EURUSD → Fundamental and TA diverge. What's next? FX:EURUSD has been declining all week. The correction continues to the lower boundary of the uptrend, and after a false breakdown of support the market responds with a bullish reaction.
The daily timeframe is turning a triple top, but everything is ambiguous. Price is in a global fleet.
Within a local uptrend, a false break of channel support increases liquidity and the market builds bullish volumes, against the news this reaction may be temporary.
If the wedge resistance is broken, a consolidation above the line can be formed, followed by an impulse towards the key resistance.
The Fed is not going to give up and is increasingly saying that rates will either be kept or increased in the medium term, in which case the currency pair may show us a bearish mood.
Support levels: 1.08485
Resistance levels: the upper boundary of the wedge, 1.0945, 1.1000
I expect an attempt to break through the resistance of the wedge. If it succeeds, the price may head towards 1.0945 within the channel. But if the consolidation in the wedge continues, there will be a chance to break through the trend support.
Regards R. Linda!

Downside for $SOFINASDAQ:SOFI is forming a descending triangle which has a high probability for breaking to the down side.
The measured move is saying -19%
I would wait for the moving averages to get a little tighter before this trade confirms and presents an entry.

GOLD → FOMC meeting forms a bearish candleOANDA:XAUUSD is testing 1933 and after the third retest it forms a false-break. A Triple Top pattern (local value) appears on the chart. The price decreases to the support and forms a local consolidation.
The retest of the 1912 area indicates to us that the market is preparing for a decline. A pullback to 1920 might be the key maneuver. If the price rebounds to 1912 and continues consolidating near the support, it is a good hint that the market is about to break the support and test the new low. But again, as long as the price is in the 1912-1938 range, it might continue rising above the 1920 level. Consolidation could last for quite a long time.
Since at yesterday's FOMC meeting the majority supported holding the previous level or a rate hike, it is a priority to consider selling.
A bearish candlestick is forming on the daily chart after the retest of the resistance area. If the sellers are ready with volumes, the price can quickly test the global low in the medium term.
Resistance levels: 1920, 1930, 1933
Support levels: 1914, 1912, 1909.
The price is squeezed in the 1920-1912 consolidation, the next retest of support may result in a breakout.
Regards to R.Linda!

SOLUSDT → A breakout resistance could give momentum to 25.00BINANCE:SOLUSDT forms the bottom at 9.39. After the formation of the global low, the price forms a prolonged consolidation near resistance and now the phase of realization of the accumulated potential begins. What to expect from the price in the medium term?
Moving averages are showing a strong consolidation. A descending wedge is forming. On the chart I marked the key level of 20.00, which plays a rather important role after the price breaks out of the range. Buyers will have to try hard to hold this area. If the price consolidates above the 20.00 level, the potential for a medium-term long trade to 25.82 will open.
Against the background of bitcoin strengthening SOL continued to consolidate and shows weakness in the market, but while bitcoin stands still we see a bullish reaction from SOL.
Support levels: earlier broken channel boundary, 18.22, 16.00
Resistance levels: 20.00, 22.4
I expect a bullish price reaction to break resistance of the multi-month price channel. A breakout of the level of 20.00 may form a strong momentum towards 25.82
Regards R.Linda!

🥇GOLD - Inside the range price breaks support Gold is testing the resistance area of the global trend and breaking the local support. A rebound from 0.382 could reach the retest area and then the downside phase could activate.
TA on high timeframe:
1) Price is testing the liquidity area of the global downtrend channel
2) The liquidity zone 1939-1935 is not reached, most likely a market maker trap may follow
TA on the low timeframe:
1) A breakout of uptrend channel support forms
2) The price tests 0.382 Fibo and starts to form a pullback. There is a chance of the retest of the channel support or the level of 1932.
3) The price may also strengthen to 0.618 Fibo before declining further
4) The global TA says about the priority of further falling.
5) I think the local correction will end soon
6) The price may stay in the 1932-1910 range all week
Key resistance📈: 1932, 1939.
Key support📉: 1921, 1910

GOLD → Is further decline possible? What is going on?OANDA:XAUUSD is in a correction phase. The global trend on the chart is bearish. There are several preconditions for a possible further fall. What is going on and what to expect from the price?
We see a breakout of the global price channel and the formation of an upward correction. I drew a local support line to make the situation clear. Price breaks support after a strong resistance area appears on the chart. The bears increase volumes and start to pressure the market.
On the daily timeframe we see an attempt to break the uptrend. The price forms a correction to the resistance area. The correction may confirm the market's intentions, after which the price will start to fall, but for that we need confirmations. That might be a breakout of supports 1920 and 1912, in which case the price will head towards 1893, which will be a retest of support - a signal for a further breakout.
Support levels: 1920, 1912
Resistance levels: 1926, previously broken support, 1933
I expect a retest of 1920 with a possible breakout as the bears increase their activity. A retest of 1912 will form a breakout attempt, which could also be successful. I wait for the decrease.
Regards R. Linda!

C98USDT → Realization of accumulated potential BINANCE:C98USDT enters the phase of realization of the accumulated potential. A prolonged trend may change its direction, but in order to do that the bulls will have to take the priority in their hands.
Global and local wedge are marked on the chart. The resistance boundaries of the figures coincide and the price breaks the area, consolidation is formed in the green zone and C98 starts to form a bullish momentum.
For the buyers, the resistance at 0.1751 is important at the moment. If the price breaks through and fixes above this area, the cryptocurrency pair can form a bullish momentum. Resistance at 0.3258 will be the priority target in this case.
Lately bitcoin is strengthening and forming consolidation of 30000-31000. A breakout of resistance will also give momentum to altcoins.
Support levels: MA-50, 0.1540, 1.1209
Resistance levels: 0.1751
I expect the retest to 0.1751, which might end up with a breakout of resistance and in this case the price will continue growing. I am interested in the target of 0.3258 and 0.5750.
Regards R.Linda!

🥇GOLD - Breakthrough Wedge. Price could strengthen Gold breaks the wedge resistance and forms momentum to retest 0.382 Fibo. Buyers are able to strengthen the price from 1910 to 1932, it all depends on whether the price can form a consolidation above the support.
TA on the high timeframe:
1) A bounce from 1893 is forming. In terms of technical analysis the price makes a test of 1938. On the background of a bearish trend, the price can bounce from 1938.
2) The liquidity area, which may be of interest to the whales, is around 1938.
3) Before a further decline, a correction could lead price to strong resistance
TA on the low timeframe:
1) Retest of 1910 support (Fibo 0.236) will show further price direction.
1.1) Consolidation above 1910 will form an entry point to buy
1.2) Breakout and consolidation of the price below the level (within the wedge) will form an entry point to sell)
2) The bulls are trying to take control of the situation.
3) An attempt to change the local trend is formed on the chart. This situation may lead to an increase to 1932
Key support📉: 1910
Key resistance📈: 1921

GOLD → Breaking the trend on Friday, BUT...OANDA:XAUUSD market is still bearish. Breaking through the resistance of the descending channel may not play a key role. The price is in a global wedge and we see a bounce forming from support.
On Friday, we saw a strong rally that many did not expect. The price was bullish on the inflation related news. Looking at the technical picture some things might become clear.
Pay attention to the D1 chart below. A global wedge is forming. At the moment the market is still in a consolidation phase in a downtrend format.
The retest of the wedge resistance is forming. At the moment, there are no prerequisites for the price to break the resistance of the wedge in the area of 1935-1939.
Breaking through this area will form a strong momentum that will start to strengthen the price.
At the moment there is a high probability of price fall from resistance. Consolidation may continue.
The Fed is not going to cut rates, therefore, the strengthening of the dollar after a small correction may continue, and gold may fall in the medium term.
Support levels: 1912
Resistance levels: 1920, 1938
I expect a correction to the support and possible strengthening of the price to the resistance. If the price breaks through 1912, it will head towards the area of 1902.
Regards to R.Linda!

What are Cumulus Triangles? 😱 Check out this new development!"Cumulus Triangles" are new Bitcoin chart patterns developed exclusively by The Crypto Weather Channel to help identify the trading range of bitcoin between the start of the first Bull market and the Halving. Have no idea where Bitcoin is going next? We've got you covered, all the way up until the Halving event! Thanks for watching.

GOLD - Negative fundamentals are bad for the price OANDA:XAUUSD forms a new local low and then makes a retest. The bearish scenario continues, which tells us that gold will continue to red, unless, of course, the fundamental backdrop takes the opposite direction.
The phase of realization of the accumulated potential is forming.
When the support of the 1939 range is broken, there is a new downtrend in a channel format. On the chart we see the downtrend range, the price clearly observes the limits and on Wednesday it forms a new local low of 1902. On Thursday we see the return of the price to the retest of the support. Hence, there is a possibility of a breakout of 1902 and further declines.
Either the bears are strong or the fundamental background is influencing the bulls.
The moving averages are showing a strong downtrend.
Support levels: 1902, 1895
Resistance levels: 1912, channel resistance, 1928, SMA200
Since the chart gives us plenty of bearish suggestion, I will continue to hold the view that price will continue to fall. Pay attention to D1, price is only in the middle of the range, the target could be support 1800
Regards, R. Linda!

GBPUSD - (SHORT) DESCENDING TRIANGLE!good evening/morning traders. A key level has been broken and with the descending triangle as a guide I have done a measurement of the possible top to bottom ratio with S/R levels and using a path guide to show everyone how we could potentially see this play out. I have set out targets and SL will be placed accordingly, with the significant strength of the GBP over the USD we could possibly see more potential downfall. please share your thoughts on this?

MGL-LONG DAILY TIMEFRAME NSE:MGL
Stock is consolidating in Descending triangle pattern from past few days.
It is taking support on previous Break out level which is 1015-1020.
On 22nd June we can see a clear rejection from top. Following to the rejection there is a big red candle which is closed near support levels. Now here comes the interesting part the red candle did not got the follow through.
The stock has opened slight gap down on Monday (27th June) and it has been sharply pushed up by buyers. This is a good opportunity to go long and with low SL (approx. 2%)
Please wait for the bullish price action if it opens gap down on Tuesday (28th June)
SL: 1010 Target: 1070
The entry is bit early as I mentioned that previously red candle did not got the follow through.
This is only for educational purpose, please manage your risk accordingly.

A Downfall?Another classical descending triangle pattern formation observed in Fin Nifty today. Will it break down further or break out from the contraction? Let's see who drives it up - the Bears or the Bulls?

GBP/USD Descending Triangle FormationPrice found strong resistance at 1.28500 level and we can see descending triangle formation. Price broke our support zone and I will look for the opportunities to sell. Its possible to see a retest of this broken support zone soon.

BITCOIN MAKES CLASSIC DEAD CAT BOUNCEAs you can see in the chart, this is a very simple setup:
When we look at the big picture, we have a dead cat bounce breakout retest pattern.
As confirmation, we have a clear RSI bearish divergence and a descending triangle, which can be a good entry point.
As targets we have the clear support levels and we set an stop loss at the last swing high, so in case the price goes against the position, we protect our capital.
Sticking to ideas when proved wrong can be a very expensive mistake. Always be ready to change your mind.

The dollar(DXY) will go down further.
1D - Descending Triangle pattern seems to be in progress.
Below, there are 3 support levels : $102.270, $101.611 and $100.820.
