DGB


Digibyte is above the rim of its picture perfect cup & handledgb has formed a picture perfect cup and handle and has broken above the rim/neckline...if it closes the current 4hr candle above the neckline then I think it's ready for blast off. Also take a look at the volume boost on it on the last 4 hour candle...explosive.


DGBUSD , DigiByte would probably begin a new uptrend !!DIGIBYTE/DOLLAR
Technical analysis:
DigiByte/Dollar is in a range bound and Beginning of up trend is expected.
The price is below the 21-Day WEMA which acts as a dynamic resistance.
The RSI is at 39.
Trading suggestion:
*The price is in a range bound, but we forecast the uptrend would begin.
*Price is in the Buy Zone (0.023 to 0.011), we would set orders based on Price Action and expect to reach short-term targets.
Beginning of entry zone (0.023)
Ending of entry zone (0.011)
Entry signal:
Signal to enter the market occurs when the price comes to "Buy zone" then forms one of the reversal patterns, whether "Hammer" or "Trough" , in other words,
NO entry signal when the price comes to the zone BUT after any of reversal patterns is formed in the zone.
To learn more about "Entry signal" and special version of our "Price Action" strategy FOLLOW our lessons:
Take Profits:
TP1= @ 0.031
TP2= @ 0.037
TP3= @ 0.049
TP4= @ 0.068
TP5= @ 0.089
TP6= @ 0.109
TP7= @ 0.136
TP8= Free

We will soon see an opportunity to buy in DGBUSD . Be ready!Technical analysis:
DIGIBYTE/DOLLAR is in a downtrend and Beginning of up trend is expected.
The price is below the 21-Day WEMA which acts as a dynamic resistance.
The RSI is at 37.
Trading suggestion:
.The price is still in a downtrend in the market, but we forecast the uptrend would begin.
.There is possibility of temporary retracement to suggested support zone (0.023 to 0.008), if so, traders can set orders based on
Price Action and expect to reach short-term targets.
. Beginning of entry zone (0.023)
. Ending of entry zone (0.008)
Entry signal:
Signal to enter the market occurs when the price comes to "Buy zone" then forms one of the reversal patterns, whether "Hammer" or "Trough" , in other words,
NO entry signal when the price comes to the zone BUT after any of reversal patterns is formed in the zone.
To learn more about "Entry signal" and special version of our "Price Action" strategy FOLLOW our lessons:
(We have started to prepare these lessons in TradingView. If you want us to continue, give us feedbacks!)
Take Profits:
TP1= @ 0.037
TP2= @ 0.049
TP3= @ 0.068
TP4= @ 0.085
TP5= @ 0.109
TP6= @ 0.136
TP7= Free

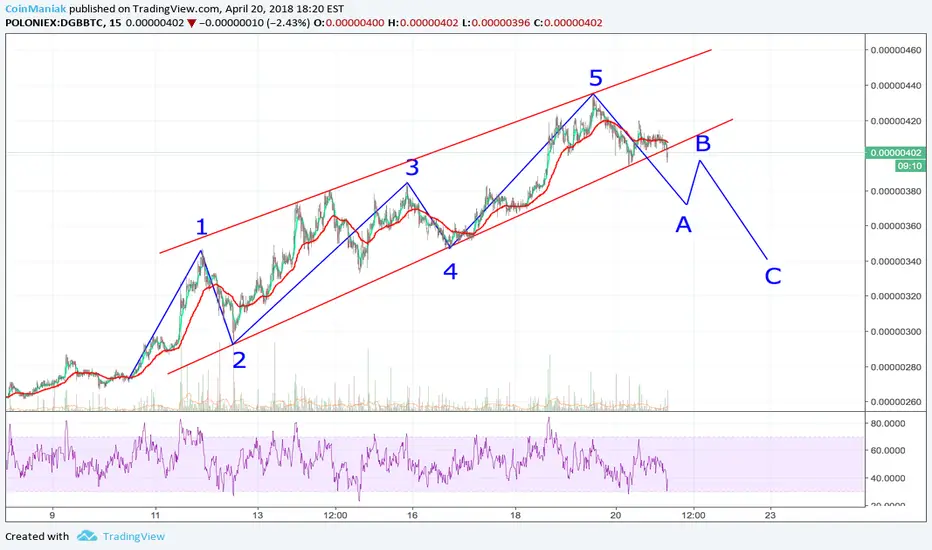
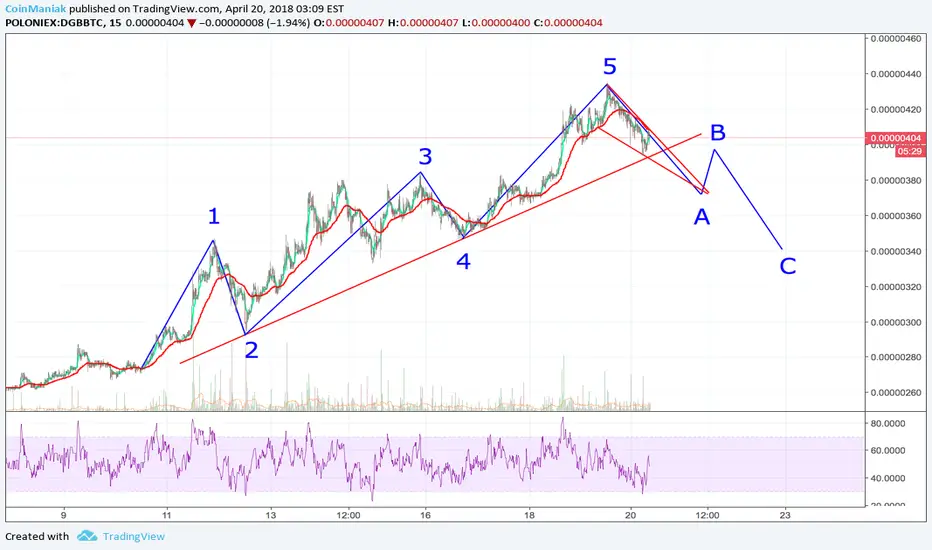
Digibyte | DGBBTC CorrectionExpecting a correction to 350 - 360 sats.
After this we go to 580 sats, if bitcoin can stay above downtrend line.
Please always DYOR !


DGB LONG PredestinationYou will find many altcoins with this pattern in the 7 day chart, many are already in point to start a new market.


DGB/BTC - Realistic Road Map Until EOYI'm seeing a lot of TA's right now that call for exuberant highs and unrealistic lows. It's sort of bothering me so I want to post this as a reminder for others to be mindful of not getting too wrapped up in the hype or FUD. You can have conservative markers (both long or short) and still make a ton of money in this space. So, with that being said, let's rid ourselves of "observational only" or emotional outlooks and take a closer look at what could realistically happen. After all, the purpose of TA is to help weigh out the probabilities in real time for the most likely outcome so we can plan trades accordingly and find good entries and exits as well as prevent any panic or greed. This is something that I am still reminding myself of daily and want to encourage other traders out there to keep a healthy perspective so you can make wise moves in this volatile market.
The way I am seeing things currently:
We found our bottom at 80ish sats and started the first Elliot wave up. The Bitcoin correction fast tracked wave 2 down and we came to test 220ish sats. We then bounced from there out of a falling wedge for a little sideways action and bounced again to create a new higher low and establish a legitimate trend line with 3 solid points to use as a guide.
Now, consider major resistances. Look back at the first cycle and then look at the ATH of wave 1 of this current cycle and compare the two. There is strong resistance at 830 sats. If Bitcoin truly has found a bottom here, then I do expect alts to recover significantly alongside BTC, with DGB being one of the major benefactors and I believe FOMO will help drive the price beyond that resistance to roughly 970 sats, slightly before a 1000 sats where whales will begin to dump. I believe this will coincide with another summer correction for Bitcoin as well as alts and DGB will start the corrective 4 Elliot wave.
During late summer/early fall people will probably claim crypto is dead, that the spring/early summer run up was a bull trap, and that Bitcoin is going back to the basement. "See, I told you! Bitcoin is going back to 3k, maybe lower!" they will say. I'd say don't believe them. Although it is a possibility , it does not have a high probability .
Once the summer correction finally passes, the fall/winter will begin the real yearly movement for Bitcoin and alts, where everyone who held strong and believed in crypto will be rewarded with major gains. Now is just the time to be patient. If you are relying solely on other peoples TA's to make trades, my advice is to hold through the summer until the end of the year and then sell into the extended 5th wave while everything is going parabolic.
That's the way I see it. Of course, this could change at a drop of the hat, but I think it is important to keep a level head each day and reassess as you move forward. Good luck to everyone!


Just throwing this out here :oBroke out of a long downward trend line with significant results. Wow! Go DGB!

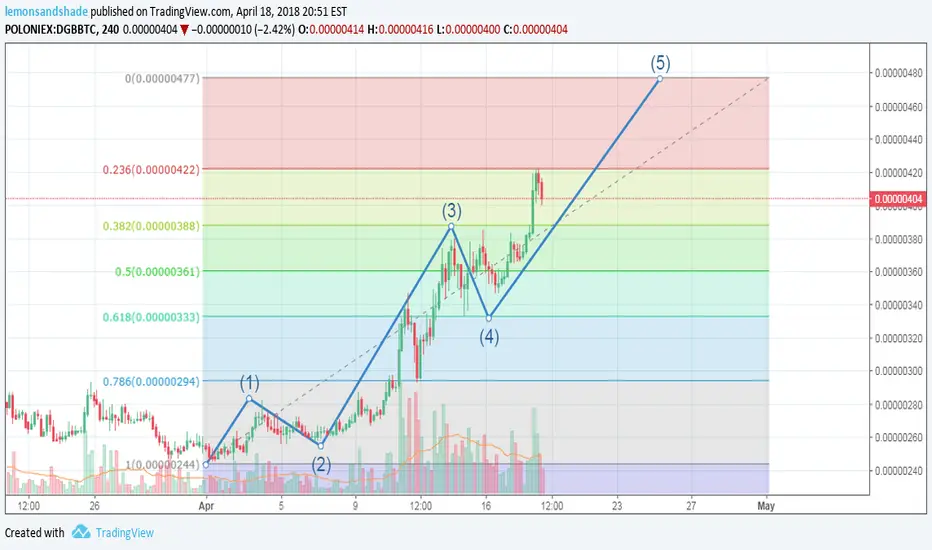
Digibyte - 4hour chart shows one more jump then minor correctionDigibyte is showing good volume and with the elliott wave count I have I think we have a little left to go in the 5th wave for 4 hour chart. Expecting a minor correction after target is hit then even a bigger blast off.
Digibyte Daily Analysis
Now I ain't crazy.... and I ain't a psychic... But I drew this yellow line yesterday as a potential first level of resistance if the DGB price did finally break through the 200 day moving average. And it looks like that's exactly where the price stopped today. All in all, Digibyte had a great day though. Busting above with pretty decent volume accompanying the move is an impressive showing the for the little guy.
We're overbought on the RSI and DGB needs to settle down and hopefully build a little base.
We have some possible support around the 3.1 cent level.
The 4 hour chart looks great. The two long wicks in either direction is a pretty good sign. Hopefully we can stay range bound up here for a while.
We might into a few "mini bosses" at this trend line dating back to December 2017. If we do then the price should advance to the
Niceeeeee! Let's get there and deal with it when the time comes.
So, I'm still a Bitcoin Maximalist but DGB is looking pretty good here. Let's see what happens! Worth a trade? You decide.

Is DGB forming a new rising wedge?The purple lines are from my last TA on DGB. No changes made there. Green lines are adjusted for the penetration through the lower support of purple wedge which seems to have formed a newer pattern, starting from the bottom of the lower thick green line. This will be a longer wait if it stays in those green lines for a break out, less volatility, but now we're in the bottom of this newly formed wedge so lots of overhead room for a healthy bounce. Watching for breaks outside of either green line. Weekly MACD is picking up momentum (red aarow) so there's that going.
Now that DGB is available to be bought on Abra's cool app, I suspect that will increase interest in DGB, therefore more green in the charts.

My thoughts on digibyte future, wave 2 then 3 and we are off. My thoughts only. Not financial advice.

Looking goodStratis looking to breakout on the daily.
Volume could pick up a little bit, but i think fomo will begin soon.
Macd heading into the bullish zone
Willy has passed the -50 line into the bullish zone.
What i see happening with Strat is a nice break out then a test of support (former resistance) for the next leg up. With nice fundamentals still to be released i see a nice upside in the coming months.
Don't forget to hit the like button or follow me on Trading View for more chart analysis :)
