DGB FlagFlag pattern obviously. This can be triangle or channel but definitely a flag pattern and its long!
DGB

🆓DigiByte (DGB) Nov-3 #DGB $DGBDGB is very strong and in the near future it can strongly rise to the $0.065, $0.08 and $0.1 zones. We can accumulate DGB at $0.055 and $0.05 zone. But if it falls out of the $0.50 zone, it will fall sharply to the $0.04 zone
📈RED PLAN
♻️Condition : If 1-Day closes ABOVE 0.05$ zone
🔴Buy : 0.055 - 0.05
🔴Sell : 0.065 - 0.08 - 0.1
📉BLUE PLAN
♻️Condition : If 1-Day closes BELOW 0.05$ zone
🔵Sell : 0.05
🔵Buy : 0.04
❓Details
🚫Stoploss for Long : 10%
🚫Stoploss for Short : 5%
📈Red Arrow : Main Direction as RED PLAN
📉Blue Arrow : Back-Up Direction as BLUE PLAN
🟩Green zone : Support zone as BUY section
🟥Red zone : Resistance zone as SELL section

DGB keep watchguahegiusehgiuerhgiuerger
gregrileugjeriulgjer
gsergiluerhgru hello
doing this because TV makes me.

dgb/usdTesting/tracking elliot wave theory. Please do not trade off idea without S/L. Not financial advice.
Updated chart to the daily from the 4h, still waiting on targets to reach

DigiByte About To Make A Strong Move!It is no joke when I say that "Patience is the key".
Here we have DigiByte (DGBBTC) consolidating at a low and getting ready to boom at any given time.
It can take a few days, weeks, and sometimes even months in a consolidation phase.
But not this time around though, it is likely to move up right away.
We are patient of course, that's how we trade.
We buy, hold and let the market take care of the rest.
Calmed and relaxed.
There is nothing to lose if you wait.
If prices go below your buy-in you simply hold.
If a new low is hit you simply hold.
You can only consider selling when you are ahead.
This is very simple, very easy and you can win no matter what the charts, experts, analysts or anybody says.
Here is a good one for you, DGBBTC...
Try this strategy and see what results you will get.
Set your waiting time to 8-12 months to start.
This is not financial advice.
Namaste.

Still anticipating one more move to the downside on $BTCI KNOW NOTHING. DO NOT TRADE ON MY PROJECTIONS. NOT FINACIAL ADVICE.
'Patience is a virtue' Is a horrible understatement in the Crypto world. It may be the most important attribute in this space. Right now I am patiently anticipating one more move down for #BTC
#altcoins will be available for great discounts if we see BTC come down another level.

DGB +900%Loading up on this bad boy, as dead as it looks it about to pay for my house. Not finical advice but I'm preparing to start taking profits around 0.75.

DGB [DigiByte]* Please share your opinion in the comments.
* This is just an idea, Not financial advice.

Digibyte (DGB) - Structure and TargetsTaking a closer look at the Digibyte chart in the daily timeframe and adjusting slightly for BTC Hashrate slowdown due to the exodus of Chinese miners, and the Fractal is even more strongly correlated.
What do you think? Do you have any targets for DGB?
looky looky where Digibyte is catching support!Digibyte is showing a lot of respect to the 05.8 cent to 06 cent area and in my opinion is very bullish going forward for the next couple months. Targets to come as we move forward, let's make new highs first.
Look at the historical resistance this area has played in the past and now has conquered it and flipped it to support.
Your patience & diligence will be rewarded.

The time has come or DGBAfter the btc movement it s time to release DGB. I am gonna hodl it until december.

Digibyte - Current PostureA review of the posture of Digibyte, following the completion of three corrections, printing three successively higher-lows.
In terms of Elliott Wave analysis, there are two interpretations:
DGB has now completed a Wave 4 and commenced a Wave 5; or
DGB has completed a Wave 2 and just commenced a Wave 3.
Either case is bullish and is well supported by the MACD crossing bullish and the RSI sitting comfortably in neutral territory. Looking at the the Fibonacci projection of the correction on this standard scale chart and two targets present themselves:
$0.278 at the 1.618 resistance line
$0.336 at the 2.0 resistance line
Of course there are higher levels, but they will become exponentially less likely the longer DGB remains under $0.185.
What do you think? How high can DGB rally to complete this next impulse wave higher?


DGB/USDT SELL SIGNALThe market has been tricky the last couple of weeks, providing a relatively wide range trading for most cryptocurrency pairs. However, sooner rather than later the range trading will be over. The DGB price action is much weaker than most coins, thus it can be dumped further during the next week.

🆓DigiByte (DGB) Sep-19 #DGB $DGBThe selling pressure on DGB is weakening so in next days DGB could recover to 0.065$ zone or even pump strongly to 0.08$ and 0.1$ zone. So in this period, we will keep accumulating DGB at 2 support zones : 0.05$ and 0.055$ zones. But if it loses 0.05$ zone it will fall down to 0.04$ zone
📈BUY
🔴Buy : 0.0538-0.0562$
🔴Buy : 0.0488-0.0512$. SL if B
🔴Buy : 0.0635-0.0665$ if A. SL if B
📉SELL
🔴Sell : 0.0635-0.0665$. SL if B
🔴Sell : 0.078-0.082$. SL if B
🔴Sell : 0.0975-0.1025$. SL if B
♻️BACK-UP
🔵Sell : 0.0488-0.0512$ if B. SL if A
🔵Buy : 0.039-0.041$. SL if B
❓Details
📈Red Arrow : Main Direction as BUY and SELL section
📉Blue Arrow : Back-Up Direction as BACK-UP section
🟩Green zone : Support zone as BUY section
🟥Red zone : Resistance zone as SELL section
🅰️A : The Close price of 1-day candlestick is Above the zone
🅱️B : The Close price of 1-day candlestick is Below the zone

DGB below resistance#DGBUSDT
$DGB rejected from resistance zone, and it is trading below descending resistance, also it is still above a support zone that is between 0.618 and 0.786 fib of last swing high.
#DGB price needs to break out from descending resistance zone to start a new rally.
if price going to make a AB=CD pattern, the long term target can be $0.2, which is 250% increase from here.

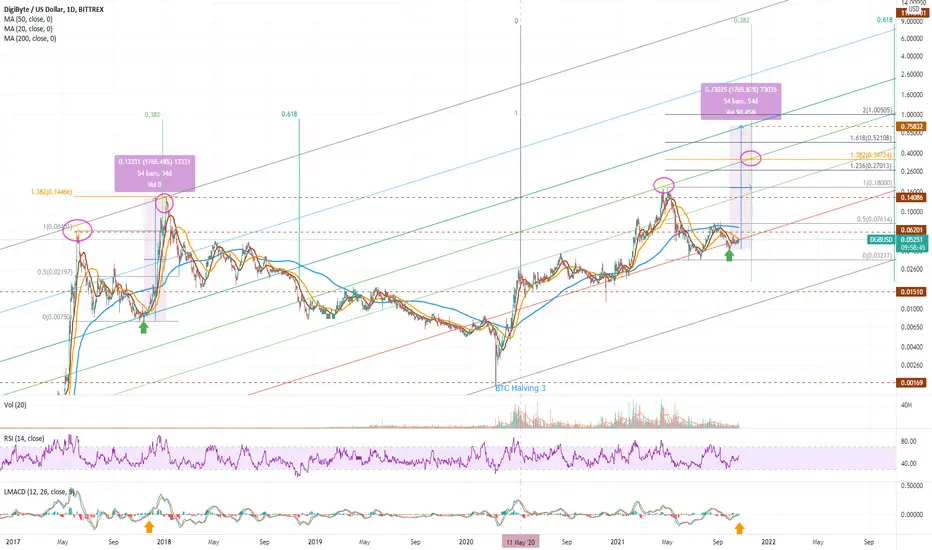
$DGB $13.33 TOPthree wave 5 targets equal to wave 1 or 3 exceeding channel to 1.382, 1.5, or 1.618 fibonnacci
you can only get there on a rainbow ;)
not financial advice

Hold the DGBThat is just my opinion. I think after the other altcoins run ended it will be the time for DGB

DGB COULD POP 625% $.40 INCOMINGI think people need to pay attention to #DGB. In early 2017, $DGB had a spike, and then at the end of 2017 DGB popped 120% from the previous high earlier in the year. If DGB repeats this same pattern, we could easily be looking at a 625% increase from here on the second run up.
And that is without being listed on Coinbase, or any new partnerships or project announcements.
THIS IS NOT FINANCIAL ADVICE. PLEASE DO YOUR OWN RESEARCH.

DGB is Ready!Tested the parabolic trend line 4 times already. Strong support and its ready to enter in price discovery
I hope you found the idea interesting:)

DGB broke out strong resistance#DGBUSDT
$DGB broke out from strong resistance zone, and today is going to confirm it as support, good price to buy.
in my opinion #DGB will have increase at least 30% to touch $0.102
if price continue its uptrend and break out another resistance zone and close above $0.13, I think price can easily reach $0.2 (which is 160% from here)

Dgb cup and handle perfectionGo for high dgb! There is a perfect cup and handle pattern. This is kust the beginning

$DGB DGB Bowl formation Dgb also has dish formation. It can go up at any time. Not investment advice
