DGBUSD , Suitable to keep, UPDATE.Hello my friends. The price had a great breakout, so after pullback is so nice to buy for new buyers. Keep it for new targets. Good luck.
If you like the idea, do not forget to support with a like and follow me for next analysis :)
Write your comment and opinion below for me
DGBUSDT

DGB has not exploded yet. Buy DigiByte and wait for pump!🚀DGB has not exploded yet, if you are searching for coin which didn`t jump yet it may be good option for you. In USDT chart look very bullish but in BTC pair we are still at the bottom. We believe that DGB will give us huge profit during this bullrun. Buy and wait for pump!
🚀 This coin is on our golden long-term altcoins list. It may be very good project for long term investment.
❎ No TP for long-term investments. We can`t predict exact altcoins targets in long term, but thanks to our experience and glassnode we are able to predict exact bitcoin targets. Our long-term strategy is just to hold these altcoins until glassnode indicators will say us that we are close to end of bullrun. And then we will sell everything in 15% parts.
✅ Bullrun is easy. Just accumulate coins from our golden list (long) and play with our signals (short). Diversification is the key to success.

DGBUSDT POSITIVE
A positive pattern has been formed on the #dgb The market maker wants to raise the price of the currency's targets (0.1 0.15 0.19 0.23 0.27)


DGBUSDT Breakout Confirmed!! DGBUSDT (Day CHART) Technical Analysis Update
Resistance Breakout in day chart
DGB/USDT currently trading at $0.093
Buy-level: $0.090 -$0.094
Stop loss: Below $0.075
Target 1: $0.110
Target 2: $0.125
Target 3: $0.135
Target 4: $0.150
Max Leverage: 2X
ALWAYS KEEP STOP LOSS...
Follow Our Tradingview Account for More Technical Analysis Updates, | Like, Share and Comment Your thoughts.


DGBUSDT Bullish BreakoutI can see a Bullish Breakout opportunity. We should try to enter a Long position if it breaks out the resistance level, if not then we will take long position on next dynamic support level when it pulls back.

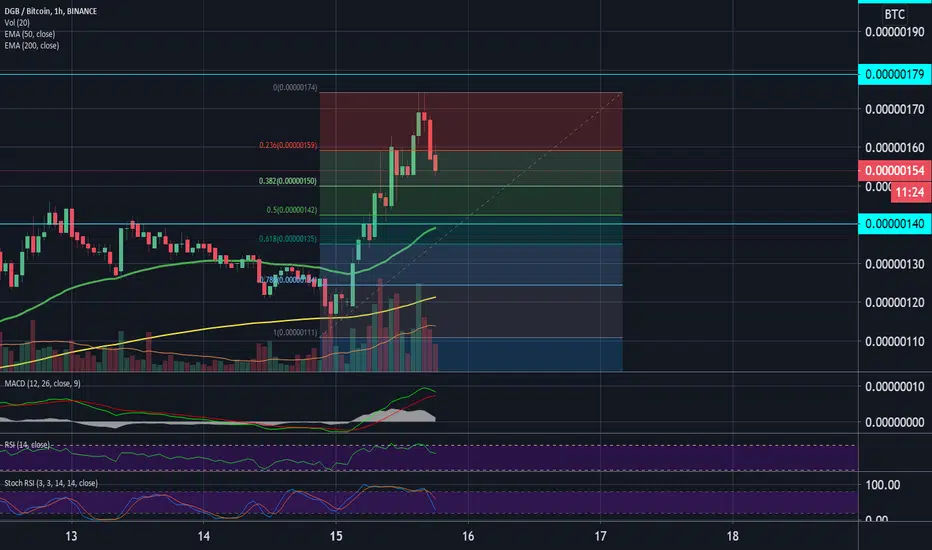
DGB Prepair New ATH DGB Price now breaking support at 61.8%
Price potentially will go down to 50%
Just buy cheap at yellow area before we go to the moon
Our target at 161.8%

cup and handle + triangle patternDGB is making cup and handle + triangle pattern
BITTREX:DGBUSD
BINANCE:DGBUSD
BINANCE:DGBUSDT

DGB chart looks really good. This is a daily time frame, looks good. we can see a cup and handle pattern and also a bounce from the bullish trend line.


DGB will follow BTC DGB is really cheap and can go really high in this bull run.
We have discussed this in our today's video.

DGBUSD | Bullish trend continues.After the correction, the $DGB continues its bullish movement. The support lines seem to be reasonably reliable. So we can expect the next rising move with the aim to surpass the previous historical high.
Long-term target $0.12-0.135 or even higher.

DigiByte (DGB) Bull signalDigiByte has retraced to the golden pocket (0.618-0.65 fib level) and is now consolidating at the 0.5 fib level between the 100 and 200 EMA.
As soon as DGB flips the 100EMA to support the bull run will resume.
Now is the time to load your bags. Keep stops in place in case Bitcoin dumps and takes the market with it.

Sideway accumulation zoneSideway accumulation is being done;
MACD is going to neutral (confirming accumulation zone/ healthy correction);
Stoch RSI is ready to go;
RSI is holding 22 days above 50;
Digibyte is holding 22 days above EMA 50;
The chart remains bullish.
I'm seeing 2 scenarios:
1) Accumulation for 2~4 days + uptrend breakout or
2) Another bear trap touching EMA 50 and skyrocketing fast (14 Feb scenario).
Target: U$0,10

DGB/USD - Path Back To ATHWe are currently riding a subset wave 3 of a larger set wave 3. Minimum target is the 3.618 fib extension of the larger sets wave 1 movement putting us at previous ATH of .14.


Healthy CorrectionIt's time to healthy correction (bullish continuation pattern).
BUY ZONE:
I expect a good support at 150 sats (0.382 fibo), before trend continue the long run (first entry).
But, we could see 140~150sats range (second entry).
Don't miss the Digibyte long run!
Panic sell timeThis is why I'll HOLD Digibyte.
Pullbacks are being much smaller than leg ups, which means only a small correction (continuation pattern).
Smart guys will gain money, buying the dip.
The alt season has not finished.
Long term players will win the battle.

