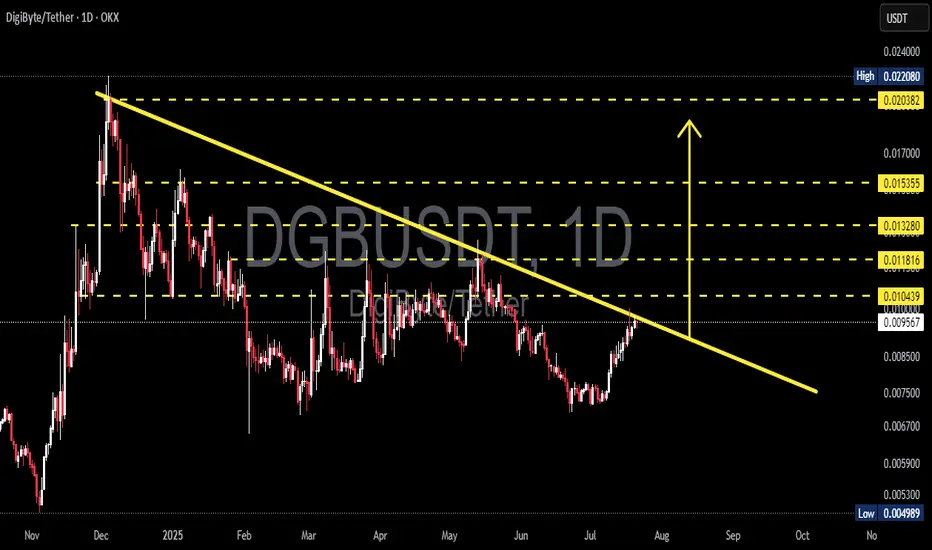
DGBUSDT Ready to Explode? Major Breakout from 7-Month Downtrend📉 Pattern: Falling Wedge / Descending Triangle Breakout
DigiByte (DGB) is currently showing a high-probability breakout from a descending trendline that has held price action in check since December 2024. This structure hints at weakening selling pressure while buyers have started forming higher lows, suggesting potential momentum shift.
🔍 Chart Structure & Key Technicals:
Descending Trendline Resistance (yellow line): Tested multiple times since December 2024. The more often a level is tested, the more likely it breaks.
Breakout Zone: Price is now breaking and retesting the key breakout zone between 0.0095 - 0.0104.
Volume: Gradual increase in volume hints at accumulation by bulls and supports the breakout scenario.
🐂 Bullish Scenario: Breakout Confirmation Could Trigger 100%+ Rally!
If price closes decisively above 0.0104, it would confirm the breakout and open up multiple upside targets:
Target Price Level Notes
🎯 Target 1 0.0118 Minor resistance — initial profit zone
🎯 Target 2 0.0132 Previous structure resistance
🎯 Target 3 0.0153 Major Fibonacci and psychological level
🎯 Target 4 0.0203 Key breakout level from early 2025
🎯 Target 5 0.0220 (High) Full breakout target based on historical high
➡️ A confirmed breakout from this 7-month trendline could trigger a powerful mid-term bullish run.
🐻 Bearish Scenario: Rejection = Downtrend Still Intact
If DGB fails to hold above 0.0095–0.0104 and gets rejected:
Price could fall back toward support zones at 0.0075, then 0.0060
A breakdown below 0.0050 (historical low) could lead to deeper selloffs
Lack of volume on breakout = potential fakeout / bull trap
🧠 Market Psychology & Pattern Context:
Falling Wedge Pattern: A classic reversal pattern signaling that sellers are losing control while buyers prepare for a breakout.
Volume Confirmation: Valid breakouts are almost always accompanied by rising volume. Watch this closely!
Psychological Price Levels: Zones like 0.01, 0.015, and 0.02 often act as magnet levels and take-profit targets for institutions or swing traders.
⚠️ Summary & Strategy:
DGB is currently at one of its most critical levels in 2025
Bullish breakout could deliver 50%–120% upside for swing traders
Rejection = caution, don’t FOMO into resistance
Ideal SL (stop loss) below 0.0090 for breakout entries
📢 Final Tip:
> "Breakouts are only as strong as the volume and candle closes behind them. Wait for confirmation — don’t chase shadows."
#DGB #DGBUSDT #CryptoBreakout #AltcoinAnalysis #TechnicalAnalysis #FallingWedgePattern #BullishSetup #BearishScenario #CryptoTrading #TrendlineBreakout
Dgbusdtbuy
DGB/USDT – Preparing for a Rebound from a Historical Demand Zone
🔍 Pattern and Structure Analysis
The DGB/USDT pair is currently testing a historical demand zone in the 0.00550 – 0.00733 USDT area (highlighted in yellow). This zone has proven to be a strong bounce area since mid-2022. The price structure is forming a large double bottom in this support zone, indicating a potential medium- to long-term bullish reversal pattern.
🟢 Bullish Scenario
If the price successfully holds and bounces from this support:
Short-term targets: 0.00832 – 0.01067 USDT
Mid-term targets: 0.01343 – 0.01807 USDT
Long-term targets: 0.03207 – 0.03845 USDT
This potential upside is supported by an emerging early-stage parabolic move, as illustrated by the yellow projection arrow. If volume increases and market sentiment improves, we may see a multi-wave recovery pattern unfold.
🔴 Bearish Scenario
However, if the price breaks down below the key support at 0.0055 USDT:
It may retest the all-time low around 0.00500 USDT
Such a breakdown would invalidate the long-standing support structure and may lead to further downside pressure
🧩 Pattern Summary
Pattern: Double Bottom / Accumulation Zone
Timeframe: 1W (Weekly)
Current Sentiment: Neutral to Bullish, depending on confirmation of a rebound from the yellow zone
🧠 Additional Notes
This accumulation zone may present a valuable opportunity for swing traders or long-term investors looking for entries at undervalued levels. However, it's crucial to wait for volume confirmation and a strong reversal candlestick pattern before entering.
#DGB #DGBUSDT #AltcoinAnalysis #CryptoWeekly #DoubleBottom #SupportZone #ReversalPattern #CryptoSignals

DGBUSDT 1W AnalysisDGB ~ 1W Analysis
#DGB Buy back gradually from this support block with a short term target of at least 20%+ from here.

DGBUSDT 1WDGB Update ~ 1W
#DGB So far it continues to maintain its bullish structure. The this block is wave 2 in the Eliot Wave pattern. Minimum target 20%++

DGBUSDTDGB ~ 1W
#DGB Retesting this lowest support block. If you have Conviction on this coin,. This is a great time to buy back.

DGBUSDTDGB ~ 1W
#DGB Retesting this lowest support block. If you have Conviction on this coin,. This is a great time to buy back.

DGBUSDT 1WDGB ~ 1W
#DGB Price maintains this Block of demand zone, It seems that the current price is good enough to start buying, at least for the short 20%+.

Trading opportunity for DGBUSDTBased on technical factors there is a Long position in :
📊 DGBUSDT
🔵 Long Now 0.00850
🧯 Stop loss 0.00749
🏹 Target 1 0.01014
🏹 Target 2 0.01165
🏹 Target 3 0.01430
💸RISK : 1%
We hope it is profitable for you ❤️
Please support our activity with your likes👍 and comments📝

DGB/USDT TRADE SETUP! READY TO PUMP 65% Hi guys, This is CryptoMojo, One of the most active trading view authors and fastest-growing communities.
Do consider following me for the latest updates and Long /Short calls on almost every exchange.
I post short mid and long-term trade setups too.
Let’s get to the chart!
I have tried my best to bring the best possible outcome in this chart, Do not consider it as financial advice.
LONG #DGB/USDT
ENTRY: $0.03447 to 0.03570
SELL- 50% to 60%
LEVERAGE: 5X
STOP LOSS: $0.033
This chart is likely to help you in making better trade decisions, if it did do consider upvoting this chart.
Would also love to know your charts and views in the comment section.
Thank you

DGD/USDT TRADE SETUP! READY TO PUMP 65% LONGHi guys, This is CryptoMojo, One of the most active trading view authors and fastest-growing communities.
Do consider following me for the latest updates and Long /Short calls on almost every exchange.
I post short mid and long-term trade setups too.
Let’s get to the chart!
I have tried my best to bring the best possible outcome in this chart, Do not consider it as financial advice.
LONG #DGB/USDT
ENTRY: $0.0347 to 0.034
SELL- 50% to 60%
LEVERAGE: 5X
STOP LOSS: $0.033
This chart is likely to help you in making better trade decisions, if it did do consider upvoting this chart.
Would also love to know your charts and views in the comment section.
Thank you

DGBUSDT Gonna LONGDGBUSDT create cup with handle pattern with hidden bullish divergence. So, i anticipate DGBUSDT gonna bullish.

