NYA chart Posted The signal for the Top is hours away .7/24/7/26The chart posted is my work based on the golden ratio and SPIRAL calendar work .We will be hit by one of if not the highest ever solar storms from 7/24 to 7/26 I will be re shorting into this date And will look for the markets worldwide to see a massive event .I have been talking a massive earthquake and the markets to begin a drop into OCT 10 to the 20th . best of trades .Wavetimer
DIA

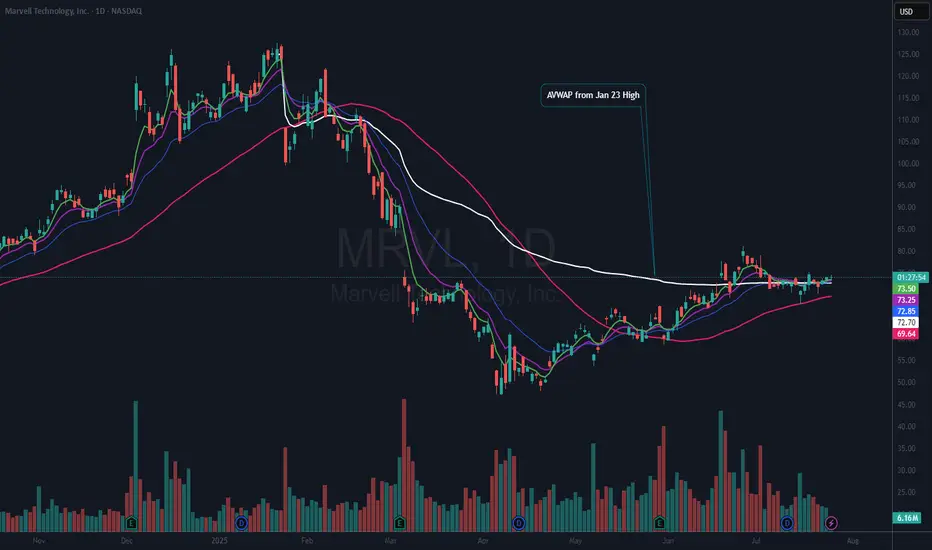
$MRVL Nice Risk Reward HereNASDAQ:MRVL is still basing so this could be quite an early trade. However, I did put on a ½ size position yesterday as it rose above the 21 EMA (blue). I like that it is over the AVWAP from the Jan 23rd all-time high (ATH). That means that by price and volume the majority of stockholders are at or near breakeven since that ATH. Which also tells me that there are not many sellers left and that the stock has a chance of entering a stage 2 uptrend.
My current stop will be based on a solid close below the 50 DMA (red). I want to add to my position “if” we can get a good follow-thru day above $75.26.
If you like this idea, please make it your own and follow “your” trading rules. Remember, it is your money at risk.
$SNOW Bull Flag?NYSE:SNOW has been and still may be one of the leaders in this market. It is forming a Bull Flag and within that flag is a nice wedging formation.
I am bullish with this name, so I have an alert set on the upper downtrend line. Should it break that, I will look for a good risk reward entry to open a position. It is possible if the market pulls back, that NYSE:SNOW could continue down to test the 50 DMA (red). All TBD.
If you like this idea, please make it your own and follow your trading plan. Remember, it is your money at risk.
In addition, Nvidia NASDAQ:NVDA and Snowflake NYSE:SNOW were among the investors that backed artificial intelligence company Reka's $110 million funding round, Reka said Tuesday.
Reka said the investment will accelerate its technical development efforts and will also scale its multimodal platforms.
The investment boosts the startup's valuation to more than $1 billion from the previous $300 million in a 2023 funding round, Bloomberg reported Tuesday.

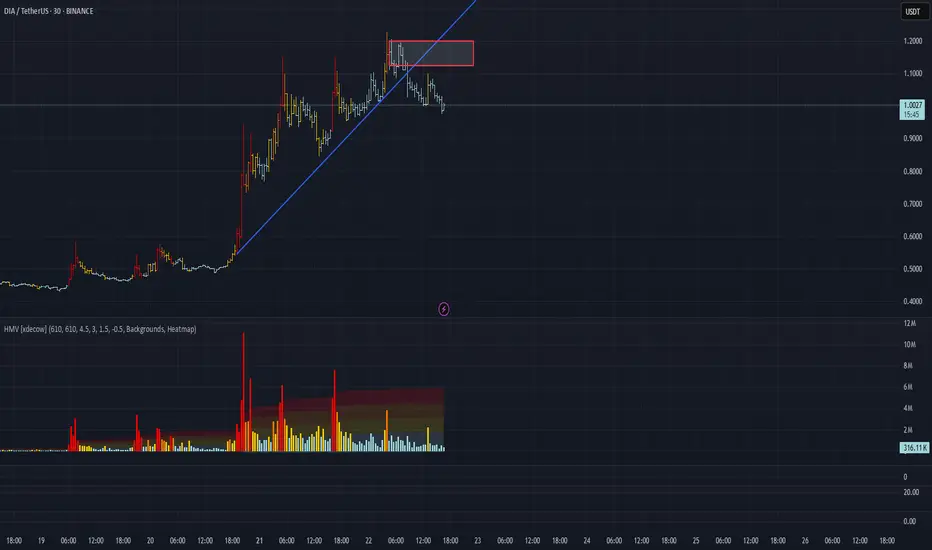
DIA/USDT Analysis: High Probability of Correction
This asset has experienced a trend break and a breakdown of the ascending trendline. A volume cluster has formed above the current price, which triggered the current correction. If these levels are retested and met with a reaction, we consider a short position with a potential target of $0.9.
Sell Zone: $1.125–$1.2
This publication is not financial advice.
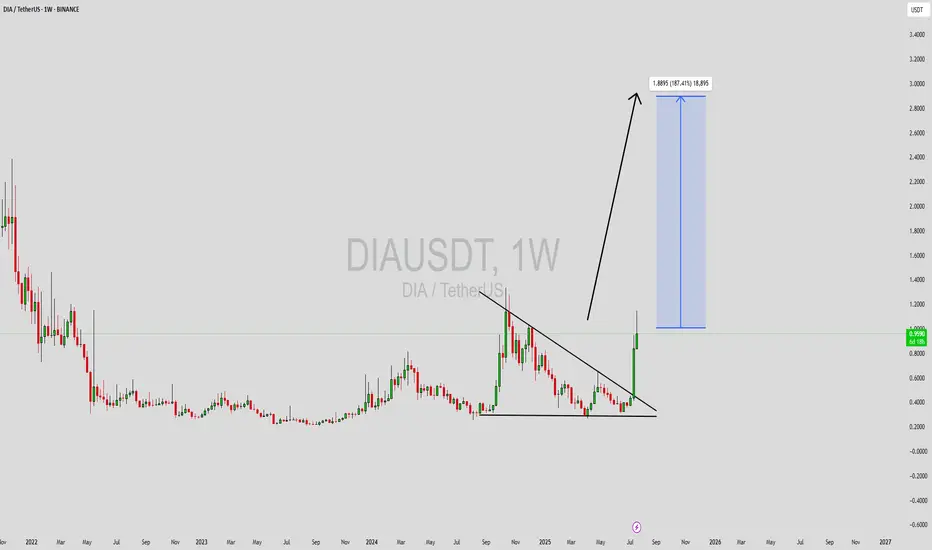
DIAUSDT Forming Powerful BreakoutDIAUSDT (DIA/USDT) has just completed a powerful breakout from a long-standing descending triangle pattern on the weekly timeframe. This move signals a potential shift from accumulation to expansion as bulls regain control. The breakout is accompanied by a significant surge in trading volume, suggesting that both retail and institutional investors are beginning to accumulate positions in anticipation of a broader rally. Technically, the pattern break targets a potential upside of 140% to 150%, supported by historical resistance levels shown on the chart.
DIA, a decentralized oracle platform, plays a vital role in bridging off-chain data to blockchain networks. As the DeFi space continues to expand, reliable data oracles like DIA are gaining increased relevance. This fundamental strength, combined with the bullish technical setup, makes DIA a solid candidate for medium- to long-term portfolio consideration. The recent price action could be the beginning of a major trend reversal, especially as on-chain metrics show growth in active wallet interaction.
The structure of the current breakout also reflects a clean technical progression—multiple higher lows leading into resistance, followed by a strong breakout candle with volume confirmation. If DIA can hold above its breakout level and establish support, the next leg higher could be rapid. The market sentiment is clearly shifting as more market participants recognize DIA's potential in the growing Web3 infrastructure.
✅ Show your support by hitting the like button and
✅ Leaving a comment below! (What is You opinion about this Coin)
Your feedback and engagement keep me inspired to share more insightful market analysis with you!
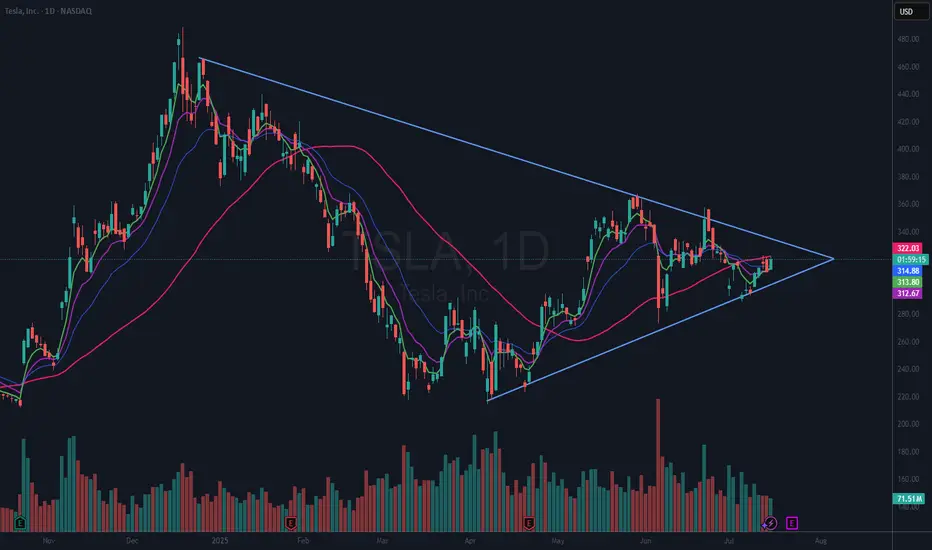
$TSLA Giant Wedging Pattern (VCP)NASDAQ:TSLA is in a giant 7 month wedging pattern. It can be seen as a VCP (Volatility Contraction Pattern) as well. These types of patterns can break either way. However, in this case we have a rising 50 DMA (red). That suggests to me that this will break to the upside.
I already have a small position in TSLA and I will look to add if or when it breaks above the 50 DMA and again if or when it breaks above the upper downtrend line. If it breaks the lower line, I am out.
Be aware that Tesla reports earnings in 7 days, Wednesday, July 23rd, after the bell.
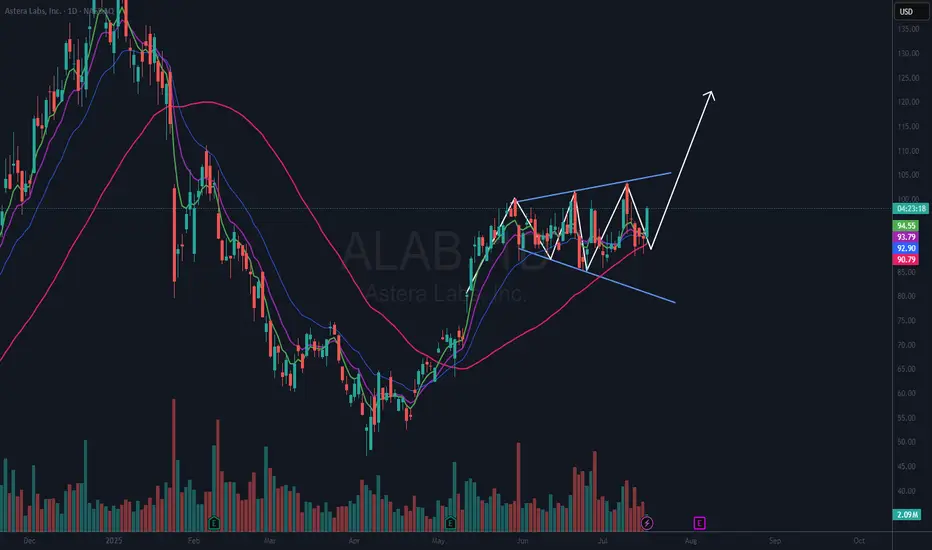
$ALAB Forming a Megaphone PatternNASDAQ:ALAB has seen a lot of volatility as of late. I took a position in it and was stopped out for a loss due to that volatility.
I may be too fixated on this name, but I want to get involved as I think it has a chance to run to previous highs. I thought it had formed a cup with handle pattern, and I got involved on Wed. June 18th only to get stopped on Monday, Jun 23rd. I have been watching it since.
Now it appears it is forming a megaphone pattern. These patterns usually resolve in the direction of the last trend. In this case that trend was up. I like too that the 50 DMA (red) is in an uptrend. I have an alert set on the upper trendline resistance area. Should that trigger, I will look for a good risk reward entry.
If you like this idea, please make it your own and follow your trading plan. Remember, it is your money at risk.
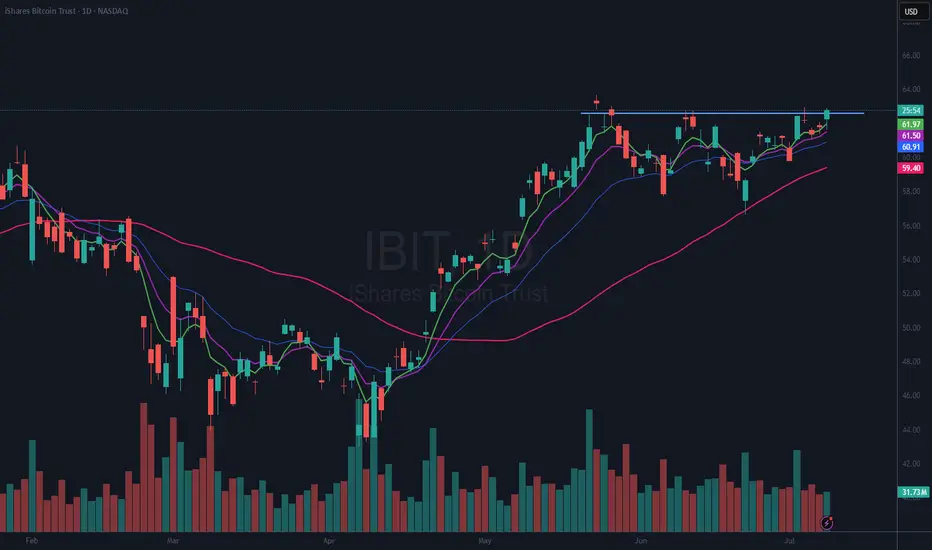
$IBIT a BITCOIN ETF Is Breaking Out of a Flat BaseNASDAQ:IBIT I have been looking at this for quite awhile now. I drew in an “area” of resistance, and it has hit that twice in the last few days. I bought a position on Jul 3rd and was stopped out. It just broke again so I have opened yet another position and will use a stop on a close below the 21 EMA (blue).
If you like this idea, please make it your own and trade it only using your own trading plan. Remember, it is YOUR money at risk.
$HUBS Basing / Ready for Next Move Higher?I traded this stock last year and made good $$$. I think it may be time for it to make another run. I had set an alert to see if it would get up and over the 21 EMA. That triggered today. Based on that, I have opened a ¼ size position, not much, but enough to make me keep my eyes on it. I also have a stop just below today’s low. This is another A.I. play and it is also a bit of a dumpster dive. It seems to me to have broken its downtrend and in a Stage 1 base. It has also put in a higher low from the April 2025 lows. I do not expect this will just rocket higher and it may turn out to be dead money. But it is one you may want to keep an eye on.
If you like this idea, please make it your own and follow your trading plan. Remember, it is YOUR money at risk.
HubSpot's NYSE:HUBS new Breeze AI platform continues to turn heads, since its launch last September, just ahead of Salesforce's NYSE:CRM Agentforce.
The idea is simple enough: let Breeze handle the grunt work in your Marketing, Sales, and Service Hubs by generating leads, automating campaigns, personalizing outreach and even fielding basic support questions in real time. Sounds neat, right?

$ORCL Beats Earnings – Flat Base Breakout?There is a lot to like about NYSE:ORCL both on the chart and fundamentals. Not only did they beat earnings and now get an upgrade (see below), but the stock has also now formed a flat base after earnings. What that means to me is that buyers have pushed the stock up and there are not enough sellers to bring it back down.
I have an alert set at 215.01. If that triggers, I plan to open a full-sized position with a stop just under the most recent low (202.54). That is a 6% risk. Although, if it does not perform well right off the bat, I may close it on whatever day I open if it falls below the day low. All TBD.
If you like this idea, please make it your own and follow your trading plan. Remember, it is your money at risk.
Oracle rises as Stifel upgrades to 'buy'
** Stifel upgrades stock to "buy" from "hold", citing strong momentum in its Cloud business and disciplined cost management
** Increases PT to $250 from $180, implying an 18.91% upside to stock's last close
** "We believe Oracle is well positioned to accelerate total Application Cloud growth to the low teens range in FY26" - brokerage
Oracle Beat Expectations
Wednesday, June 11, 2025 at 4:05 PM ET
Oracle (ORCL) reported earnings of $1.69 per share on revenue of $15.90 billion for the fiscal fourth quarter ended May 2025. The consensus earnings estimate was $1.64 per share on revenue of $15.54 billion. The Earnings Whisper number was $1.66 per share. The company beat expectations by 1.81% while revenue grew 11.31% on a year-over-year basis.

$AAPL In ConsolidationNASDAQ:AAPL is consolidating here in a wedging pattern. I do not know which way this will resolve. But, since I rarely if ever short, I am looking on the long side of a trade. The thing I like about a consolidation pattern like this is, you know when you are wrong very quickly. My plan is to take a ¼ size long position if / when it moves above the 50 DMA (red) with a stop just below the most recent low (which would also correspond to dropping below the lower wedging trendline.
Then if it can break out over the upper downtrend line, I will look to build out my position. I thought this would be a good one to put on your watchlist. If you like the idea, please make it your own so that it fits within your trading plan.

MAOR HEAD N SHOULDER TOP FORMATION I AM 100 % SHORT NOW The chart posted is that on the NDX 100 .This is my view of what has formed . best of trades WAVETIMER

$FTNT In a Wedging PatternI bought a ½ size position on June 2nd after it had tremendous volume and institutions protected it from slipping below the 50 DMA the day before. It has been nothing but sideways since and I am slightly underwater. My stop is a decisive close under the 50 DMA. I did not feel the Wed June 18th qualified as decisive.
Mark Minervini may call this a VCP (Volatility Contraction Pattern). In any event it is clearly in consolidation mode and could break either way. I will either be selling if it does not recover the 50 DMA or will be adding if / when it closes above the downward sloping upper trendline.
I thought this would be a good one for your watchlist. If you like the idea, please make it your own and follow “your” trading rules. Remember, it is your money at risk.

$TLT Rising Channel or Bear Flag?Is it time to invest in NASDAQ:TLT ? It looks positive to me. With inflation cooling down it looks like bond prices could increase, which means rates are lower. We do have a Fed Meeting coming up so there could be more volatility depending on the “Feds” messaging.
I am taking this long today with a ½ size position. I will place my stop just “below” yesterdays low of $85.46. I am going long because I see a series of higher lows and higher highs. And I have a well-defined risk level of about 1% to know if I am wrong.
If you like this idea, please make it your own. Make sure you follow your trading plan.

QQQ NOTICE TREND LINE SUPPORT I have now started to position for the transition in the markets I have moved out of all calls again for the 4 time in 4 days each of the trades made $$ . but today is day 39 TD of the rally . And I am looking for a TOP in day 40 TD I have now moved to 40 today then 75% MOC in spy and qqq 5550 555 560 QQQ puts 2026 time zone and 650 in spy . The trendline has held rather nice to help make some nice $$ and we if bullish should now be in early wave 3 of 5 of 5 of 5 .So why buy puts NOW simple answer is It could still be wave c up for wave B or wave D. and That today is day TD39 I have posted a possible Major top due on td 40 and The spiral hold up into june 6th to 9th .I know my risks and am willing to start taking the same stand and positions as I did 11/29 12/6 and feb 18th based on the wave structure and PUT /CALL model . I am willing to This is not for all traders . But I am turning down in NYSI and the NYMO is showing buying is running out but bullish call buying is nearing the two last TOPS . I have 25 % cash and will wait for two things One put call drops to 60 on 5 day or 10 day at 65 second daily RSI is no confirmation . 3rd the qqq reaches 531/534 knowing it could extend to 541/555 and similar in sp cash or the DJI prints a .786 this is a lot but it is part of the game plan best of trades WAVETIMER

SUPER CYCLE TOP SOON IGV WAVE 5 The chart posted is by far the strongest chart within the market and has a clean wave structure from an Elliot Wave view . I have now taken a position for the last wave and will exit and go 100 % short all markets once the 5th wave has reached the targets min 106.7 to ideal target is 111 zone this should be seen based on my work in spiral cycle top is due 2.5 TD days from today with the alt on June 6/9 best of trades WAVETIMER

DIA has reached the MS1 LevelThe DIA has reached the MS1 Level at 420.77
This level being reached is a good indication that the short-term intra-day direction is down.

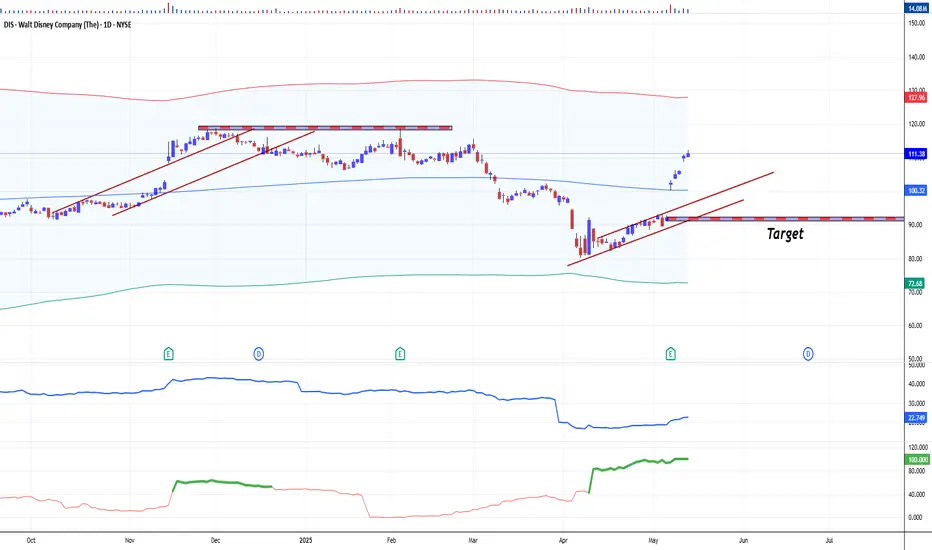
The Walt Disney Stock Future Goes 'Shining Bright as Never'The Walt Disney Company’s stock (DIS) has demonstrated robust performance following its Q2 2025 earnings release a week ago, with both fundamental and technical indicators reflecting positive momentum.
Here’s a detailed analysis:
Fundamental Perspective
Disney’s Q2 2025 results exceeded expectations, driven by strong execution across its entertainment, streaming, and experiences segments. Key financial highlights include:
Revenue Growth. Revenues rose 7% year-over-year (YoY) to $23.6 billion, surpassing estimates of $23.14 billion.
Profitability Surge. Adjusted EPS jumped 20% YoY to $1.45, beating forecasts of $1.20. Net income swung to $3.3 billion from a $20 million loss in Q2 2024.
Streaming Strength. Disney+ added 1.4 million subscribers (reaching 126 million globally), defying expectations of a decline. Combined Disney+ and Hulu streaming operations generated $336 million in profit, a sevenfold increase from $47 million YoY.
Guidance Upgrade. Disney raised its fiscal 2025 adjusted EPS forecast to $5.75 (up 16% YoY), citing confidence in double-digit operating income growth for entertainment and sports, and 6%-8% growth for experiences.
Growth Drivers:
Entertainment. Segment operating income rose $0.5 billion YoY to $1.3 billion, fueled by streaming profitability and box office success (e.g., Moana 2).
Experiences. Theme parks and consumer products saw higher attendance, guest spending, and cruise demand, though international parks faced headwinds in Shanghai and Hong Kong.
Strategic Initiatives. The upcoming Abu Dhabi theme park and ESPN’s direct-to-consumer launch are expected to drive long-term growth.
Technical Perspective
Disney’s stock firstly reacted positive to the earnings beat, reflecting renewed investor confidence:
Price Action. Shares surged 10-12% post-earnings, hitting an intraday high of $103.31. Over the past month, DIS gained 31%, including a 20% rally in five days.
Valuation. The stock trades at 18.4x forward earnings and 2.1x sales, a premium to industry averages but below its historical norms.
Analyst Sentiment. The average price target stands at $126.50 (14% upside), with a Street-high target of $148 (33% upside).
Technical Indicators:
Momentum. The breakout above key resistance levels (e.g., $100) signals bullish sentiment, supported by high trading volume.
Volatility. Beta of 1.01 aligns with market volatility, while short interest remains low at 1.24% of float.
Risks and Considerations
Macroeconomic Uncertainty. Disney acknowledged potential impacts from tariffs and global economic conditions.
Valuation Premium. While growth prospects justify some premium, prolonged macroeconomic stress could pressure multiples.
Investors challenge
Disney’s Q2 2025 results underscore its ability to execute on streaming monetization, theme park innovation, and content-driven growth.
Fundamentally, raised guidance and streaming profitability signal a turnaround, while technically, the stock’s breakout suggests locally bullish momentum.
Following historical patterns we are Bearishly tuned at this time, with targets to fill the gap at $92.17 per share (left after Earnings report), and drilling all the way below.
--
Best wishes,
@PandorraResearch Team
US Downgrade, 3-5-10% Pullbacks But Still Bullish on S&PHappy Sunday!!!
US Futures open lower after Friday's close and Moody's downgrade.
Last time this occurred in 2011, the S&P dropped around 10% from the "news."
This is all interesting timing but I'm still liking pullbacks for opportunities to position
bullish in the US indexes (S&P, Nasdaq, Dow)
Because the melt-up continues to run (US/China gap last week and drift higher), I'm trying to stay patient for a pause or pullback
Trump and Bessent are still chirping about Tariffs and a government "detox" so a round of trade war related news may help calm the market's red hot advance post April 7 lows
I'm selling calls on owned positions for income. I'm waiting for more favorable levels to add new positions, but within 3-4% of all time highs for the S&P and Nasdaq I don't think anybody will be surprised to see the all-time highs revisited in the near to medium-term
Let's have a great week - thanks for watching!!!
-Chris Pulver

Swing Pick $13 to $210 per share in less than 2 months$13 Buy in March to $200/share today! 😱
Swing Pick on 14th March to buy NASDAQ:RGC at $13.10 per share
Today's high is $210 per share 🔥
15X in less than 2 months, I wish I was still holding, congrats to those that still are 💸
You can also see posts about NASDAQ:RGC on my trading view from 2 months ago even the one mentioning it at $4 per share

$LDOS Earnings Beat and Cup BaseI have been long NYSE:LDOS since March 17th with a ½ size position. I have come close to being stopped out but, my stop never hit. I was up enough that I held through earnings on May 6th. I would expect that it could form a small handle on this cup base, but it may not.
I like the fact that it is above all the Moving Averages. I am not an expert at Fibonacci lines, but it looks like we are right at the .382 retracement area and what is a small resistance area as well. Once through that area, the 50% retrace aligns with another area of resistance. At around $160 – 165 a share.
They were upgraded to Overweight by Wells Fargo with a price target of $200.
If you like this idea, please make it your own so it aligns with your trading / investing plan.
Leidos Beat Expectations
Tuesday, May 6, 2025 at 6:00 AM ET
Leidos (LDOS) reported earnings of $2.97 per share on revenue of $4.25 billion for the first quarter ended March 2025. The consensus earnings estimate was $2.47 per share on revenue of $4.08 billion. The Earnings Whisper number was $2.54 per share. The company beat expectations by 16.93% while revenue grew 6.79% on a year-over-year basis.
The company said it continues to expect 2025 earnings of $10.35 to $10.75 per share on revenue of $16.90 billion to $17.30 billion. The current consensus earnings estimate is $10.51 per share on revenue of $17.09 billion for the year ending December 31, 2025.
Leidos Holdings Inc. is an applied technology company delivering solutions and services that leverage the power of data analytics, systems integration, and cybersecurity across three markets: national security, health, and engineering.

2025 forecast NYA Wave B top nearing 20% decline plusThe chart posted is that of the NYA .12/8 /2024 Major wave B top forming target 20,190 alt 22130 . Cycles are bearish into 2025 and well into oct 2026 Depression Like decline . into oct 2026 . First big decline should take us down into the spiral turn date 3/10 2025 week . in what should be an 11.8 to 16.6 % decline we should then see a rally into Mid July to Sept 2nd Then cycles begin next bear cycle phase . Down hard in most of 2026 The market in this decline should take us down about another 26 to 35% in wave 3 , The final low if the big picture is correct should see a major low oct 10/20 2026 the total decline should be 38% to 44 % Gold should see 1050 to 1489 . Bonds should form a rally but will fail over n over . BMV:US should see 119 to 121 handle in 2025 by mid oct 2025 . . Tariffs and the trade war are the main reason . But the markets since 2009 have been Liquidity driven with zero rates forced money flows into Assets 2025 will see a Deleveraging of inflation assets as we decline in housing markets based on the 18.8 year cycle in housing . Unemployment will see a sharp rise into 5.5 -6.1% into oct 2025 . based on downsizing of the federal workers Bitcoin will see a drop min 42/35 and a final low is 18500 to 22100 peak to low . . In dec 2021 Forecast called for a 20 plus decline into oct 10 to the 20th 2022 into 3510 to 3490 in the sp 500 .Dec 2022 forecast was calling for a rally to new highs in all indexes . In dec 2023 forecast called for the sp to reach 5636 to 5818 and the year of a vix of 29 or better we saw 60 . What next is at most I have said is a target in the sp of 6183/6235 We may or may not reach that But if is going to it will be jan 2 to the 20th 2025 . The last of the money flow . Best of trades WAVETIMER

$STZ Get Upgrade and $125 Price TargetNYSE:STZ Has been in a stage one base for about 4 months and is above all the Moving Averages with the fastest on top and slowest on bottom. With the new upgrade can it breakout into a stage 2 uptrend?
I have an alert set at just 188.50, right in the resistance area. I will take the trade if it triggers with a stop just below the most recent low of 182.62. That makes a well-defined risk reward for me.
On the fundamental side, we are moving into summer and beverage sales could easily pick up.
