DIA USDT TODAYPLZ DO NOT SELL MY SIGNALS
1-Apply your own risk management.
2-Daily and Weekly Targets
3-Hunt the profits at any level you see convenient for you.
4-Green Zone for entry,
5-Red Level Exit by OCO
6-Yellow levels are targets.
have a good day guys.
DIA

#SPY or #DIAOne year Daily Chart
a simple comparison by dividing $SPY / $DIA
while rsi remain above current leveled trendline

vix 8 hour chart another 150% spike in April?Hello traders, today let's review VIX 8hour and daily chart .
Is it possible that another 150% burst is in the making now?
Entirely plausible, in fact based on advanced XABCD setup
the current pullback/correction might be over near 15/16.00
later in April. Based on time/price symmetry point C of
the XABCD pattern structure might come in at 15/16.00
sometime in April 2023.
The pattern is defined by point X at 33.00, point A at18.50,
point B at 30.00, expecting point C print at 16.00 and point
D print at 38.00, based on 127 extension.
Recommended strategy: buy calls / write puts once
we land near point C near 16.00. this is a higher risk
entry strategy, so always do your own due dill and
use other indicators to confirm the entry. good luck!
🎁Please hit the like button and
🎁Leave a comment to support our team!
RISK DISCLAIMER:
Trading Futures , Forex, CFDs and Stocks involves a risk of loss.
Please consider carefully if such trading is appropriate for you.
Past performance is not indicative of future results.
Always limit your leverage and use tight stop loss.

$NDX Breaking Out?Looks like the $NASDAQ may be breaking out today. See Notes on Chart. I am preparing for better than expected outcomes over the coming days / weeks. I am still about 80% cash here. Some consolidation over the next few days would be healthy. Let's see what happens. Ideas, not investing / Trading advice.

$NDX loosk MUCH better vs $DJIWe can see intraday that #banking exposure is less on the #QQQ vs #DJI
Nibbled on #TQQQ this morning.
Don't be surprised if it goes green today, at least short term.
We may get some sort of push before EOD, doesn't mean risk is over.
TRADING
$QQQ $TQQQ #stocks

FTSE HIT A NEW ALLTIME HIGH DEGATIVE/ RSI SPOT ON I need not remind you it is a worldwide thing Deflation cycles

Who would you trust with your money?Spoiler alert: More evidence against NDQ in this idea!
US Companies are organized in clusters, some of them are DJI, SPX, RUT, NDQ etc.
Some of them are more trustworthy than others. And by that I mean which of these sets one can depend on.
DJI is indeed a dependable group of companies, the so called Blue Chips. Composed of the 30 largest US Companies.
These companies aren't playing around, they have deep foundations that can withstand the worst of crises.
The opposite of foundation is hollow ground. In finance, one hollow ground could be derivatives.
More info about the possible repercussions of derivatives in my last idea:
Derivatives are financial weapons of mass destruction.
-Warren Buffett
I have talked about how you should not blindly trust the price of the main indices.
And as we know, the effect of derivatives is embedded in the price we see every day in our Watchlists. Equity price is a victim of derivatives.
You know, these derivatives which by default have no foundation and are susceptible to a possible crash like the .com bubble. Let's hope a ".options" crash doesn't come for derivatives. And if it does, let's hope that the "weapons of mass destruction" was a figure of speech!
So how big is their effect? BIS warned about the hidden debt, the "everything bubble" we have created and we are comfortably sitting inside it. Buffett has warned about derivatives.
The only thing I can analyze is these hyperbolic charts, namely SQQQ (short QQQ) and it's cousins DOG (short DJI) and SPXU (short SPX). To remotely begin to make sense of their nature, we have to reduce their exponent. Dividing a chart by an arbitrary amount doesn't "flatten" it to a lower growth scale. We will have to raise SQQQ to 0.2 for example to bring it down to meaningful and comparable levels.
I tried normalizing these 3 beasts, using the following methodology:
For the entire history of SQQQ we calculate the SQQQ^-1 chart, and measure how much it grew in this period. As seen above, SQQQ^-1 increased by 17000x. To make it comparable to QQQ, we progressively increase the exponent so as to make QQQ and SQQQ growths identical. If this explanation didn't make sense, the following chart may clear things out.
So we come up with the following "balanced" derivative charts.
SPX // SPXU^-0.216
DJI // DOG^-0.62
QQQ // SQQQ^-0.244
WIth the // symbol I mean that these charts move in parallel.
So what can we infer from them? More speculation maybe, more questions than answers... But still, there seems to be some important difference between them.
I will divide these two charts to make some sense. When the chart increases, the "real" part of the index is increasing. When the chart decreases, the "derivative" part of the index is increasing. So in a sense, the chart increases when indices grow fairly , without cheating using derivatives.
First SPX
Next DJI
Finally QQQ (NDQ)
Painful...
Is this derivative bubble the only reason NDQ is still afloat in this immense QT environment?
In an attempt to keep business going and as money gets scarce, Big Tech is pushing prices higher using an immense amount of derivatives.
Are these derivatives going to be the doom of NDQ?
All of this may be speculative and some charts may not be financially true. But sometimes, price simply discounts everything.
Tread lightly, for this is hallowed ground.
-Father Grigori

GS WAVE C CRASH EARLY STAGEThe chart posted is my top wave count based on ew and cycles I do not in anyway see the Fed coming to the rescue the cycles I stated in dec 2021 are clear the deflation of ALL assets min downside is and will be at or about the march 23 low 2020. . I have been every clear based on 121 years of data the 20 month avg turned down and had 90 days to overcome the 4250 area in the sp 500 we have now passed it 3 days ago we are only mid point in the Bear Market and the worst has yet to come . The fed will reduce the balance sheet over the next 24/30 months and based on the Mandate of 1913 to keep INFLATION under control .I stated in dec 2021 the we ended a super cycle bull market dated back to 1974 and most likey to 1932 under both views my target of 3511/3490 was going to be the first leg down . We ended the abc rally into aug 16th as the forecast called for then dropped into the time cycle due oct 4th to the 20th focus oct 10th we have rallied into alt date for wave 2 into feb top the only way to view this drop at BEST is a wave B . I have moved all my funds into us T BILLS . the wave C CRASH based on all the data back to 1902 has min date is OCT 2023 and No New BULL MARKET till OCT 2024 The DEPRESSION LOW . BEST OF TRADES WAVETIMER . I ALWAYS SAID I WOULD BE HONEST AND STRAIGHT FORWARD

Things look ugly for $DJI but there's ray of light$DJI has seen a ton of SELL volume & in reality the environment doesn't seem conducive of any positives. Bu there are some.
Pluses:
Doji - Needs more confirmation tomorrow.
Oversold on daily & support is 32.5k
Major long term downtrend is around 31.1k
Inverse Head & Shoulder can still pan out as long as #DJI doesn't break below the last barrier.
Technically, it can go to MAJOR support in the 30k area. Yes, it's ugly but that is some hope for the bulls.
The other indices don't look as good.

$VIX hits top part of Symmetrical triangle$VIX rarely tends to trade in a small & tight range.
#VIX Sold off big last couple months & traded in a decent range for a bit & recently, including today, popped big.
As you can see it hit the top part of the Triangle Formation.
Hard to call here but stocks gaining some momentum, being that many were OVERSOLD, including $DJI & $NDX, $SPX and so on, is not out of the question.
Risk reward @ day lows in #stocks was good. A lot of fear out there is good for reversals.
Keep eye out on 4 hour charts for a good idea of where we stand.
FYI $DJI 4hour close was NOT the best setup BUT it did form a BULLISH Engulfing with GOOD VOLUME.
IMO 32.5k on #DJI is good & if it breaks & holds that is a good sign.

SPX500 - The Smallest Retrace & The First To GoI have to point out once again that, despite all the bearish fundamentals, market price action is simply not a bear market. You see this so clearly on SPX's monthly bars:
During the worst of October, all the market was really doing was retracing to the two-month late 2020 orderblock that ultimately led to the 4,800 ATH. Price has since retraced and the markets at large don't like to dump, even on bad news. Even CPI coming in hot didn't lead to much of a dump.
The Geopolitical Climate With China
The most important factor when trading these markets is that you have to keep an eye on what's going on with China at all times. I've talked in my previous posts extensively and ad nauseum about how the Wuhan Pneumonia pandemic has killed a lot more people than the Chinese Communist Party and western establish media let on.
But what this all points to is simply that the Party is in a weakened state. What the Party being in a weakened state means is that a number of geopolitical factions, most notably the western globalist (western Communist Party) bloc has its eyes on how to seize and take control of China as the evil regime falls.
The way the globalists will do things is not to invade China, because the Chinese people and the world will not recognize a western occupation of the mainland. Instead, over the years, groups like the World Economic Forum and other globalist arms have, for a long period of time, been grooming certain Chinese nationals, who are themselves members of the Party, to make preparations for how to seize control of the country when Xi Jinping falls.
The problem the globalists face is that they aspire to install a one world government. But to do that, they need the world's (formerly) largest population and oldest country, China.
However, the existence of the CCP with its rogue, arrogant, and dominating nature makes this impossible, unless the globalists would like to make the CCP the center of the world government, which they obviously do not. Because they want to be the center of the world government.
And so preparations have been in the works for years as to how to take control of China when the Party is gone.
The problem for humanity is that China's 5,000 years of tradition and culture are critical for the future. Yet, everywhere the globalist faction goes you get a twisted, atheist, modernist culture that can't tell the difference between genders, is highly promiscuous, and serves in many ways as a force even worse than the CCP has been in its weakened state over the recent years.
And so, this is the real threat: what the globalist faction will do when it feels the CCP is teetering on the edge. Anything is on the table, because a global crisis will be needed in advance. Environmental disasters, pandemics and plagues, war, problems with nuclear plants, social problems within certain countries, Project Bluebeam stuff, all are on the table.
And all such risks are on the table at any time, and these problems are arranged to unfold when the markets are high, not low, so as to create an additional layer of pain and panic in both the business and civilian sectors.
A layer of the crisis wherein everyone is losing a lot of money is important, because it hurts and causes a lot of damage, and the Party needs a significant and intense crisis in order to have the pretext needed to "save you" from as they install one world government, which is really, the "Ultimate Goal of Communism."
So, be careful. Whatever you believe is your own business, but at least someone is willing to warn you of what is unfolding under your nose.
The call
On weekly bars you can see that the February FOMC pump came up just short of the September CPI gap surprise panic that led markets to the 2022 low of the year:
What this should tell you is that no matter the bearish narrative prevailing or the bearish, scary impulse that may be coming, the SPX has not topped.
Instead, I believe after we're finished being scary for a bit, we're going to see 4,500.
Moreover, because I believe that Oil, Natural Gas, and even Silver are prone to go up in the shorterm, that the SPX's retrace is going to be the smallest, and it'll be the first of the indexes to go up.
WTI Crude - Step 1) $88 --> Step 2) $58
Natural Gas? More Like Natural Go. 4-Handle Coming.
Silver SI - A Simple Trendline and Levels Scalp
A 200 point dump into the 3,800s is enough to make SPY calls expire worthless, enough to scare bulls, trap bears, and enough to give you a 15% upside for a run to 4,500.
You need to fade the bear hype right now, but you also have to be careful about how and when you get in. That means utilizing ETFs, commons that compose the index, and calls that have a 3-6 month expiry, because things could take 30 or 45 days to really unfold and really breakout.
But importantly, if you do see SPX 4,500 and 4,600, you have to check your enthusiasm. You might see a new ATH, but that ATH may serve to be a bump and run reversal that will seriously hurt you.
And most critically, you need to focus your effort on improving your character, taking care of your family, and patching up whatever regrets you're carrying around. Because life is short. Human life is so short. Everyone is about to experience and understand again just how fragile human life really is.
Be careful, friends.

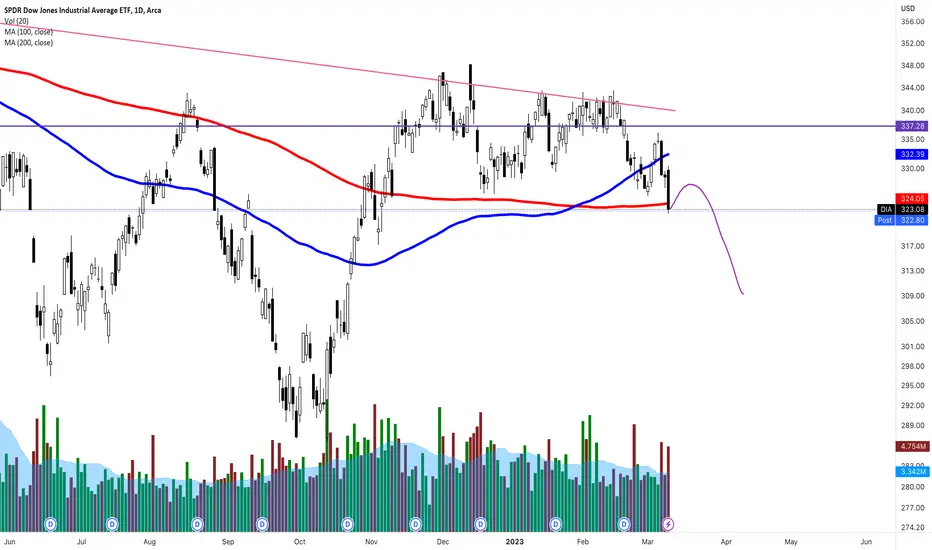
DIA doesn't look strong MANY warning signals on the DIA.
Chart patterns,
Weekly charts
candles
closing below moving averages..
LOOKS WEAK.
TLT - iShares Long-Bond ETF / US30 - Scalp Short, Switch LongThe TLT 20+ year bond ETF has, at this point, been bearish since August.
Personally, I thought after the late December-early January push upwards that TLT would have made a new high before dropping for a while because yields were trading a lot lower than the Fed rate, but that move never transpired and the shares have instead been mucking around.
I don't specifically like this price action for puts/shorts, because there's two big factors that make me believe TLT is going up:
1. On the monthly bars, there's nowhere lower for TLT to go, unless you believe a new all time low is coming:
Monthly
The 2014-2015 lows were taken during last year's bear pulses, in fact.
The same can be said for the weekly candles:
Weekly
When taken in light of the fact that TLT has not traded like it wants to go down for the last three months, this really is a spot that I think a trader has to either stay flat or look for a long at lower prices.
However, there's a big tell that there's a premium short scalp opportunity manifest in US30, the 30-year US Treasury Bond:
US30 30-year US Treasury Bond - Daily
The key factors are:
1. July of '21 was a complete gap fill
2. December of '22 made a lower low
3. The enormous November CPI surprise pump candle gap has been left untouched
4. The '22 year end retrace left the psychological 99.xx level untouched
5. The retrace on TLT to $99.60 was only a sweep of range equilibrium, evidenced by the fact that a new high has not been set. The FOMC candle failed to set a new high, too.
And all of that combines to lead me to believe that the US30 has in the range of 6-10 percent to retrace, and imminently, which would drive TLT down by $7-11.
Moreover, a $10 raid on TLT would make a lot of sense if there's about to be a significant moon mission in the markets. It would take out the December pivot lows, rebalance the CPI-candle gap, and give permanent bears a chance to lose their accounts going short at the bottom.
But I believe if you're going to go short here, you have to treat it as a scalp. Because there's no downside left besides setting a new all time low on the ETF, which mirrors the bond market in its own manifestation, chances are we go up. Moreover, with the Fed clearly slowing the pace of their rate hikes, there's no reason to believe bond yields will exceed 5% for more than a few days until late 2023 at the earliest.
$98-95 TLT would be a long with targets at $120 and $130.
When the markets start to go up again, you have to avoid being short, but you also need to be super, super careful being long. The reason is that the situation in China with Xi Jinping and his Chinese Communist Party being sacked by the Wuhan Pneumonia pandemic is many, many, many times worse than we're being led to believe by establishment media and social influencers.
The number of deaths in China has been terrifying, and whenever you're dealing with so many excess deaths, a country is going to lose a certain percentage of its engineers, technicians, and supply chain. This, in my opinion, is the real reason companies like Apple are moving their production out of China.
So one day in this lifetime of ours when the CCP falls like the USSR did, it will happen overnight, and China daytime is US night time, meaning the US equities and bond markets will go gap down, but this time they'll just stay gap down.
Moreover, the world will change when the Party is gone. The normalcy we've become accustomed to and this way of living as human beings will all change. But the transition won't be so pleasant.
It's very important to value virtue and do your best to cultivate your heart. Atheism and the theory of evolution are unscientific poisons. Never forget this.

Dow Jones by EOY
Based on fundamentals, economics, economic data, geopolitics, Fed QT. It'll be a zig zag on the way down. S&P completed a 50% retracement during this last 5-week rally. The trend seems to have reversed with a resumption in selling that started in Nov 2021, accelerated in Jan 2022, with a recovery in June to Mid August.

DJI intraday sets up for DAILY movementsFrom yesterday
----------
11:34AM
1hr VOLUME SUCKED
BUT
That 1Hr Doji is a good sign & RSI positive divergence
4Hr looks ok, reversal but not strong enough
NEED more volume
More later after
#DJI $DJI #stocks
---
12:21PM
$DJI Volume pumps up more & we close the 4Hour (around 130est) ABOVE 32793 = GREAT sign
(((FYI IT DID NOT DO IT)))
------------------------
4:05PM
It' been a 1k point battle for $DJI
Today we close with a DOJI
Again, this week IS IMPORTANT!
Flat day but 1st signs of buys
Time running out but still holding!
---------------
TODAY TODAY TODAY
$DJI bulls are fighting hard & not giving up here
30Min looks ok
Changed 20 EMA to 30 & painting lil better picture
1Hr reversed back to 20EMA
4Hr still not there, Needs to trade north of RED EMA
BEST if resolved TODAY

DOW - Any relief rally is guilty until proven otherwise !Seems to me like this could unfold as a complexe correction if bulls are to remain in power longer term.
We could see soon a move up but if it stays sideways it's most likely going to be a wave (b) of higher degree Y imho.
Look for individual names showing relative strength right now, those are most likely to be the next big leaders.

1 2 & 10 Year yield seem to be toppish short term, $VIX in range🚨#yields look to be topping🚨
Things are FALLING into place!
Been posting on $DJI & $BTC RANGES
Risk reward was great late last week & on this dip (focusing on DOW JONES ATM)
$VIX staying 18-23 is ok
Adding more $ on dips
#stocks #crypto

$DJI call was spot on, bounce so farWent back to basics last week
Loaded up on $DJI, specifically $UDOW
Will unload as #DJI closer to resistance, red dotted
FUD to lower #stocks #crypto
Then buy the sellers
CLOCKWORK, media is GREAT contrarian indicator
---
THIS WAS POST LAST WEEK
$DJI What do you see? (Was a CHANNEL & $SJI close to support)
IMO RISK REWARD entry point good here if we close above the dotted line
$NDX doesn't look as good but will likely follow
More POVs for $BTC
#BTC Up & Sideways Channels = both good 4 bulls
#crypto

$DIA/#USDT [#DIA]: SuperTrend Resistance_Breakout_Confirmation◳◱ We have identified both a Super Trend pattern and a Resistance Breakout on the $DIA / $USDT chart. Both indicators are signaling a bullish trend, with the Super Trend showing a bullish trend and the Resistance Breakout confirming this trend by showing the price breaking above a key resistance level. Given the alignment of these signals, it may be a good idea to consider entering a long position and targeting higher levels. Our analysis indicates that the key resistance levels are at 0.492 | 0.546 | 0.672 and the major support zones are at 0.366 | 0.294 | 0.168. However, it is important to also consider other factors such as overall market conditions and other technical indicators before making a trade decision.
◰◲ General info :
▣ Name: DIA
▣ Rank: 457
▣ Category/Sector: Infrastructure - Data Management
▣ Overview: Background details for DIA project are currently unavailable.
◰◲ Technical Metrics :
▣ Mrkt Price: 0.408 ₮
▣ 24HVol: 316,400.634 ₮
▣ 24H Chng: 0.493%
▣ 7-Days Chng: -7.46%
▣ 1-Month Chng: 7.32%
▣ 3-Months Chng: 20.95%
◲◰ Pivot Points - Levels :
◥ Resistance: 0.492 | 0.546 | 0.672
◢ Support: 0.366 | 0.294 | 0.168
◱◳ Indicators recommendation :
▣ Oscillators: NEUTRAL
▣ Moving Averages: BUY
◰◲ Technical Indicators Summary : BUY
◲◰ Sharpe Ratios :
▣ Last 30D: 2.15
▣ Last 90D: 1.56
▣ Last 1-Y: -0.15
▣ Last 3-Y: 0.58
◲◰ Volatility :
▣ Last 30D: 0.76
▣ Last 90D: 0.65
▣ Last 1-Y: 1.28
▣ Last 3-Y: 1.68
◳◰ Market Sentiment Index :
▣ News sentiment score is N/A
▣ Twitter sentiment score is 0.58 - Bullish
▣ Reddit sentiment score is 0.90 - Very Bullish
▣ In-depth DIAUSDT technical analysis on Tradingview TA page
▣ What do you think of this analysis? Share your insights and let's discuss in the comments below. Your like, follow and support would be greatly appreciated!
◲ Disclaimer
Please note that the information and publications provided are for informational purposes only and should not be construed as financial, investment, trading, or any other type of advice or recommendation. We encourage you to conduct your own research and consult with a qualified professional before making any financial decisions. The use of the information provided is solely at your own risk.
▣ Welcome to the home of charting big: TradingView
Benefit from a ton of financial analysis features, instruments and data. Have a look around, and if you do choose to go with an upgraded plan, you'll get up to $30.
Discover it here - affiliate link -

The Dow - Despite All Your Rage, You Still Just a Bear in a CageThe prevailing narrative in these markets is still that you're in a bear market. Some stocks are in a bear market, specifically the tech junk that retail likes to lose money on, but the indexes are not in a bear market and have not been in a bear market.
But it's not that the fundamentals behind the world economy are not bearish. Trouble is brewing, and the trouble is big.
Yet, something should trigger your nose when fundamental danger like we have at present has emerged and yet the markets a) don't dump and b) stay high for a long time.
Contrary to how things usually are, the Dow is by far the most bullish of the three indexes. I'm calling for a new all time high on the Dow on the next bull impulse. And while you may, perhaps justifiably, guffaw at these moonboy-sounding words, just take a look for yourself:
Monthly
From a monthly view, based on the February high, the Dow is less than 7 percent away from its bull market highs and a run to 1/2 standard deviation higher is just 12 percent away. And February wasn't the highest month Dow posted since it bounced 23% in a straight line, crushing every other index by a mile during our "bear market."
December was higher.
Geopolitical Risks
As I warn in every post, the situation in China is really a lot more dire than you're being told. The Chinese Communist Party would have the world believe that Wuhan Pneumonia all but totally went away after Xi Jinping finally dropped his "Zero COVID" LARP and stopped welding people in their apartment buildings and making people take daily nucleic acid swabs in the park if they want to have access to public transit go to work the next day under the Party's social credit system.
But nothing could be further from the truth. Just go use a data aggregator like Our World in Data and compare cumulative case counts and death counts reported by China and any other major country in the world and ask yourself how the epicenter of the pandemic, the place where Patient Zero emerged, and the world's (formerly) largest country, could have an exponent less worth of COVID problems than even the countries who emulated the Communist Party's Zero COVID social credit system like Australia and New Zealand.
My point with the above is to say that the CCP is weak and is about to fall. But at the same time there is a faction of globalists in this world who want to install a one world government.
Think about it carefully, everyone: Can you have a "one world government" without the world's largest and most ancient country - China? Thus, if the one world government was to be installed while the CCP was still around, would it work? It would only work if they made the CCP the center of the New World Order. But why would they do that? Don't the globalists want to be the center of the NWO, the Kings of the World, the "New Gods"?
Thus, it's a quandary. And so as the CCP falls, it's very likely that the globalist factions will move to install the NWO and every single thing in our life will change.
What I want to point out to you all is this:
What is the actual problem with Communism? Is it a bunch of glasses wearing atheists with beards running around doing the Marxist cuckold fist and carrying the Flag of Blood while screaming "Viva la Revolution"?
The fundamental nature of communism and the ultimate goal of communism is to create a two class system.
One class will be the Party, specifically its elites, who rule. They eat the beef and drive the V8 S550s and live in the mansions and have air conditioning and go to the lake and the mountains.
The second class will be everyone else, which includes you, who will live in the pod, eat the bugs, live in the open air prison "15-minute cities," take the bus, ride the bike, rent the Nissan Leaf, and experience "beauty" and "nature" only on Zuckerberg's Metaverse.
It's as simple as that. You decide what kind of future you want. If you want to live like a human being, then show you're still "humane" and get rid of the Party and all its Marxist Leninist garbage, cultivate virtue, and take care of your family and your country.
The Call
The weekly bars show you a lot:
Namely, we've had three weeks of pinbars. Volatility has contracted and this pattern pretty much always predicates a big move. So, what direction is the big move coming?
If the ATH is only 7% away, then it seems to me that's a pretty likely target. But after three weeks of ranging in a 1,000 point range and this being the 15th week of sideways since the huge move, how many institutions and funds have gone long with stops below the most recent pivot?
A lot. If you were the market maker, wouldn't it make sense to liquidate them before running 12% higher and setting a new all time high? It would. It certainly would.
And the price action is set up just like this. The December low is the most recent weekly pivot and is a meager 1,200 points (4%~) under where we are, during a short week, that ends the month of February.
Moreover, there's a big liquidity gap between 30,000 and 32,000 that has never been touched since the post-October monster bounce.
The bearish impulse is over, but you're about to get a bear trap. The people who keep listening to Discord signal groups and charlatan furus, the mainstream media, Zerohedge, FinTwitt, all think it's time for us to trade to zero because FEDERAL RESERVE RATE HIKES and, like... more or less just because the Federal Reserve isn't done hiking the rates yet.
So, look to get long in the 30,000 range on the Dow, with a target over the ATH. 20% on the DIA ETF, which does not have Zero Day to Expiry options and whose options have lower implied volatility than SPY and QQQ, will serve you very well over the next two or three months.
Most importantly, don't take my word for anything. Not the call, not China, not anything. What you need to do is just think about it. Calm down. Be cold. Be sober. And really, really think about what's going on in this world, and decide for yourself what to do.
Until next time, stay safe. Earth and humans were not created to live as slaves to the Red Cult. They were created by the Divine, and it's as simple as that.

Learn to STRATEGICALLY take SOME profits $DIA exampleInvestments tend to fall in value FASTER than increase
(even in bull markets)
IMO always take profits STRATEGICALLY
This works for ALL investments that have tried it on including, but not limited to Crypto, , Commodities, Bond Yields, and Currencies
AVG
1-2 = 3 weeks
2-3 = WEEK!
3-4 = Almost month
4-5 = WEEK!
5-6 = 3 weeks
6-7 = WEEK!
Example $DIA
Use Resistance & Support levels to help with #INVESTING

$DJI risk reward good here, $NDX not so hot, $BTC 2 channels$DJI What do you see?
IMO RISK REWARD entry point good here if we close above the dotted line
$NDX doesn't look as good
More POVs for $BTC
#BTC Up & Sideways Channels = both good 4 bulls
#crypto

$QQQ holding the 20D SMA $QQQ, $SPY, $DIA have all put in runs of ~20% from th e lows. Time for a healthy consolidation/pullback. $SPY & $DOW have lost the 20D SMA. $QQQ holding on making a higher low on the pullback. When $QQQ loses the 20, we have seen drawdowns of ~10% to 20% since the start of 2022.
