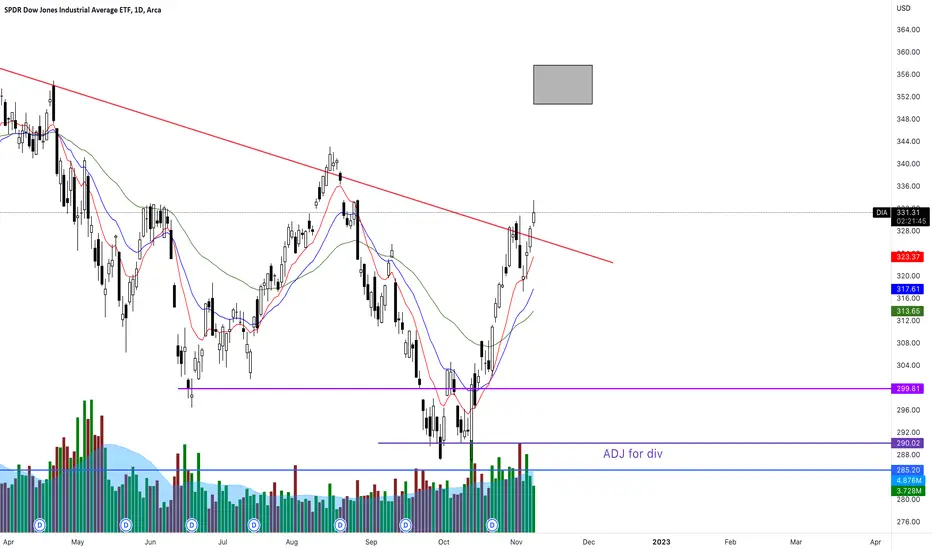
$DJI leading the pack & Bear close to be done🚨🚨🚨🚨🚨🚨🚨
Not sure how this was missed!😱
$DJI looks VERY VERY VERY good
Went FULL BULL late Sept/early Oct
Mid Nov went neutral to short term bear
Mid December turned cautious bull
NOW
GOOD signs that September was BOTTOM!
-
This is daily & weekly
Inverse head & shoulder pattern = 1 of the best bottom forming patterns
IF right shoulder forms here = HUGE
We've spoken on light blue box area many times
Weekly $DJIA still looks GREAT
-
BONUS
$DJI monthly almost gave up BUT HELD
Did trade below the avg's but fought back
NO Bearish moving avg crossover
$DJIA movement can buy more time
Maybe year or 2
RSI looks ok
$DIA $UDOW $SDOW #stocks
DIA

Levels of the Week (Week 1) by DowhausPrice movements in Week 1 confirmed two levels for future references: 33498 and 32990.
Both levels are below closing price of Week 1.

Continued Sell Off…??High inflation, terrible earning, world climate and trend analysis are panning out for a sell off.

CAT - 9 lives, 1 left CAT sitting on the front steps of a very dangerous channel where historically we have seen blowoff tops and waterfall selling anytime we're here....
.... Complacency?

S&P trend lines to watch in the new yearAnother big picture view like my idea on the NASDAQ. Right now, it looks like on the monthly that the S&P has been testing the the purple trend line, but no success. From the looks of it, there is still a good size drop to come down to at least the bottom of the blue channel ($350) to test previous low, maybe even the center line of the purple channel around $325. Let's hope that holds, because if the dot com crash or the financial crisis repeat, then we could still fall all the way down to $240 range.
Weekly with 20 and 200 SMA
Daily with 20 and 200 SMA

DIA bear call spreadDecember week 1 350 / 355 bear call spread for .65 limit credit.
IF we trade sideways OR roll over, this will be a nice location
US10Y 🇺🇸 U.S. 10-Year Interest Rate History (1913 - 2022) One of the biggest "shocks" in the 22' financial markets is the breaking of the long-term (weekly) trend in Interest Rates — specifically the U.S. 10-Year Treasury (US10Y), which has gone through now two long-term trend cycles since it’s history dating back to 1913.
Given the inflation fight that the Federal Reserve is currently waging, while at the same time keeping in mind the structural debt-load that the U.S. 🇺🇸 is current burdened with, this begs the question can rates actually go higher from here?
While we do not know the answer as to the actual trajectory of interest rates into 23’ and beyond — what we do know is that given the structural debt load, we can speculate that at some point rates will likely be forced lower as a proxy of stabilizing inflation and also total debt servicing obligations of the U.S. Government.
Also keep in mind comments by J. Powell and the Federal Reserve as they have been preparing investors for a new macro regime of “higher for longer” .
Should this actually play out and not just be the "hawkish tone" of the Federal Reserve that is helping to push interest rates higher, investors must consider the ramifications that could come IF we have truly entered a new (rising) interest rate regime that includes structurally higher rates as part of the next 40+ year historical cycles.
Here is the same chart of the (US10Y) paired against the backdrop of other macro indicators including Federal Reserve Balance Sheet, as they give us insight as to both the bull and bear thesis for yields moving forward:
U.S. 10-Year (US10Y) vs. Fed Funds Rate (FEDFUNDS) 📊
U.S. 10-Year (US10Y) vs. U.S. Inflation Rate YoY (USIRYY) 📊
U.S. 10-Year (US10Y) vs. U.S. Federal Debt Total Public (GFDEBTN) 📊
U.S. 10-Year (US10Y) vs. U.S. Federal Reserve Central Bank Balance Sheet (USCBBS) 📊
U.S. 10-Year (US10Y) vs. U.S. Liabilities & Capital (WRESBAL) 📊
U.S. 10-Year (US10Y) vs. S&P 500 (SPX, SPY) 📊
U.S. 10-Year (US10Y) vs. Dow Jones Industrial Average (DJIA, DIA) 📊
What is your take on the forward trajectory of interest rates?
Have we officially broken the 40+ year downtrend on structurally low interest rates, given the potential for entrenched inflationary pressures within the U.S. economy?
Or, will rates be forced lower as structural debt obligations of the U.S. are far too great to support the notion of "higher yields for longer"?
Let us know your thoughts in the comments below! 👇🏼

2022 Yearly Recap - SPY QQQ DIA IWM DXY US02Y EFFR USIRYY Looking back over the last year (22'), as the saying goes "hindsight is 20-20".
That said, here's the recap on the 22' market cycle against the backdrop of the Federal Reserve Interest Rate Hiking Cycle (one of the fastest on record) — while at the same time, we (investors) are all asking "What's next for 23'?"
TOP SECTION
DXY - Dollar Index ($104.51) 🔼 ✅ (Green Line)
US02Y - U.S. 2yr Treasury (4.38%) 🔼 ✅ (Black Line)
US10Y - U.S. 10yr Treasury (3.84%) 🔼 ✅ (Blue Line)
EFFR - Effective Federal Funds Rate (4.33%) 🔼 ✅ (Orange Line)
USIRYY - U.S. YoY Inflation Rate, Federal Reserve Target Rate = 2% (7.10%) 🔼 ✅ (Baseline = 2%, Red = Above Target, Green = Below Target)
BOTTOM SECTION
SPY - S&P 500 SPX ES1! (YTD 22', -19.92%) 🔽 🩸
QQQ - Nasdaq NQ (YTD 22', -33.95%) 🔽 🩸
DIA - Dow Jones Industrial Average DJIA (YTD 22': -8.77%) 🔽 🩸
IWM - Russell 2000 RUT (YTD 22': -22.57%)🔽 🩸
Prediction(s) these asset classes for 23'? Let me know your macro trade(s) in the comments below! 👇🏼
All Asset Class Chart Template 📊👇🏼
www.tradingview.com
Index Chart Template w/ YTD Return Indicator 📊👇🏼
www.tradingview.com

Vertical Option Spreads for a bear market- a handy tool to haveEducational purposes only: if the bear market continues, one tool Im keeping available is bear vertical spreads. I dont want to go straight short the market, and buying high valuation is a no for me. So bear call spread might be worth a shot while waiting for bullish opportunities.

Warning VIX model is now set up to SOAR My work posted a few days back call for a drop to below 20 .Today we saw this and I was 85 % plus net long goint into this morning in trow spy qqq smh aapl and calls I HAVE SOLD EVERYTHING net gain 3.5 to 4.6 % I am now back to 100 % cash the net gain for 2022 is now back above 64.2 % . I stated this rally would be very strong into jan 3/10 2023 see 1973 chart dec 15 . The issue is now that the VIX did not get up to mid 24 /27 as I had hoped . So what is next well we had 4 days below the bb bands which on odds rallies min back into it and we saw that today . I do NOT like the pattern in the vix see the arrows and this formation the last 4/5 times the VIX SOARED > I am flat and I will not short . I am NOT SURE with this setup I must PROTECT GAINS as everyone else takes losses of min 20 % see forecast dec 2021 model min drop 20% for 2022 well 2023 I think we will see another 16.8 to 21 % drop I am working on the cycles as well as the SPIRALS . best of trades WAVETIMER

Another intraday call $DJIDon't post a lot here, limited by # of charts and postings.
There we go $DJI
Chilling though, not trading, today is bday
Just researching
Prepared/Preparing for 2023
$UDOW was under $55 when pointed out
#DJIA $DIA

40 Bar Cycle Chart - Dow Jones DIA DJIA - Updated 121722This last week, markets initially rallied on the release of the "cooler" than expected November CPI (Consumer Price Index) — only to be smacked back to reality on the comments via Federal Reserve Chairman J. Powell during the December Interest Rate Decision (FOMC) meeting this last Wednesday as "higher for longer" is the communicated pathway forward for the FED and financial markets.
Whether this is all talk to put some intentional downward pressure on markets, as financial conditions have eased as of late — or this is the actual pathway forward and the bond markets are mis-pricing the projected Terminal FFR (Fed Funds Rate, now >5% into 23'), some indicators such as our (40-Bar Cycle Chart) 📉 are highlighting what is likely another leg down in financial assets as QT ramps up and higher interest rates take their toll on real economic activity. Keep in mind that behind the scenes, the FED in coordination with the U.S. Treasury are working their magic 🧙🏼♂️🔮 in terms of FED Net Liquidity to keep things "(dis)orderly".
Here is the updated 40-Bar Cycle Chart for DIA DJIA, which seems to be sitting on some major support. Given the structure of the markets after losing the $330 DIA / $33,000 DJIA, along with J. Powell and other FED speaker comments post-FOMC on Friday, is the hopes for a year-end 🎅 🎄 rally wishful thinking?
DIA Daily Chart Template
www.tradingview.com
Which camp are you in on the short-term (end of year into Q1/23') direction of markets?
Camp A: We are likely we headed for new lows in Q1/23 (Fluctuating Inflation + Persistent Price/Wage Pressures + Hawkish FED).
Camp B: We are likely to break the downtrend into the start of Q1/23' (Peak Inflation + Deflationary Forces + Dovish FED).
Let me know your prediction in the comments below! 👇🏼

$DOCN looks like it's heading back to support level at $30~$DOCN looks like it's heading back to support level at $30~ .. full path on chart
Btw.. I have made a fortune from this name last year.. i called it when it was $40~ and it went all the way up to $110

From "Hovercraft" to IHS pattern? WAY EARLY but interesting 2cDo you see it? $DJI
Is it easier to see on weekly?
The "Hovercraft" patter COULD be a precursor to an Inverted Head & Shoulder!
See it now?
IT'S WAAAY early & it doesn't mean it'll happen
$ETH had one recently & went kaput
Can $DJI #BEAR be ending? Time will tell
IMO chances are NOT for
BUT
As stated MANY TIMES #markets are NOT logical
What about $NDX $SPX & $RUT?
Short answers
no, bleh & actually looks like head & shoulder recently lol

$DJI forms Outside Week (DAY)Had no plan for trades 2day barring huge opportunity, which not seeing
BUT like $META action in "bear" market
Did say keep this in mind
BUT THIS IS NOT THREAD FOR @facebook
It's for $DJI and its cronies #DJIA $DIA $UDOW $SDOW
WE HAVE HUGE MOVE in place with more to follow
Being this is WEEKLY the paint = more important
31.7k is 50% retracement but IMO we're likely retesting 30k next year, just don't see bloodbath ending year
Another post which may or may not post here later
AFAIK no such thing as HOVER pattern🤣
Me having FUN
BUT
could be precursor to one! IHS patter is hint

short call spreads working in dow index DIA on mean reversionIts not a good sign when the dow is getting bid up more than the growth sectors. Could be implying investors and institutions DIA who have to buy stocks are preferring blue chip dividend payers because they dont see growth in the near term. QQQ AAPL

40 Bar Cycle Chart - Dow Jones DIA DJIA - Updated 121022Given that we are headed into the release of the November Consumer Price Index this upcoming (Tuesday, December 13th) and also the December Federal Reserve Interest Rate Decision (Wednesday, December 14th) , are markets set up for another short opportunity into the end of January (Q1)?
DIA DJIA Daily Chart Template
www.tradingview.com
Which camp are you in on the short-term (end of year into Q1/23') direction of markets?
Camp A: We are likely we headed for new lows in Q1/23 (Fluctuating Inflation + Persistent Price/Wage Pressures + Hawkish FED).
Camp B: We are likely to break the downtrend into the start of Q1/23' (Peak Inflation + Deflationary Forces + Dovish FED).
Let me know your prediction in the comments below!

selling call option spreads until the stock market gets cheaperstock market is pricing in close to 20 PE currently which is roughly a 5% earnings yield, while bonds are paying close to that. next years expectations are still that we see a rise of as much as 10% higher earnings. If we instead slow down earnings growth, the market may be too expensive. SPX SPY IWF QQQ DIA

DIAUSDTMy current view on DIAUSDT.
DIA (Decentralised Information Asset) is the governance token of an open-source oracle platform that enables market actors to source, supply and share trustable data. DIA aims to be an ecosystem for open financial data in a financial smart contract ecosystem, to bring together data analysts, data providers and data users. In general, DIA provides a reliable and verifiable bridge between off-chain data from various sources and on-chain smart contracts that can be used to build a variety of financial DApps.

SHORT | DIA | YM! | Swing TradeCBOT_MINI:YM1!
Possible Scenario SHORT
Evidence: Price Action
TP1: 34273
TP2: 34155
Timeframe: this weekend ( ending 10 Dec)
*could be happen 5th Dec 2022

DIA Dow Jones Outlook For 2023Throwing a textbook at the charts it becomes clear at what is happening.
This is DIA Dow Jones ETF:
- A Clear double bottom formed that pushed DIA to recent resistance - yellow line
- Another rising wedge is forming which we will see correction, small correction.
- After small correction we will retest Resistance line again.
- AFTER the above we will form a DOUBLE TOP which we can retest resistance.
ALSO note the fibonacci levels at 0.618 we will have to close the gap at the green arrow.

Dow Jones Weekly Volatility Analysis 5-9 Dec 2022 Dow Jones Weekly Volatility Analysis 5-9 Dec 2022
We can see that currently the implied volatility for this week is around 2.82%, down from 3.06% last week according to VXD data
With this in mind, currently from ATR point of view we are located in the 7th percentile, while according to VXD, we are on 8th percentile.
Based on this, we can expect that the current weekly candles ( from open to close ) are going to between:
Bullish: 2.6% movement
Bearish: 1.9% movement
At the same time, with this data, we can make a top/bot channel which is going to contain inside the movement of this asset,
meaning that there is a 19.5% that our close of the weekly candle of this asset is going to be either above/below the next channel:
TOP: 35473
BOT: 33370
Taking into consideration the previous weekly high/low, currently for this candle there is :
79% probability we are going to touch previous high of 34750
21% probability we are going to touch previous low of 33370
Lastly, from the technical analysis point of view, currently from
Weekly timeframe indicates 77% BULLISH trend
Daily timeframe indicates 80% BULLISH trend
4H timeframe indicates 53.3% BULLISH trend

$DJI @ Support - Showing RSI weakness - Likely trade sidewaysDaily
Maybe call this the HOVERCRAFT Pattern
$DJI @ Red EMA support, bouncing
4Hr
Bullflag pattern ok, within range
Hr
BEARFLAG trade done
ALERT
RSI beginning showing neg divergence
(Couldn't post the flags as reached limit day before)
#stocks #DJI #DJIA
