$BA Been Basing About 1 Year – Ready to Break-out?I am already long NYSE:BA since earnings report on April 23 with a full size position. I am looking for this to form a short flat base to allow the 10 (purple) and twenty ema (blue) to catch up. I will be looking to add to my position if that happens and it resumes the uptrend. Since it bottomed out on April 7th it has made about a 45% move. That is why I think my scenario may play out. All TBD.
DIA

$RDDT Earnings Beat 30% / Earnings Growth 101.6%I have taken a position in NYSE:RDDT at $120.50 and I will put my stop on a definitive close under the 21 EMA (blue). At the current price that would be about an 8% stop. (Sometimes I take positions off before they hit my stop loss if it is not acting well.)
I am looking for this to retake its prior leadership but it may not. From ATH to lowest low was a 65% drop. It has gained about 26% of that back.
If you like this idea, please make it your own trade that fits with your trading rules.
Reddit Beat Expectations
Thursday, May 1, 2025 at 4:06 PM ET
Reddit (RDDT) reported earnings of $0.13 per share on revenue of $392.36 million for the first quarter ended March 2025. The consensus earnings estimate was $0.02 per share on revenue of $373.33 million. The Earnings Whisper number was $0.10 per share. The company beat expectations by 30.00% while revenue grew 61.49% on a year-over-year basis.
The company said it expects second quarter revenue of $410.0 million to $430.0 million. The current consensus revenue estimate is $399.36 million for the quarter ending June 30, 2025.
Reddit is a community of communities built on shared interests, passion, and trust and is home to the most open and authentic conversations on the internet.

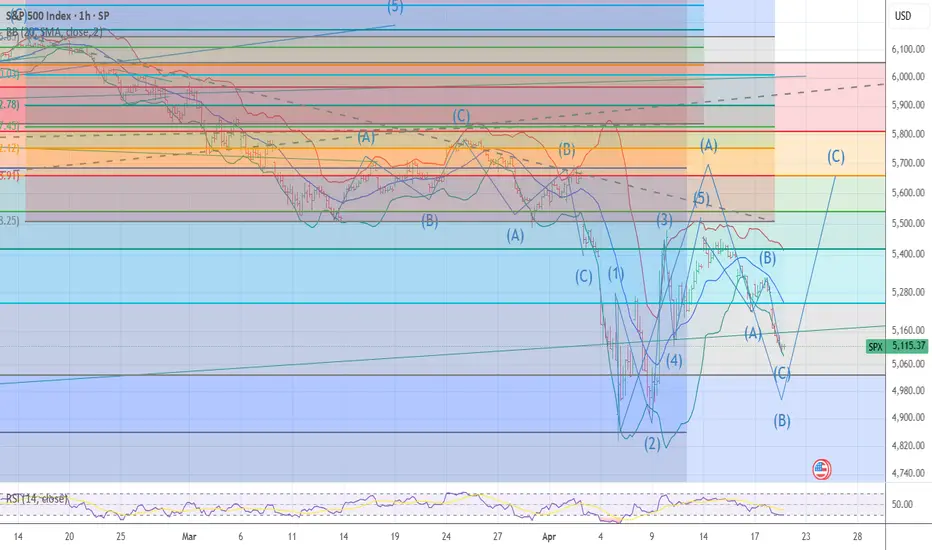
Today is oct 14th 1929 I have moved back to Long puts at 105%The chart posted was in the forecast written dec 8th 2024 We have now reached my targets of 5669 area I have been buying the dips in calls and made $ I am now 105 % long in the money puts and I do Not see a bottom until july once we break and a second bottom mid oct The market should see a drop of 38 % into july and form a small double bottom in oct at 41 % off the highs . I will move to 125 % long puts on a sell stop at 5300 even the math at 5334 is key Best of trades WAVETIMER

The Dow Jones breaks out of a Symmetrical Triangle patternThe Dow Jones TVC:DJI is breaking out today.
RSI is looking better.
However, the buy volume is weak.
Looking at the money flow reveals this.

I am CALLING A BOTTOM TODAY I MOVED95% long 5109/5079 today The chart posted is the sp 500 I called for a sharp decline back to 5100 it has formed a ABC down I look for a sharp rally back to 5644/5669 Now before the next leg down today is wave Blow ,Best of trades WAVETIMER
A Broader Market Review...As we have all seen within the last month or so, the U.S. equity markets have been getting the worst ass whooping since 2020. And as much as we'd like to forget that absolute disaster, it does bring to thought the idea of buying general market funds (such as AMEX:SPY , NASDAQ:QQQ , or AMEX:DIA ) to gain a nice entry into the next bull market, whenever that may be. However, not everything is all smooth sailing. The unfortunate part of this market downturn is that no amount of technical astrology fortune-telling analysis could have predicted the market's reaction to the tariffs being levied on foreign nations. So we need to put our big-boy pants on and look at the market as if it isn't some automatic wealth generating pattern that points north-east all day long.
Let's start with the tariffs. Firstly, we know there has been a 90 day pause on all conforming countries most notably leaving out China. It's not like that's anything special, just almost all our crap is made there. Unfortunately, we are observing what may be the greatest economic error of our lifetimes.
For those who are lost, foreign governments DO NOT pay for the tariffs in the way we are told. The U.S. Government levies the tariffs on the exporter (Chinese companies in this case), who then pass it on to the buyer of the goods (think Walmart, Target, Apple, etc.), who then pass those charges onto YOU... Enjoy!
So with an attempt at a full blown trade war, which the U.S. cannot win nor even has the industrial strength or infrastructure to compete, we can expect the markets to completely do a Bald Eagle courtship nosedive into new lows as observed a few weeks ago. But what will the Creature from Jekyll Island think of this?
Well miraculously, Fed chairman Jerome Powell claimed that the Fed will NOT allow the tariffs to exacerbate inflation into new highs. Get that, the Federal Reserve will not allow economic movements that raise prices on an importing nation ( that's the United States by the way), to raise prices anymore. While he's at it, how about we just get no inflation ever since it's just that simple?
And as if that wasn't enough, Donald Trump called for Jerome Powell to lower rates for some reason, saying that Powell was too late on his economic movement at the Fed. As it turns out, our plan for strengthening the economy is to.... weaken the dollar? Not sure why that's the case but at least we will be able to borrow more money at a cheaper price, as if the United States doesn't already have a debt problem. The Fed lowering rates would of course open the possibility of getting yet another wave of quantitative easing which will most likely be observed further down the road. Another round of QE, along with rate cuts, will of course send the equity markets to new highs on top of a weaker dollar.
Speaking of a weaker dollar, we should lastly talk about the TVC:DXY which measures the comparative strength of the U.S. Dollar to other currencies. As it turns out in this scenario, the dollar is getting weaker and weaker every day, meaning that people are running from U.S. Debt like it's the plague. If we were going to get a weaker dollar, at least could we have a higher market to offset our inevitable losses? I guess not...
Here is the TVC:DXY 1D looking back into late 2024.
Lastly for what to expect out of the market. If the trade situation will all the tariffs and this neo-cold war cool down, we might see some tariff pauses or lowering which will of course fire the market into new highs. However, if the situation doesn't cool, our debt yields rise, the market is going to go south faster than a Canadian in December. On a positive note, macroeconomic events move slowly, so it should be clear when a turnaround is coming...

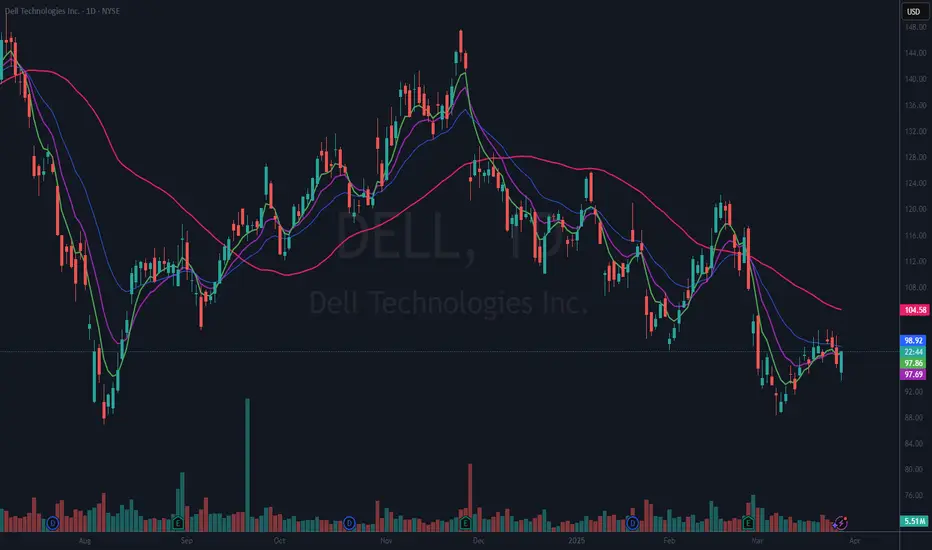
$DELL Ready for a Dumpster Dive?NYSE:DELL I got long on this one Feb 14th and I was stopped out just a few days later. I am looking at it again because they are a big supplier for AI hardware needs, and I think they are over sold. (Just because I think that does not make it so.)
Here is what I am looking at. Today’s candle is a clear rejection of heading lower (at least for today). If we can get a follow through candle tomorrow, I will look to take this long with a clearly defined risk just below today’s candle. Which if it follows through would be a nice higher low.
If you like this idea, please make it your own and make sure it fits your trading plan.
$DE Breaking Out of Flat Base?I went long NYSE:DE on Mar 5th after it bounced right back over the 50 DMA (red). It had been choppy, so I waited to add to the position until today. Why today? If you look you can see the pattern of the candles kept getting tighter and consolidating around the shorter term EMAs. I had drawn in what felt to me to be a resemblance of a flat base pattern. It broke above that with conviction this morning, so I have added to bring up to a full-size position.
My stop on the added portion will be just below the LOD and the remaining stop has been moved up to the most recent higher low.
If you like this idea, please make sure it fits with your trading plan. These are simply my ideas.

RSP and WHY I AM BULLISH STILL197/199 target The chart posted is the sp 500 equal weighted RSP has dropped to a trend line dated back to march 23 2020 . I have three clean points and all are major . Elliot Wave calls for a final 5th wave to end this advance in the area of 198 plus or minus 1.25 Fib relationship and PUT /CALL as well as most of my spiral and cycles point to the final advance to a Bull market top is now setup . BULL MARKETS TOP ON GOOD NEWS > Best of trades WAVETIMER

Bearish & Boring? Maybe. Profitable? Definitely.Bearish & Boring? Maybe. Profitable? Definitely. | SPX Market Analysis 12 Mar 2025
You know that feeling when you wake up and wonder if you’re stuck in a time loop? Yeah, me too.
For what feels like the hundredth time, I’m reporting that the bear move is grinding lower. The difference? The profits keep stacking up—so I’m not complaining.
Yesterday’s rally was supposedly triggered by Canada pausing tariffs, but let’s be real—this market is looking for any excuse to bounce. Yet, the overall trend remains the same: a slow, stair-stepping drop. Based on this drop-pause-drop rhythm, I suspect we’re entering the next pause before another leg down.
My bear boots are full, my trade allocations are set, and I’m waiting for two tranches to exit profitably before considering any new plays. Until SPX clears 5850, the bullish setups stay on the shelf.
This is the good kind of waiting—the kind where the market moves for me instead of me chasing it.
---
Deeper Dive Analysis:
If it feels like Groundhog Day, you’re not alone. The bearish grind continues, slowly pushing lower, delivering small but steady wins. Unlike a panic-driven crash, this move is unfolding in slow motion, keeping traders on edge, wondering if a rally is lurking around the corner.
📌 A Market Looking for an Excuse to Bounce
Yesterday’s rally attempt was supposedly fueled by news that Canadian tariffs were being paused, but let’s be honest—this market is desperate for any reason to move higher. The reality? The larger bearish structure remains intact.
Every bounce so far has been short-lived.
The market keeps following a drop-pause-drop pattern.
We’re likely entering the next "pause" phase before another move down.
📌 My Trading Approach—Locked, Loaded, and Waiting
Right now, my bear boots are full, meaning I’m not adding new positions until my current tranches exit profitably.
Two tranches are set to exit with profits by the end of the week.
If we push lower or continue sideways, I’ll take my exits and reassess.
Until SPX clears 5850, I won’t even think about bullish setups.
📌 What’s Next? The Good Kind of Waiting
There’s no need to chase trades or force new entries. I’m simply letting my plan play out. If the market continues its slow-motion decline, I’ll collect my wins, reload selectively, and wait for the next prime setup.
For now, I sit back and enjoy the show—because this time, the market is working for me, not against me.
---
Fun Fact
📢 Did you know? In 2008, Porsche trapped hedge funds in one of the greatest short squeezes in history, briefly making it the most valuable company in the world—all thanks to a secretive stock manoeuvre.
💡 The Lesson? Markets don’t just move up and down—they can also turn traders inside out. The wrong bet at the wrong time can be devastating… unless, of course, you have a system that keeps you on the right side of the trade. 🚀

+405% day from $0.35 to $1.77 for $PSTV WOW 🔥 +405% from $0.35 to $1.75 NASDAQ:PSTV 🚀 What market sell off 🤷🏻♂️ we don't know anything about that, our strategy is getting us paid no matter the overall market circumstances 💪 It's been like this for over a decade
P.S. AMEX:SPY is at 200 moving average, if it cracks below it we could see NASDAQ:TSLA NASDAQ:NVDA NASDAQ:AMZN NASDAQ:GOOG NASDAQ:META and many others go way lower.

$QQQ Support and Resistance Areas?QQQ had a big bearish candle on Friday. If you look left on the chart there were 2 comparable recent days. On Dec 18, 2024, and Jan 7, 2025, both lead to further downside. On Dec 18, the decline before a rally was about 5.3% and the Jan 7 decline was around 4.9%. Friday’s decline was about 2.4%. “If” those declines are any guide, we could expect another 2.5% to 3% additional deterioration. Which portends a pullback to around 512 to 510. Think of those as areas of concern, not a prediction. I have also drawn in horizontal lines that “may” become areas of support or resistance. In addition, we are touching an area of upward sloping line (area) that has defined a series of higher lows over the last 4 weeks.
In summary, it is a good idea to have an open mind about any outcome over the next few days to weeks and simply look at these areas to see if they do indeed end up being turning points.
One more point, this is an index fund and as such looks at heavily weighted stocks. We are likely in a period of picking individual stocks that are leading and using this index simply as a guide to overall market health.
I hope that helps.

$XBI Starting New Bullish Trend?AMEX:XBI has been range bound (wide range) for a year. Recently it has been in a downtrend as defined by lower highs and lower lows. However, it looks like we now have a recent higher high and (maybe) a higher low. There are still technical challenges like it is under all moving averages. It would look much better once it gets above the shorter-term MAs which are all declining. The MACD is on a slight downward slope as well.
Having pointed all that out, I will be looking at a lower time period chart to get an early entry with a tight stop. If I do take a trade on this, I will post the chart I am looking at. All TBD.
This is my idea, if you like it, please make the trade your own and follow your own trading rules.

$BA Getting Ready to Resume the Uptrend?Boeing had formed a cup with handle formation that it “tried” to breakout from at earnings. That breakout failed but not by much. It broke out again on February 6th and has since been forming what looks like a bull flag.
I had an alert set on the horizontal line of resistance (breakout area) and I took a long position with a stop just below today’s low. To confirm the continuation of the uptrend, it needs to break above the bull flag. If it does that I will look to add to my position.
This is my idea of how I look to make trades. If you like it, please make it your own trade, and follow “your” trading rules.

$QQQ Wedging on the 65 Minute Chart (VCP)NASDAQ:QQQ is clearly in a wedging pattern. These types of patterns “usually” resolve in the direction of the larger trend. In this case that trend is still up.
This is a news driven market now so anything can happen. I have an alert set at both the top and bottom of the wedge lines. I do not plan to short this market, but should it break down, I may want to reduce my exposure. And if it breaks to the upside, I may add more exposure.
I am giving my observation of the market. Nothing more.

2/03/2025 Weekly Analysis + WatchlistSPY - Failed 2U week after going outside month the week before. Not super shocking, but now we sit in an interesting spot. The new month will open inside bar and has to either take out previous month highs (Which is ATH) or Jan Lows. Seeing that the range is pretty wide for downside, It will take less effort to make new ATH. Not that it means a whole lot, but that is something to note. Next, we see the week closed failed 2D, but is pretty much slapped right in the middle of last weeks range, so it will take an equal amount of effort to make a HH or LL. Finally, from a daily perspective we have a large failed 2U with slight PMG to the downside. We are definitely primed for a sharp corrective move Monday, but of course anything can happen, we are just much closer to seeing the bear scenario than bull. In my mind, the ideal weekly scenario is this: Monday sees sharp corrective move, taking out the PMG guys, then the rest of the week climbs, triggering the weekly 2-2 Rev, which then ideally sends us into ATH once more before seeing either BF expansion on the Month (since we would go 3-2U.), or seeing us start to come back through last months range for a larger corrective move. In the pure bear scenario, we trigger the daily reversal, head down to weekly 2-2 cont. trigger, then see if we can make progress down back through a few daily gaps, ultimately targeting prev month low for the 3-2D M. Given that we are going into a new monthly open after going 3, we could very easily just chop and go nowhere for the week seeing as we may just remain inside week with the month being inside to start out before possibly seeing control more clearly dictated in the 2nd/3rd week of Feb. Main advice regardless is to trade things that are moving early on like gappers, and anything where the month goes 2U or 2D in the first week. Avoid inside bars if possible and trade light!
Main setups for the week:
Bull:
GE - Inside D and W
ORCL - Hammer W to head back through D gap. Cautious with this one
MRVL - Weekly 2-2U. Daily gap fill to the upside after giant gap down to exhaustion risk
Bear:
BA - Shooter 3-2D weekly. Bear Revstrat daily. Daily BF looks solid.
MSFT - MoMo Shooter M, 3-2D W, Daily 2-1-2D. Check daily BF. Still has magnitude after massive ER drop
VZ - Weekly 2-2D, Daily shooter 2-1-2D, FTFC Red. Check daily BF
Neutral:
RKLB - Inside week. Nuclear Green FTFC and super crazy ATR lately

DJI a FAILED 5th Wave and right shoulder Head n shoulder TOP The chart now can be seen as A 5th wave Failure . as we have entered the 6 spiral window. the last 5 /6 spirals called the TOP to the day major turn 11/29 to 12/5 in the dji it was 11/29 and the MATH was near perfect . Now what ?? the drop in my view was wave 4 of the Supercycle peak . since then cycles turned up and the 5th wave started . based on the 80 day cycle due mid dec . so why am I calling this a Failed 5th wave reason is the last low was one of the longest days down in US history and breaking the long term trendline support The High Hit the trendline at the peak going back to the sept 2nd 1929 high . The fact that the sp 500 is now the only index to print a new record high is a warning . I started to move into puts on friday jan 17th and moved to a 110 % long puts today at 6100 in the spx cash and 533 in the QQQ , The market can still trace out a small 4 nad 5 and 4.5 and the DJI could still print a minor new High but today and this week are a grouping of 6 spirals Golden ratio . the DJI has only rallied to almost .786 the drop 44370 target I started buying puts at 43800. 2025 is a very bearish cycle see my forecast DEC 8th 2024 . Best of trades WAVETIMER

SPY Mid week analysis 1/14/25SPY - Monthly reversal is now being negated as we moved back above the monthly 2-2d trigger at Prev Month Low. We are also now failed 2D coming back through previous week range. The daily went 2-2 rev, but closed failed 2u as we made higher highs, but closed red near mid range of the day. The question for tomorrow is do we continue pushing back through last weeks range to expand the BF created by the 3 from last week, or do we take the failed 2u - 2D reversal, reconfirm the Monthly reversal down as well as the weekly 3-2D. We have a 3-1 setup on the 4HR as well as an inside bar 60 which is what I will be watching going into open tomorrow assuming no gap up or down. Should be an exciting rest of the week as we look to see if bears can reclaim control on the W and M, or if Bulls are setting up for a recovery back to ATH.
Levels to watch: Current 60 inside bar High and Low, Current 4HR bar high and low, Prev month low, 585.96 for upside which is the 2-2U rev target we did not get to today, but may compound 2Us tomorrow to get to if the bull scenario is playing out.

Here's what's happening early premarket $2.28 to $4.88 $STAFStarted with after hours pop right around market close, held support line all the way into after hours close and continued with another pop right at preamarket open to doubled level.

HUGE $1.69 to $9.50 vertical 462% by 10:15am $PHIO🚀 4 Buy Alerts sent out along the way up on NASDAQ:PHIO plus other stocks mentions which had solid moves

"Market Corrections Ahead of the Presidential Inauguration."Corrections are a part of the stock market, signaling moments of weakness and opportunity. Here's a breakdown of the current market decline levels, ranging from the recent 5% pullback to the potential 20% drop that defines a bear market. These are the levels that I will be watching to let me know the momentum of this current shorter term downtrend.
Historical Context:
Over the past 50 years:
5-10% declines occur about 3-4 times per year on average.
10-20% corrections happen roughly every 2-3 years.
Full bear markets (20%+ declines) are rarer but significant, averaging one every 6-8 years.
This chart visualizes the current levels, helping traders and investors understand where we stand in historical context and where the market could potentially head.
Always remember that as hard as some corrections and declines can be, they all create buying opportunities for long term investors.

$DATS and $HOTH largest two gainers of entire stock market todayImagine two +360% vertical stocks 🚀🚀 while rest of the market crashes
Imagine no more, that was reality today!
Today's 2 trades were the hottest two stocks of the entire market
NASDAQ:HOTH and NASDAQ:DATS with buy alerts before they went up 363% and 376% on over $1 Billion USD volume each
Now you know where all the bulls went today 📈
This further proves our strategy is able to generate big wins no matter the market circumstances!
🖐️ 5 Buy Alerts - 5 Wins yesterday
✌️ 2 Buy Alerts - 2 Wins today
Perfect week so far, let's keep it going!

Market bottom called perfectly at $581 $SPY $QQQ $DIA Market bottom called perfectly at $581 🎯 AMEX:SPY NASDAQ:QQQ AMEX:DIA
This was one and only mention too 🎯
