DIA, In a Low Risk Area !DIA is in a strong support area. Buying here has low risk with an excellent risk/reward ratio. RSI in daily has already reached the oversold area ( <30 ) and now we can expect it to start moving ahead to 70. Try to accumulate it with low risk and hold it with patience. Potential support and resistance zones have mentioned on the chart.
DIA

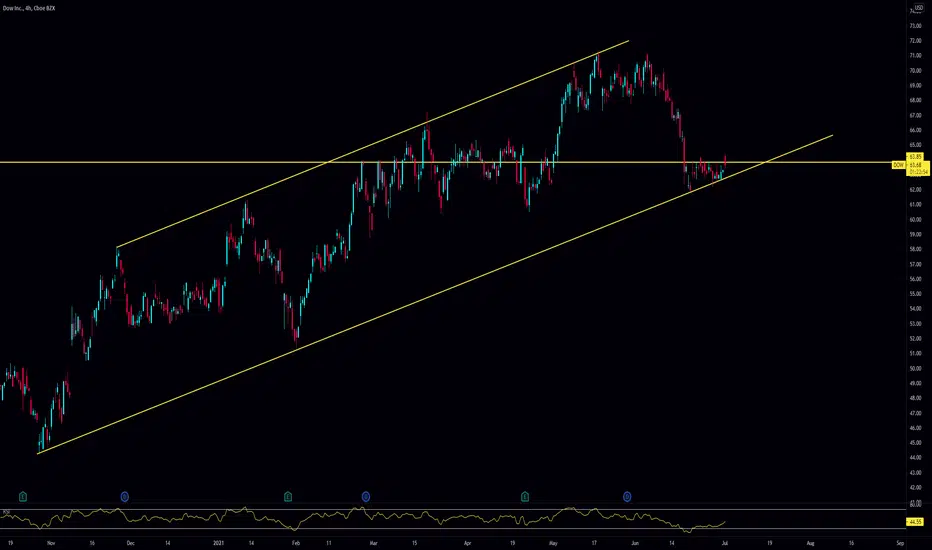
$DOW - Strong Company at Key SupportFairly simple trade again this time round! DOW had an unwarranted drop from the top of it's channel on seemingly no news, and had a healthy bounce at the bottom. This enough wasn't really enough for a trade, as we kept running into resistance around 63.80. Now that we're over it, I'm comfortable loading a position.
I'll be playing 65Cs and 67.5Cs expiring 8/20, though flat out shares are also valid for this play! This is a solid company with strong fundamentals, so even if this play takes longer than expected to pan out, we're still holding a great company which will recover.
All that being said, make sure you don't confuse this ticker for DIA! It's fairly easy to get them mixed up, haha. Godspeed traders.
DIA Long I see opportunity to buy - in short term ..I suppose we bottomed as the indicators are flattened. Depends what will happen at the main resistance channel .
NFA
GL !

US Futures Drift Lower Ahead of Final Day of Q2/H1US Futures are drifting lower on Wednesday morning after the MBA Mortgage Applications Index sank -6.9% and the ADP Employment Change came in at 692k vs the 400k expected. This sets us up for a potentially strong payrolls print on Friday, which at this point may lead to a risk off move on the assumption of tighter monetary policy as a response.
According to ZeroHedge, the S&P has risen a whopping 14% in the first half of the year, it's best performance going back to 1998. Let's hope quarter end rebalancing flows don't ruin the party for everyone. We'll see Chicago PMI at 9:45AM, Pending Home Sales (for May) at 10:00AM, and EIA Crude Oil Inventories at 10:30AM.
As of 9:00AM, the S&P was down -0.7% to 4,279, the Dow was down -0.9% to 34,138, the Nasdaq was down -0.2% to 14,561, and the Russell was down -0.31% to 2,297.
The US10Y yield was slightly lower, down around -0.81% to 1.46%, while the Dollar (DXY) rose marginally by 0.11% to 92.17. Vix rose 4.49% to 16.74, while Gold continued to sink, down -0.31% to 1,758/oz. Bitcoin has resumed it's journey lower after a nice bounce back toward 36k yesterday. We're down -3.8% on the day and trading at 34,543.
Stay tuned for our live analysis at 9:30AM. Cheers, Michael.

US Futures Hover Near ATH's as Banks Crush Stress TestsUS Futures are trading at or near their ATH's ahead of Tuesday's cash open with the S&P flat at 4,281, the Dow up 0.27% to 34,258, the Russell up 0.22% to 2,321, and the Nasdaq down -0.16% to 14,490 as of 8:30AM. The US dollar (DXY) is gaining some ground and is up around 0.30% on the day to 92.16, while the US10Y yield traded around 1.50% after recovering from a light dip yesterday.
Bitcoin is up around 4% on the day to 35,895, while Gold is down -0.70% to $1,768/oz. USOIL is up 0.70% to 73.28, and is on track to grind higher as inflation takes hold. The Vix slipped back to a 15 handle yesterday and is extending losses this morning - we're down around -0.57% and trading at 15.67.
After passing the Fed's stress tests yesterday which showed that banks are firmly above the Fed's caopital minimum's (how could they not be when they're giving the Fed back their capital via the RRP every night), Financials are seeing some notable strength this morning with Morgan Stanley up over 3% in pre-market trade after pledging to double it's dividend. According to Bloomberg, the top six banks have agreed "return" a whopping $142 Billion to shareholders.
Looking at the day ahead, we should see the FHFA Shousing Price Index along with the S&P Case-Shiller Home Price index at 9:00AM, followed by consumer confidence at 10:00AM. I suspect the banks will need to liquidate some capital in order to dole out all this cash to shareholders, so keep an eye out for potentially aggressive quarter end rebalancing flows today and tomorrow.
Our live analysis begins at 9:30AM! Cheers, Michael.

Corn Prices May be About to CrashCorn futures (ZC1!) just came off the highest monthly RSI print since 2008 around an 82 handle. We're likely going to see a vicious correction in the near term. Seems like everything is on the verge of a major correction at this point. I wish the Fed luck...

Markets Flat on Monday as we Approach the End of Q2US Futures traded relatively flat on Monday morning, and are sitting near ATH's to start the week. The Dow is down -0.7% to 34,308, the S&P up 0.9% to 4,276, the Nasdaq up 0.32% to 14,384, and the Russell down -0.11% to 2,329.50 as of 9AM. It's insane to me to watch quantitative hedge funds underperforming retail traders, while asset valuations becomes more and more stretched due to mindblowing liquidity from central banks, corporate buy-backs, and persistent and obsessive jawboning of markets by policy makers. It's as though they're allergic to price discovery, or maybe it's just logic?
The Dollar (DXY) is holding steady just under a 92 handle, while the US10Y yield continues to drift lower. We're holding on to 1.50% at the moment but we've been stuck in a persistent downtrend since the end of March. Bitcoin tested a 35k handle in the overnight session but has since slipped back to 34,382 with about 30 minutes to the cash open. I feel for the crypto permabulls who will be left holding an empty bag when this ponzi comes crashing down, but anyone who looks at secular cycles will see that inflation, and as a result, rates, are about to skyrocket. When this market eventually reprices, it's going to be vicious.
Vix is sitting at 16.12 after testing long term trendline support, and looks poised for a major spike in the near term on a way overdue correction across the asset classes. With valuations going essentially parabolic, money managers are starting to worry about the implications of inflation on an already struggling global economy. The central banks are stealing wealth from the working class, and liberal governments all over the globe are cheering on the fiat debasement, while their loyal voters foot the bill, and beg for more. The feeling of cognitive dissonance has to be infecting policy makers minds by now, as they single handedly destroy capitalism. When price means nothing and supply and demand are controlled by policy makers, it's no longer a market, folks.
Let's see how the week shapes up as we approach the final trading days of Q2. Stay tuned for our live analysis starting at 9:30AM. Cheers, Michael.

QQQ Blow off top incoming?I've been seeing tons of posts stating they are short the SPX, DJIA or the NDX. Anyone else see the possibility that there's going to be massive covering that could send this into a blow off top? The SPX trapped a lot of bears.

Vix Approaching Long Term SupportVix (log scale) is extending losses after the existing home sales print this morning - we're now down over 16% on the week after last week's spike to 21, and approaching the long term support trendline (in red). Let's see if markets finally roll over, and Vix becomes the most crowded trade on the street again.

Technical Bounce After Friday's Bullard SpookAfter a rocket-like rally on Monday morning, we're now drifting at the top of the afternoon session, and trading just below the green ascending trendline, but SPY hourly RSI is showing weakness in the rally. No sign of the bears as yet, but I suspect they will want to recapture that 50DMA before the close to keep the downtrend intact. Let's see what happens next...


QQQs overbought conditions forces June SwoonQQQs has been a steadily forming this ascending triangle flag since early February as part of a 3 month corrective wave pattern (4th wave). It wont take long for this pullback to happen (June Swoon). Perhaps as early July we start to see the market bottom here around 325ish then breaking out to complete the cycle. Sometime around early to mid Sept we top out around 400ish then correct hard.
I'm still trying to figure out what can cause such a breakdown in the market. It is extremely likely that a CoVid wave hits the US once again due to the delta variant being strongly felt among young adults. I'm assuming the US will not hit herd immunity of 70% before flu season (October) and cases rise accordingly. More deaths in young adults. Some states shut down again? Who knows? The other is inflation data coming in hotter than expected and FOMC meeting in the end of Sept causes more deterioration in the market and Powell is extremely hawkish pushing the fed to raise rates sooner than expected as early as beginning of 2022 instead of end of 2022. Oof!
If both news data comes to fruition, I could see the QQQs back in the 250s. The fifth wave is complete and my count is wrong and we go back to 2015 highs. I hope only one bad data happens and we go in this long bull run in the markets for the super cycle.

US Futures Drift Near Overnight Lows, Jobless Claims SpikeUS Futures are hovering near yesterday's lows after a shaky start to the overnight session saw us reverse the Powell driven buying spree that started around 2:45PM when he said to take the dot plot with a "pinch of salt." Powell is now essentially saying that the Fed doesn't know what it's doing, so don't really listen to what the members think. I mean, this guy is a complete idiot imo. After rallying to erase essentially all of the afternoon losses, futures tanked shortly after the close, and we tested new session lows, to then drift marginally higher.
As of Thursday morning at 9AM the S&P was trading down -0.31% to 4,200, the Dow was down -0.23% to 33,828, with the Nasdaq down -0.38% to 13,918, and the Russell down -0.32% to 2,302.60. The Vix rose 2.5% to 18.61, while the dollar continued it's spectacular bounce to 91.81, up 0.46%. The US10Y yield also rallied hard after the FOMC minutes - but we're cooling lightly here before the open and sitting at 1.557%.
Gold is crashing and is down over 4% on the day. We're sitting at 1,785 and losing the 100DMA at 1,797. We're back in the descending channel, and looking at further downside as we approach the end of the trading week. Oil continues to rise, and is sitting just below a 72 handle, up 0.39% on the day.
Lastly, we saw jobless claims come in higher than expected moments ago. Initial claims rose to 412k vs the 350k expected, while continuing claims remained flat at 3.518MM (3.517 prior). Needless to say, investors are finally considering the fact that the cost of servicing debt is going to rise soon putting pressure on (debt fueled) asset prices, and in short order (by June 26th), roughly 1.5 million Americans will lose unemployment benefits. In September, apparently another 9 Million or so will lose benefits. Stagflation here we come...
Our live analysis begins at 9:30AM.
* I am/we are currently long HUV, UVXY

Vix Weekly RSI Lowest in Almost 8 Years?The Vix recently caught a bounce off one of the lowest weekly RSI prints since 2013. We've seen support each time the Vix hit a weekly RSI of 41, and so Vix may finally be on the verge of a notable spike soon, which leads me to believe that the Fed may surprise markets today by being more hawkish than expected, or opex (quad-witch) on Friday may be a disaster for risk. Either way, I think the worse could be over for Vix, at least for a brief period of time. Let's see what happens this afternoon when we get the Fed minutes...


QQQ ATHsGoing off my last $NQ1! idea published...near picture perfect and just a few hairs off fresh all time highs...
Obvious resistance again, but the grind up and growth leading for weeks is tilting towards a bullish breakout in a big way IMO. of course it's gonna be choppy, of course there's gonna be huge size on the bid and ask. No telling what could happen when price reaches that point...usually probes through to check it out. I'd expect something similar tomorrow or overnight even.
Good luck, and stay flexible.

WISH Technical Catalysts (gaps)Very nit picky, but 3x unfilled gaps that could in some insane markets (like this one hey!) could end up filling. Lots of resistance levels to test for absolutely no reason at all. Trade is active. Size appropriately!

S&P500/M2 Shows Major Resistance OverheadWe're at a major resistence level here on the S&P when M2 is taken in to consideration, going back to 2002. We're looking at S&P Futures divided by M2, and as you can see, this looks like the end of the road, folks. One thing is certain, whatever happens next for markets is going to be epic...

Futures Rise as Retail Traders Shrug Off Hottest CPI Since 1992Happy Friday folks! Let's get right into it today. US Futures traded relatively flat in the overnight session with the Dow down -0.12% to 34,420, the S&P down -0.11% to 4,233, the Russell up 0.29% to 2,315, and the Nasdaq up 0.07% to 13,969 as of 8:30AM.
Yesterday's PA came as a bit of a surprise to trading desks across the Capital Markets, as the typical reaction to red hot inflation is a more hawkish shift in policy and an increase in the cost of servicing debt, pulling a significant amount of flows away from growth heavy indexes such as the Russell and Nasdaq, leading to more defensive positioning at the very least. However, sans the light selling on the Russell, what we saw was next to no fear at all, or demand for risk protection for that matter. Markets and particularly market signals are completely broken right now it would appear, as Billionaire Stan Druckenmiller rightly pointed out shortly after the red hot data.
The best performing trading strategy over the past year has been buy and hold. So in other words, doing absolutely nothing but remaining as risk on as possible, this entire time, which many, if not most, retail traders have done, has outperformed hedge funds by 10 to 1. In my honest opinion, this is no longer a "market," far less an efficient or free market.
The US10Y yield continued to fall as bond markets bought the Fed narrative of transitory inflation, and almost completely ignored Thursday's highest CPI print since 1992. The Dollar (DXY) rose 0.32% to 90.35 showing potential signs of derisking in growth, while Vix slipped back to a 15 handle, and is sitting at the lowest level since before the March 2020 lockdown crashed markets 35%. Gold is sitting just below 1,900 around 1,890 and is down -0.30% on the day, while Bitcoin (BTCUSD) rose 1.38% to 37,215. Finally, USOIL rose 0.11% to 70.16.
* I am/we are currently long HUV, UVXY

Almost there....After lagging behind the other indices is it the QQQ's turn to break out to a new high? QQQ has obviously been leading (not saying much) as of late. Growth seems to be ready to explode again.
So much short interest up here without a doubt. We have grinded the way up and that's not a bad thing necessarily.
Looking for a bit of a move up overnight/premarket then fade the gap after open. Will be heavily shorted almost surely again in that situation as the gap from weeks ago is still to be closed.
Perfect storm as we hold in the general range of ATH's.
Can good news catalysts rock the coke machine enough to pick a firm direction with some sustainability? The charts will tell us soon.

Resistance for Large Cap - Support for Small CapWhile iShares' Russell 2000 index ETF (IWM) broke new highs and found support on the retest, the large cap benchmarks failed to make new highs, showing resistance instead. Something's gotta give. Since the 10-year broke support (inflation IS temporary) my guess is the large caps will soon follow the small caps higher.
