DIA

AMC BreakoutAMC breakout again here on the hourly time frame. We were up over 20% on the day shortly after the open, and have since cooled notably. These are some of the craziest flows I've seen in a while. This is pure gambling and the company is loving every minute of it. Mean while, insiders are dumping their holdings and taking advantage of the elevated valuations. Smart...

Futures Flat, Investors Brace for Thursday's Inflation DataUS Futures traded relatively flat on Monday morning with the S&P up 0.01% to 4,228.75 (sitting just below the ATH), the Dow up 0.14% to 34,790, the Nasdaq down 0.10% to 13,753, and the Russell down 0.01% to 2,286.40 as of 8AM. The US10Y yield fell back to 1.58%, while the dollar (DXY) traded flat at 90.12. We saw another mini flash crash in Vix this morning (similar to June 1st) around 7AM, which saw Vix test a low of 15.78 before quickly bouncing back to 16.66.
Over the weekend we saw the G7 come to an agreement on a 15% minimum corporate tax rate, which is expected to be rolled out to the G20 soon. Enforcement of the accord is another story, of course. Yesterday Yellen said she isn't concerned about higher inflation or higher rates in the near future, adding that they're "good for the Fed and US society." Clearly she doesn't understand how the market works and what will happen to asset valuations when the cost of debt rises; don't forget - Yellen was the one who said just a few years ago in 2017 that she doesn't think we'll see another financial crisis in our lifetimes. Needless to say, I don't place too much emphasis on anything she, or Powell for that matter, says.
Later on today around 3PM we'll get the consumer credit report for April, which is expected to fall from the prior print of $25.8B to $22B. But, the main event this week is going to be the US consumer price report on Thursday, which based on the recent spike in used car prices, could reveal a shockingly high print, causing panic over the possibility of hyperinflation/stagflation as early as this year. The Fed, of course, will come out and say it's transitory as rapidly and as many times as possible following the print. That we can be certain of, as they're nothing more than a PR firm for Wall Street imo.
Lastly, Bitcoin bulls are cheering on El Salvador President, Nayib Bukele, for advocating for Bitcoin this weekend in Miami at the largest Bitcoin conference to date, as a legal form of tender for the country. However, according to Goldman, 35% of Hedge Funds (25 CIO's from various hedge funds) see Bitcoin as their "least favorite" investment, while Growth was the "most favorite." Bank of America's global fund manager survey revealed that "long Bitcoin" was the most crowded trade on Wall Street (no surprise there). We're currently sitting at $36,651 and up around 2.35% on the day. I see us potentially retesting the 200DMA in the near term, before a continuation of the downtrend toward $20k.

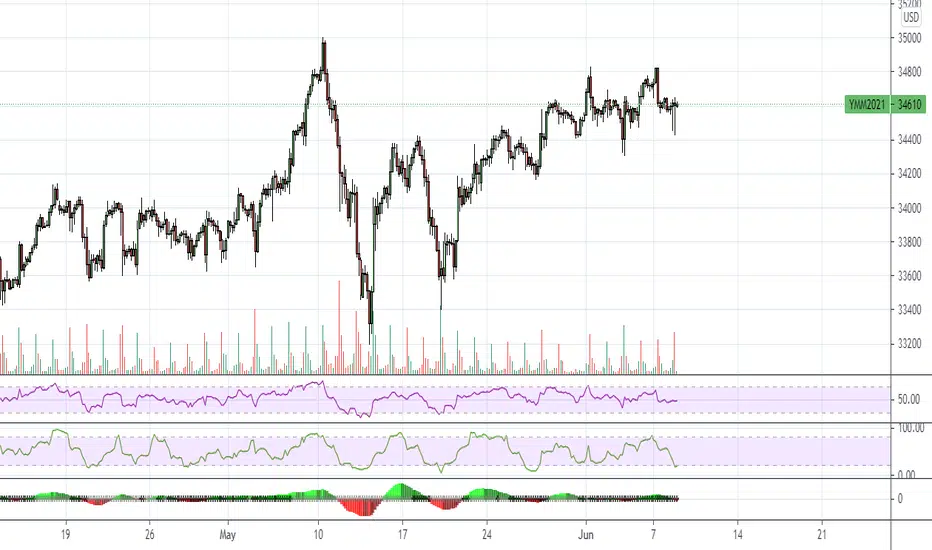
You are hereWave E down in Progress per my count. Real Fireworks start next week. See Chart
If we exceed 34849 (Top of Wave D) my count is off.

Nikkei's multiyear rising expanding wedge and probable outcomeI have the chart depiction of Nikkei's multiyear rising expanding wedge and outcome laid out here. In my understanding, the Dow, SnP 500 and all the rest of indexes worldwide will mirror this to the final lows in March 2022 and probably beyond. The standard price targets in that rising expanding wedge pattern along with possible cycle date timings are shown no matter of any timescales in the chart. That's about 56% decline from around the high of 30,700+. German DAX 30 shows expanding megaphone in the same range of years which is targeting all the way to 3,600 in coming years (end of 2023) if the megaphone pattern fully plays out in this large context. I know that it certainly does in smaller scales for the declines up to 30%. That will be one heck of a decline to witness in anybody's lifetime.

DIA/USDT going longA typical breakout with 50% target from here for a short term trade. Though I might exit to BTC instead of USDT in time if I decide to hold it much further as DIA/BTC is at ATL.

High volume retest VXXVXX has had a couple recent high volume buying climax type days. Do we see a quick retest?
Fibs in play. Indicators looking bullish for VXX and the MA looks ready to cross. Let's see how it plays out.
Trades active.
Not financial advice.

DIA a market melting..... up?!This is a great example of a market that is melting.... up. Every day for the past week and a half we have seen a market that opens speculatively higher and closes lower than the open.
If you are looking at markets in general that are healthy you will see that most green candles support an upwards trend while most red candles support a downward trend.
This is very different and cause for concern that there is a large inflationary bubble in the market right now waiting for a moment of sell off.
To be completely honest we are short DIA with contracts expiring June 18th and 25th from the "Out of the Market" phrase large red candle on the chart. This open higher and close lower continually has to stop one way or another.

DIA/BTC Spot SignalThis is my Spot idea for DIA/BTC
Targets: 545 - 570 - 620 - 700
Sell: -7%
Don't get greedy
If you liked my idea, follow me for more 🚀

XLF and others might lead the wayAs noted in my previous ideas about $SPY (bearish), $XLF, $XLI, $IWM, $XLE might be the catalyst that leads the markets higher. $XLF tapped the 8day EMA twice before going back to positive which to me shows resilience with a market that has no sense of direction. A nice hammer doji before breaking off into Memorial Weekend. XLF might try and tap the upper band (38.50 - 39) before fading back to middle channel.

May Day for the DIAMy count has Wave E down on deck for DIA/DJI.
In the current wave pattern the wave i up (of Wave D) was so short/quick, thus prediction is that wave v (of Wave D) will also terminate quickly and I think it did today. Stoch RSI appears to be confirming and the Woodies CCI popped a +200 today indicating a possible turn.
I had originally thought this might be a simpler ABC down but see chart for couple of prior corrective wave patterns for comparison. The Wave C in the current pattern is too short for an ABC down IMO, thus Wave E is in play.
Only question is will it happen tomorrow on the last trading day in May. Will it truly be a sell in May and go play?
Somehow I think they will keep this thing afloat until next week.
Enjoy the Holiday on Monday if you are in the states.
Not financial advice.

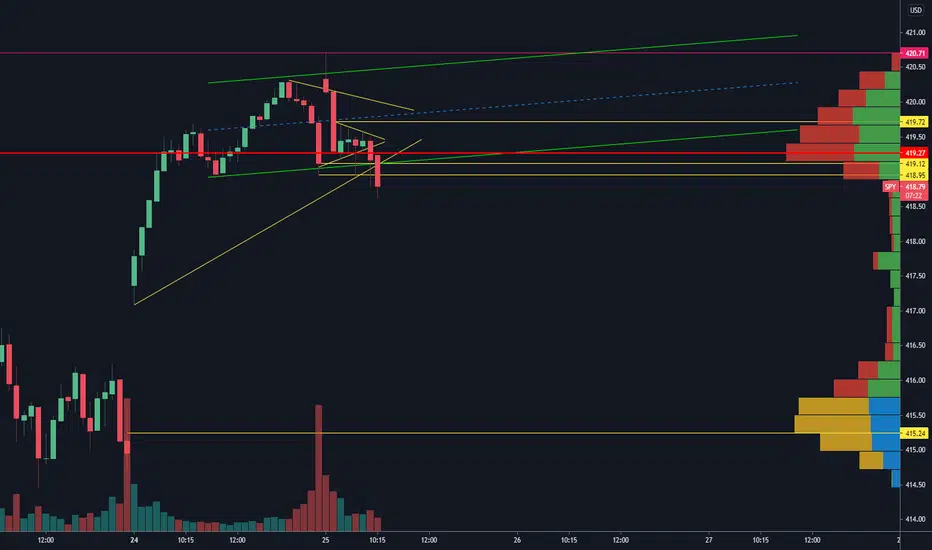
QE, Buy-Backs, BTFD, and Fed Rhetoric Save MarketsHey guys, I hope everyone had a nice relaxing weekend. After a freakish drift higher on the US majors yesterday toward the ATH's, and off the back of a week straight of buy-backs, QE, and dip buying, the SPY is back at the lower band of the ascending green channel (resistance) around 420. Of course, we can't not mention the FED members parading around every day, spreading more transitory-inflation rhetoric to boost sentiment and cool yields.
On SPY, we recently saw 2 tests of the 50DMA, first on May 12th, and then again on May 19th. But, we saw strong support, just as we have in the recent past. I expect a rejection at this level, similar to the rejection we saw on May 14th at outside channel resistance. We have initial downside to the 21EMA at 414.25, and then, of course, a retest of the 50DMA is likely this week around 408.50.
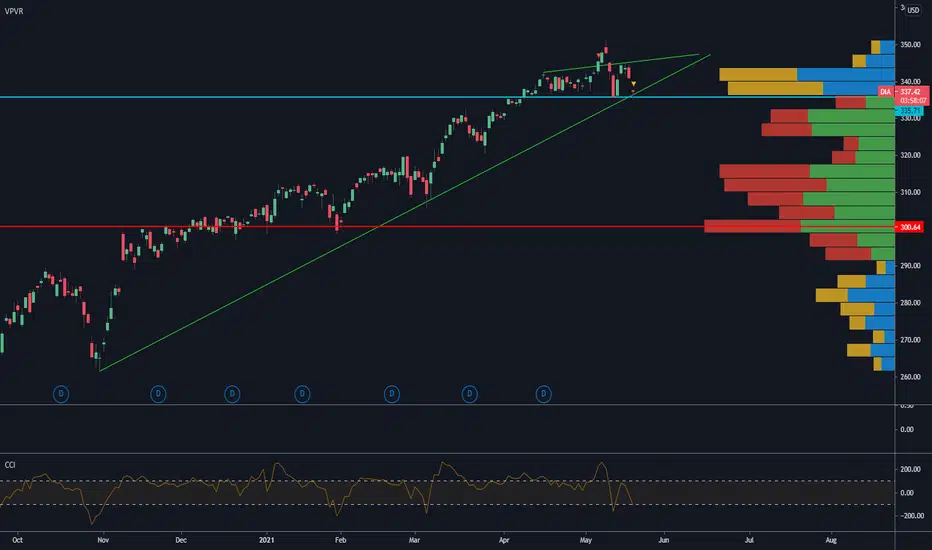
On the Nasdaq (QQQ), we're sitting at 334 pre market as of 9AM, and likely to retest the high from Feb 16th around 338 before getting a rejection. The momentum is to the upside as the 21EMA, 50DMA, and 100DMA has been recaptured. The Russell (IWM) is sitting just at the 21EMA around 221, with the 50DMA just above us at 222.34, and the 100DMA just below around 219, and the Dow (DIA) is sitting at the top of it's recent range, and within a couple percentage points of the ATH.
Gold has been levitating just above the 200DMA after the recent dollar puke, and spike in bonds, while Bitcoin (BTCUSD) recovered slightly to a 37k handle after the insane 54% crash that we all knew was coming. WTI (USOIL) is sitting around 66 and showing resilience as FED burns the dollar back to an 89 handle.
The Vix is sitting at 18.2 after retesting the descending trendline we broke through on May 11th. We hit a low of 16.9 this morning around 7AM, but are poised to recapture the white ascending trendline around 18.6, with 18.8 resistance back in play.
Finally, the US10Y yield is being sold off as the FED down plays inflation as transitory, and although the cup and handle formation is still potentially going to materialize, based on previous tests of long term resistance, it may be several weeks before we see a breakout.
I just want to say thanks again for everyone's patience last week as I took some time off, it was a rough week. My cat Franco was in and out of the vet, and had his final surgery which went well, thankfully. Then my dog Pompey died. When it rains it pours I guess, but he was 18 years old, and had a great life, so I'm finally smiling now when I think of him instead of crying. Time to get back on track. :)
Our live analysis begins at 9:30AM. Cheers, Michael.

Inflation < FED, time to get back into QQQsMACD has crossed. All the talk about inflation is irrelevant. Since everyone is in the sidelines because of inflation fears, the contrarian play is to get in and enjoy the ride! Just make sure you hedge in GOLD.

DIA return to equilibrium?If BTC will turn in the up direction DIA will return quickly to the equilibrium like the pas has shown us.
Good opportunity to buy in.

DIA / USDSeems like a pennant forming with DIA against the USD, I'm taking a punt on this set up for sure.
Stop loss set up in the case that there is a breakout to the downside, which I hope there is not. There seems to be support on the daily excluding the wicks so I'm assuming (hoping) it continues to hold.
DIA is basically a less-known oracle, similar to #Chainlink, with a much smaller marketcap! Oracles will be big business in the future in my mind...
I will take profits around the $7.60 area, possible 100% of the bag that I am now holding.
Trade safe homies, never with debt and only what you can afford to lose!
Alfa

DIA - Either new lows (alt season over) or we continueDIA - Either new lows (alt season over) or we continue


Overnight Gap is Filled - Probably Rips Higher into Friday CloseCautiously Bullish from here into close and into next week.
(Opinion Only)

DIA - Tested the 50day - Long above the 50dayMAHowever; it hit the longterm trend support. Showing a nice reversal candle so far today.
If holds the 50day MA stay long.
DIA Long 100% gains signalOne of the Alts that I love to hate due to its slow movement just broke out of 50D EMA. My entry level marked in blue, and my conservative exit target marked in green.
Will it let me down this time? Or finally move at last?
Time will tell.

