DIA

PUMP incoming! If we beat the 3,7 lvl I believe a good Pump is incoming.
Great cup and handle and volume increasing with a lot of pressure.
Double bottom rejected recently in the 4h uptrend.
Let's pray now after this straightforward TA.


Dow Jones back above 2009 regression channelSo far, every time that DJI has been above this channel it has had a pullback. There is still a bit of upside to reach the max it has ever been, but if history repeats then a correction is coming soon.

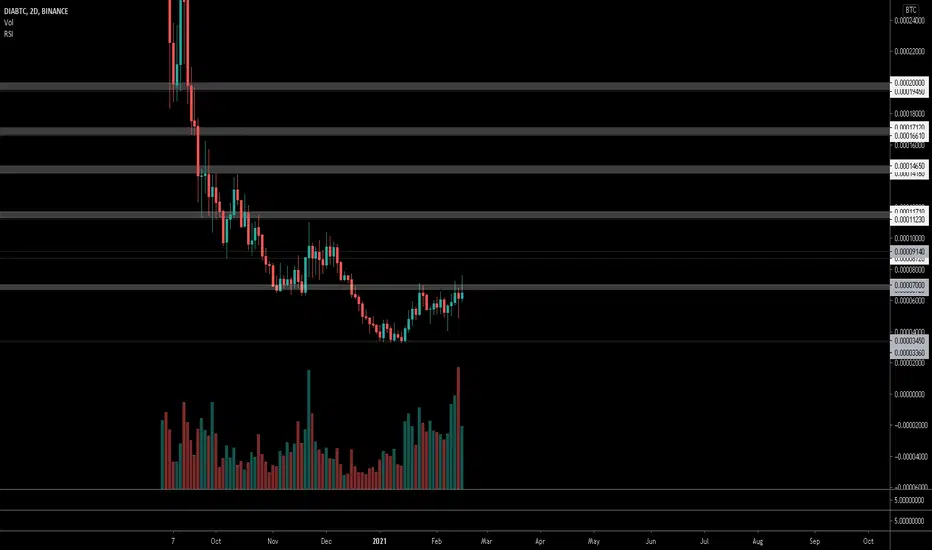
$DIA, potential breakout above ~7k sats level..$DIA
Will look for a potential breakout above ~7k sats as volume is making HHs even on BTC 50k test
If happens, every level is around 30% so upside is quite massive
UCTS Buy signal on the 1/2D and most lower timeframes
Wait for it 🤞
#DIA
Dia Daily Breakout Setup Dia Cryptocurrency will breakout above the Daily Resistance soon . made lots of attempt to clear the resistance and now it is a good chance to move into this token
Dia cryptocurrency token will out perform the once break above the Red zone
In bitcoin bull market you can hold cryptocurrency if it breakout above the All time high, holding alt coin will give you really good amount of profit,
so in case of All time high or Big volume breakout happen you can hold this coin for good long term coin list
Buy above 700 sats
Stop : 450
Target : 840 , 965 , 1098 , 1250 , 1424

TAN solar ETF!22 breakout on TAN. This is bull flagging at highs. If you have an intrest in the solar industry this name may be a good trade. The risk reward is pretty great with a stop loss under 118.

DIA/USD Long limit entryEnter limit long 2,85
SL 2,60
PT 3,45
BE 3,20
RRR 2,6:1
mid term
BINANCE:DIABUSD


DIA / BTC Bat PatternDIA / BTC
Why Dia Can Be Fly ?
- Bat Pattern
- Broken Down Trend
- Macd Divergence


DIA/USDT is ReadyWith 3% Supply on Exchanges + 60M$ Market cap + this Key S/R Flip, #DIA is looking ready here

I think DIA has a lot of potential, what do you think!?The chart speaks for itself.
Comments are welcome...
Have a green day and do good things. ;)
DaCapoCrypto

dia you have to be sure that harmonic pattern is done before trade,though. macd dema seems sense to be ...


DIA/USDT ideaDepending on the BTC movement ,DIA could continue higher. upside target is ok but the downside is more likely to me.

$DIA - Decentralised information asset, close enough to DeFi$DIA a decentralised information asset provides financial institutions with financial data
It is also open source, data and oracle platform for DeFi
Token also claims to be a governance token
The FA sounds brilliant
TA looks great too, close above $2.134 and it will be confirmed in the top range, where long term we can target $4.12
Not much else to say, bit of resistance on the way up highlighted by the fibs, might be slightly bumpy road upwards

DJI Rising Wedge and trend linesDJI is showing a lot more weakness than the S&P and NDX. I am seeing the DJI testing the bottom of the rising wedge pattern that it broke out of last week.


DIA/USDT gunna blow Massive rounded bottom is a strong consolidation pattern
These moves are measured from the top of the pattern to the bottom of the curve
giving us our target on the chart & then new ath
Happy Hunting

DIa Boom Oracle Defi in the market against Link.
We could to have inverse head shoulder with Ascending triangle :)

𝗗𝗼𝘄 𝗨𝗽𝗱𝗮𝘁𝗲: $YM_F Daily. Retest of Feb ’20 High HoldsRetest of Feb ’20 highs as support held and a big reaction. $NQ_F leading but won’t be surprised if other sectors join
$DJI $DIA $SPX $SPY $ES_F $NDX $QQQ $VIX #DowJones #ElliottWave #Trading #Stocks

