YM Dow futures UpdateAlmost oversold, looks to me like a whipsaw for Monday and Up either Tuesday or Wed
DIA

Possible H&S Top Forming on DOW?It's too early to call but wouldn't be surprised to see something like this play out over the next couple weeks. Market feels overdue for a proper correction/consolidation from the massive run-up since March. But there's so much liquidity sloshing around that I don't have high conviction on the timing or the next immediate direction. If momentum does turn decisively down from here, I'll begin looking for areas of support and price targets.

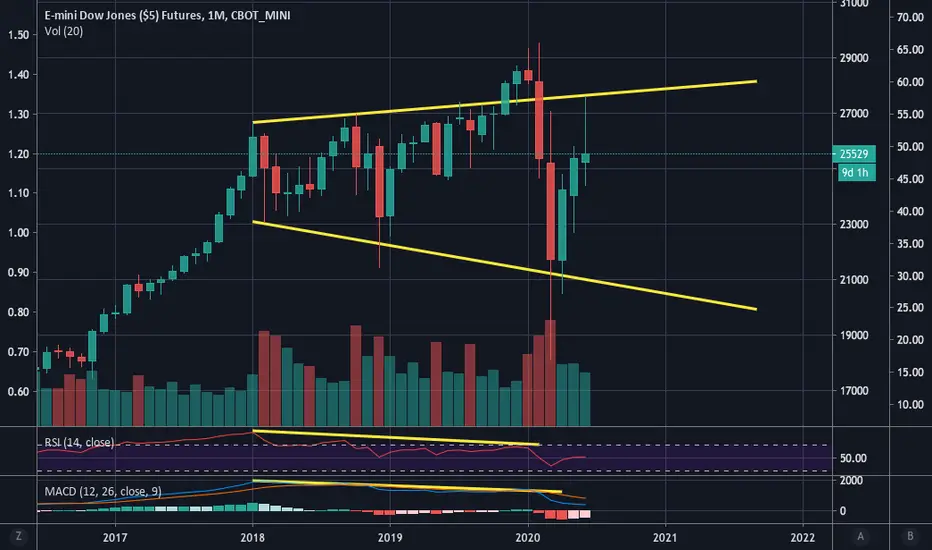
DOW JONES MAJOR MARKET TREND REVERSAL! I decided to publish this analysis of the Dow Jones since I found it to be very significant. The chart suggests that we have reached an end of a long bull market run that lasted around 10 years. It appears that we now are transitioning into bear market! Oh well, the bears need some time in the spotlight too!
As you can see, we reached higher and higher highs as well as higher and higher bottoms in the market until we reached the all-time high of over 29,000 back in February. Since then we have experienced a few rallies but peaked at 27,250 earlier this month. Looking at the bottoms, we can see, and recall, almost too well how we hit 19,000 back in March. Remember, the little crash back in December, 2018? We found support at around 22,300.
So, we now have identified a lower low and a lower high. This creates our new bearish trend. As you can see, I have connected the dots on the chart, and you can see how the bull trend has been broken and the beginning of a bearish trending channel (red dotted lines) has formed. I expect the market to move within this bearish channel for quite some time. As you can see, we will not hit any new market highs this year considering that the resistance currently is positioned around 27,000 and will trend lower from here.
The bottom of the bearish channel intersects with a green support line around 16,700 in April, 2021. If the channel holds, 16,700 represents the worst case scenario in terms of a low on this time frame. This green support line represents strong support as it has acted as such since 1982.
Thank you for entertaining my idea. See you somewhere inside that bearish red dotted channel!

DIA - 22.6.2020- WHAT COULD WE EXPECT OF.. Hi, traders.
My name is Lukas and I am a beginner in trading, respectively, I only trade 9 months. But that means I have to do the necessary analyzes without it I can't trade. I want to show you how I work on myself and document my beginnings. I use Vix and my strategy is built on to return to average. I highlight the important support levels and resistances that flow from the volume profile, all drawn on graph. These zones determine the ability to respond in some way to the market from 1 to 3, with 1 being the largest.
Short description of analysis:
We are getting out of the average local volume profile values, so be aware and expect input at $ 250. Of course, this must be confirmed by the volatility index. Keep in mind important fundamentals.Of course, my analysis does not serve like market forecasts and I am not responsible for your trades if you use my analysis for your own trades.


Dow Jones Long-term Megaphone, Limit Reached to the TickOn both the long-term (weekly and monthly) S&P 500 chart and here with the Dow monthly chart, one can see a large megaphone structure or broadening pattern. In both cases, the Fed balance sheet reversal and then repo-induced mania of last year created an overthrow. On the S&P 500 megaphone, this bear market rally culminated in a small overthrow again, but that index now sits once again inside that structure.
With the Dow, on the other hand, the rally came to an abrupt halt as it found resistance at that structure and subsequently retreated from it, to the tick. In this chart, it is forming a very strong, long-wick rejection candle.
I do believe we will be making our way to the bottom channel once again. We will likely find some support there, but I believe it will then fall out of the structure altogether, the common conclusion of a pattern like this.
USOIL/WTI H4: Scenario analysis with SL/TP bulls/bears(NEW)Why get subbed to to me on Tradingview?
-TOP author on TradingView
-15+ years experience in markets
-Professional chart break downs
-Supply/Demand Zones
-TD9 counts / combo review
-Key S/R levels
-No junk on my charts
-Frequent updates
-Covering FX/crypto/US stocks
-24/7 uptime so constant updates
USOIL/WTI H4: Scenario analysis with SL/TP bulls/bears(NEW)
IMPORTANT NOTE: speculative setup. do your own
due dill. use STOP LOSS. don't overleverage.
🔸 Summary and potential trade setup
::: USOIL/WTI H4 chart review and setups
::: weak chart, more downside likely
::: gap fill in progress, upside limited
::: two primary options outlined on the chart
::: Option1: Distribution at the top, short range highs
::: short-term TP bears is 35 USD/bbl (14% pullback/correction)
::: Options2: mild upside remains, H*S setup on the right
::: short from the highs near 42.50 USD/bbl
::: TP bears is the same: 35 USD/bbl
::: later on you can flip LONG/BULLS near 35 USD/bbl
::: TP BULLS is 40 USD/bbl
::: so get ready to make money in this market
::: good luck traders
::: for SL use 1-2% max exposure
🔸 Supply/Demand Zones
::: N/A
::: N/A
🔸 Other noteworthy technicals/fundies
::: TD9/Combo update: N/A
::: Sentiment: BEARS
::: Sentiment outlook short-term: BEARISH

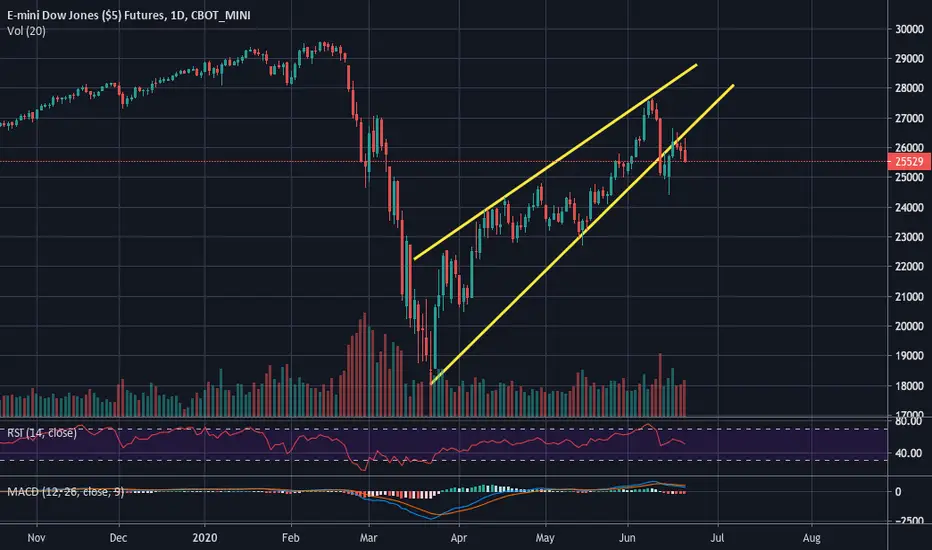
Dow Jones Bearish Wedge Breakdown and Failed BacktestThe Dow Jones futures, much like the NASDAQ and S&P 500 futures has formed a bearish rising wedge from the March lows. Last Thursday's bloody drawdown broke the index out of this structure, after which it tried to recapture it, which then failed, and a subsequent backtest looks to have failed now as well. This is in keeping with the other major indexes.
Any forthcoming selling from this point spells serious trouble. I am seeing rising similar patterns everywhere at this point.
$DJI (Dow Jones Index) - Bears vs. BullsThe $DJI (Dow Jones Index) has set a temporary double-bottom Support level at 25089.30.
DJI has been in a daily uptrend for the past two months, and is seeking to test Resistance levels above the current price.
However, bearish fundamental news over the weekend could cause the DJI to instead fall and test Support levels below.
Resistances: 25951.30 and 26300.20 and 26829.50.
Supports: 25089.30 and 24789.60 and 24480.90.

Long DJI on strong supportDon't overstay your welcome being short, looking to scalp long on support tomorrow morning.

Financial Conditions IndexUpdated weekly: this index displays the current impact of financial conditions on the economy.
Note: during the tech bubble, financial stability was NOT the issue.

Microsoft ($MSFT) and Apple ($APPL) 💻 | New Highs for the Market🐮🖥️🐮 Apple and Microsoft are giants of tech and some of the largest holdings of the major indexes. If these companies run, not to mention the other tech giants like Facebook and Alphabet, then the markets will almost certainly run with them.
Just look at the top 5 holdings of the S&P :
Microsoft Corporation 5.68%
Apple Inc. 5.60%
Amazon.com, Inc. 4.26%
Facebook, Inc. Class A2.16%
Alphabet Inc. Class A1.68%
Alphabet Inc. Class C1.68%
Here are the top 5 holdings of the Nasdaq :
Apple Inc. 11.83%
Microsoft Corporation 11.41%
Amazon.com, Inc. 10.25%
Facebook, Inc. Class A 4.35%
Alphabet Inc. Class A 3.88%
Alphabet Inc. Class C 3.85%
Here is the top DOW holdings With non-tech excluded (Microsoft is the 6th on the list, Apple is still #1):
Apple Inc.9.14%
Microsoft Corporation 5.07%
It should be obvious to you now what we mean when we say " if these stocks run, then the market runs ." We mean, they are the biggest parts of the major indexes!
This is good news for the bulls, because run is exactly what is about to happen based on historical trends.
Some people seem to think that these tech stocks rushing past new all-time-highs perhaps signals the top of not only these companies but the market. In fact, we commonly hear this sort of sentiment every time it happens. Reality is just the opposite.
The fact that these companies are breaking all-time-highs is actually bullish for them and the market as a whole.
On top of that, the news is bullish for these companies as well (COVID aside). We have new iPhones, a slick new MacBook Pro, a new Surface Duo, and a declaration against Face ID for Microsoft.
In short, there is nothing really substantial to bring these giants down aside from the broader market, but again, it is more likely they bring the market up. Don't take our word for it though, the historic patterns are clearly illustrated on our charts.
On the charts, you can see yellow horizontal lines marking off each new high. You can clearly see that the longstanding pattern is that breaking a new high is bullish for both Apple and Microsoft (with this being true in spite of any bearish disbelief).
In summary, breaking all-time-highs with conviction is bullish for the tech giants, which is bullish for the markets. So after that last break, our only questions are "when" and "how high?"
Resources: www.etf.com + www.forbes.com + www.forbes.com + www.foxnews.com + mspoweruser.com
✨ Drop a comment asking for an update, we do NEW setups every day! ✨
Like, Comment & Follow to help the community grow 🎉🎉

$DXY $SPY inverse correlation very strong.The only thing you should look at for predictive analysis at this point is what $DXY is doing. You can see the correlation in the chart here, one goes up, the other goes down. Look at key levels for the dollar, and currency / bond markets to figure this out. The SPY is all stimulus fluff at this point held up by the dollar, but guess what, you can only prop it up for so long, as soon as liquidity shrinks ( when the stimulus effects die off), its gonna be hard to get cash, so you'll have to get it from your portfolio. And with the rally in Bonds today, well... lets just say there a point to be made about where people want to put their risk.

Short Now.Wave B Complete. High Probability Trade. Use Stop Loss.
If I am wrong - minor loss. If I am right, huge potential.

Bears lost (get over it) the final round.Please do you Due diligence and invest wisely
From my last DIA post I presented the Bears Vs Bull case and pointed out at what level I felt would decide who won the final round. I also pointed out the bull vs bear trap area which played out for many weeks to trap as much bears as possible.
Now I think the market will make new all time highs and every dip in my opinion will be a chance to go long. The fed owns the market and has tipped the scale in favor of the market now the FOMO has begun in retail who will be the ones to push the market to all time highs.

INFINITY MODELER SPX 3200 unthinkable bottomWelcome trading viewers
I present to you beyond technical analysis/axiom quantification of prices.
Maybe you think its a vodoo or something, behind the scene is complex set of modelers in conjunction to price.
Spx bottom in.. did i predict the unthinkable.. maybe i did or may be i did not
Theee years from now we will look at this chart and ponder about the magnification of our ideas.
Stop loss 2120 and target 3200 the global optimum of multi objective optimization

Intermarket analysis expects SHORT in the INDEXES!Hi traders,
today´s video combines educational content and analysis of 4 major Indexes. BUT!
We do not analyze them separately, but together - WE DO THE INTERMARKET ANALYSIS.
It is this approach that will show you whether an index is overvalued or undervalued. How is that possible? There is a great correlation between them.
Look a the NASDAQ guys. That´s the only one, who reached the last Highest High! Again - THE ONLY ONE!
What we can expect? SHORT, because NASDAQ is too extended.
Have good trading,
Jakub
FINEIGHT

SPX / DJI / NDX / RUT (Road to new highs?)US stock indices. Road to new highs?
Please, don't forget to like and follow.
Thank you.

US30/DOW Daily: almost maxed out, 30% sell off soon(NEW)Why get subbed to to me on Tradingview?
-TOP author on TradingView
-15+ years experience in markets
-Professional chart break downs
-Supply/Demand Zones
-TD9 counts / combo review
-Key S/R levels
-No junk on my charts
-Frequent updates
-Covering FX/crypto/US stocks
-24/7 uptime so constant updates
US30/DOW Daily: almost maxed out, 30% sell off soon(NEW)
IMPORTANT NOTE: speculative setup. do your own
due dill. use STOP LOSS. don't overleverage.
🔸 Summary and potential trade setup
::: US30/Dow recovery almost complete now
::: expecting major weakness soon
::: it's possible that we get
::: a few sessions in range lock
::: to develop the distribution setup
::: 20-30% mark down off the current highs
::: re-test near 18500/19000 points
::: STRATEGY: short sell any rallies
::: good luck traders
🔸 Supply/Demand Zones
::: N/A
::: N/A
🔸 Other noteworthy technicals/fundies
::: TD9/Combo update: N/A
::: Sentiment: BEARS
::: Sentiment outlook short-term: BEARISH
::: fundumentals also deteriorating fast
::: all the good news already priced in.
::: this is also important for CRYPTO
::: because next leg down in US stocks
::: may lead to mark down 30% in CRYPTO assets

Update Dow for short term I believe the rise from a major bottom is a correction wave (ABC). the price now in the last fifth wave of C or 1 of C. Both scenario indicate that the price should make new high and this is a good opportunity for the short-term trader. I am in since last week and my SL is the bottom of last week. There is another suggestion that wave 4 has not completed anf unfold as a complex correction but less likely.

STOCKTWITS IS SPY FOR CHINA *CLASS ACTION AGAINST STOCKTWITS*Stock twits is protecting CHINA and banning accounts that speak the truth about it. TIME TO FILE CLASS ACTION against STOCKTWITS. SUPPRESSING FREE SPEECH IS NOT ALLOWED!

Is the Dow Jones 🐂 Ready to Rumble? | DOW JONES MINI FUTURES ($🐮 The DOW (DJI, DIA, YM1!, UDOW, etc) is rallying based on recent strength shown by key players like Disney, the banks, Boeing, Exxon, etc. Looking at Dow Jones Mini Futures (YM1!) we can see a new clear bull trend forming... but we also see a clear-as-day support level to be tested to help confirm this rally. Perhaps the shift out of the NASDAQ's COVID hedge plays and into DOW darlings causes a correction in all markets, perhaps bank stocks run up against resistance and need to cool down. Whatever spurs on the retest of support, so be it. The plan here is simple regardless, we are aiming to buy support and catch a ride on the post-COVID bull.
Resource: www.investors.com + www.fool.com + www.cnbc.com
✨ Drop a comment asking for an update, we do NEW setups every day! ✨
Like, Comment & Follow to help the community grow 🎉🎉
---
1. Fractal Trend is showing an uptrend (Aqua colored bars) on the 4-hour timeframe. This is the first notable confirmation of an uptrend on YM1! and is indicative of the recent strength in DOW holdings.
2. With this strategy, we are looking for long setups in an uptrend and as such want to enter long on retests of bullish order blocks plotted by Orderblock Mapping (Aqua colored lines) and/or bullish S/R levels plotted by Directional Bias (Aqua colored lines).
3. The goal here is to take a long position at the S1 S/R flip since that has been a major price pivot point during the COVID correction.
4. Our stop loss is placed just below S1, with the logic being that S1 will hold.
5. Our target is the R2 highs formed during a dead cat bounce back in March.
6. If S1 doesn't hold, then S2 offers another support level, although the current bullish bias on the DOW would be lost at that point.
Good luck bulls!

Dow Futures: Blue Wedge of Truth Under AssaultLike $ES_F, $YM_F is testing the top of its Blue Wedge of Truth at 24,200. The bottom of the Wedge currently sits at 23,900. Broad risk-off sentiment seems likely to result in a test of the latter.
