DIA


Elliott Count of DIA - Bear Move May Start Next WeekElliott Wave Count: Flat Correction (3-3-5)
- Waves A and B of the Flat have completed.
- Wave C is an Ending Diagonal (*A very small percentage of diagonals appear in the C-wave position* | sequence 3-3-3-3-3)
Current Predictions
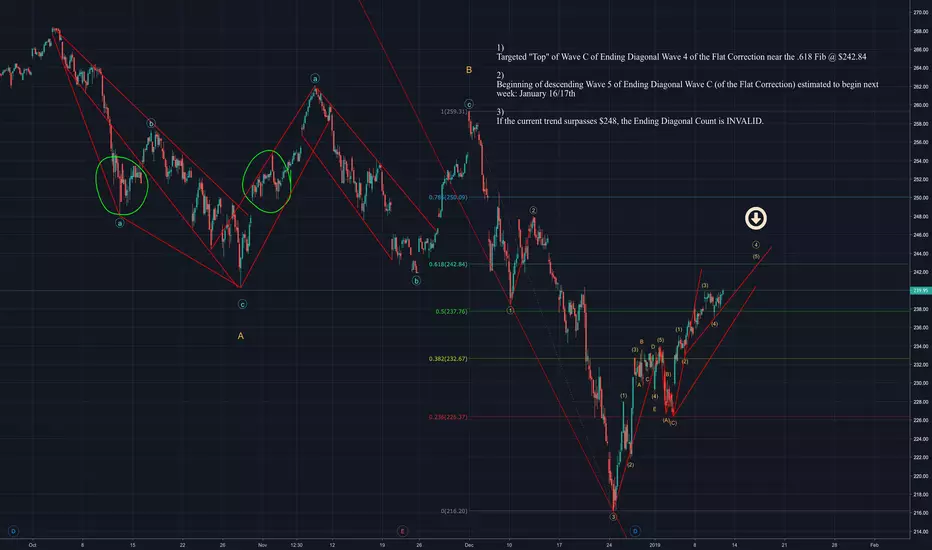
1)
Targeted "Top" of Wave C of Ending Diagonal Wave 4 of the Flat Correction near the .618 Fib @ $242.84
2)
Beginning of descending Wave 5 of Ending Diagonal Wave C (of the Flat Correction) estimated to begin next week: January 16/17th
3)
If the current trend surpasses $248 , everything here is wrong/the Ending Diagonal Count is INVALID.
DIA Vertical RecoveryEveryone says the market can't go straight up. Well, it happened last year, so why not again?
Sure looks like there should be a pullback here sooner or later, but the Feds don't meet again until March. We'll be at ATH by that point, lol.

Just an idea for the medium term...I've been unable to convince myself of either the bullish or bearish cases for the medium term. There are valid arguments for both sides. I could very well see us zig zagging sideways for several months in a symmetrical triangle before setting a new ath or breaking the December low. The outer diagonal green lines are part of the long term channel formed after the 08 low. The middle green diagonal line is an upper bound of a secondary channel drawn with the bottom diagonal. It's important to remember that this idea is just speculation, and the pattern won't exist until there is a lower high and higher low, forming the triangle.
Tips are appreciated if this plays out and helps you get ahead of the market in the coming months:
ETH: 0x13cd45d7d282ee0ee4635645cce2e2a566d9bed8

DIA protective stop $247.89After the run the DIA has been on, it is now time to profit the profits with a sell stop at $247.89

Next Week's Expected Move ($47) + Gravity Points + Economic DataNext week will be perhaps the most important week of the year. Given the number and size of companies reporting, I can't emphasize enough to keep your seatbelts on. Thursday is the biggest earnings day.
Important Economic Events that happened last week:
1. The Economic Forum in Davos was downright pessimistic. Maybe a little bit overdone, but still these are CEO's, hedge fund managers, ect. all gathering in one lump sum all coming out with one idea, and that was that 2019 has got a lot of pessimism to it.
2. The week began with the International Monetary Fund (IMF), and for those of you who don't know the IMF came out and downgraded 2019 Global Growth. This is the 2nd time they've came out and downgraded global growth.
3. The largest semiconductor company - INTC - came out with bad Earnings. Semiconductor's are a leading indicator of the Technology sector. And it shouldn't be anything new when I say that the Technology sector leads the broader stock market. It's really not just Intel. I can't really remember any other time in my career where so many CEO's are displaying so much uncertainty in their projections moving forward.
4. China is pumping serious liquidity into their system. They're out there with a firehose just spraying massive massive liquidity all over the place like there's no tomorrow. As a trader, this makes me nervous. When China is spraying liquidity like that, that means they're seeing major major headwinds.
Take it for what you will, this is all just my interpretation. All I know is that when you start hearing a week or two of discussions on the mainstream news about the market heading for new all time highs, it's probably time to put your seatbelt back on.
Goodluck out there next week gentlemen,
RH
Last Week's Post: Beautiful example of why I use this on a week-to-week basis.

$DIA Make or BreakMajor test pending for $DIA of upper downward channel.
Each leg down was followed by a .786 FIB retracement- the latest leg being no different.
.50 Channel FIB acted as prior support and is a good first target for shorts.
Just how much we overshot to the downside in DEC, we've likely now overshot to the upside.
Stochastics started to diverge a week ago.
Sitting at BRN (Big Round Number) / Psych Resistance of 25K.
$SPX & $QQQ both hovering at D1 200EMA.
$XLF & $XRT failed to breakout of range.
$XLY & $XLY brokeout with very weak strength.
Have to imagine we see profit-taking either into the weekend or next week.
Feeling like this week is going to end with a sideways-drift, possible lower and folks are going to re-balance beginning in FEB.

WelpIt looks like instead of a breakdown that I foretasted, we are going to complete a 5th wave. we are getting some resistance from the trend line that I drew from the lower highs since the October selloff. We should be able to get past that. Obviously we have a big PUT underneath us, but I will spare talking about that because that's not TA

TUP Becoming Buyout Candidate...?After an abysmal earnings report and subsequent drop of over 25% today, shares of TUP are becoming a potential takeover target.
Who might buy? It could make sense for several companies: P&G (PG) could expand its portfolio of product offerings, as could Colgate-Palmolive (CL), but it could also make sense for Amazon (AMZN), as their endeavor in to fresh foods could benefit.
Five years ago, shares of TUP were nearly $100, but today at just about $28, they're down over 70%, which for shareholders, is catastrophic.
Clearly TUP management isn't cutting it, so there's going to have to be a shakeup there, or more preferably, an outright sell of the company to more capable enterprises like those I've listed. It wouldn't be hard to get funding by any of those aforementioned giants.
I'm not suggesting jumping in today, but give it time to settle and look to pick up some shares for a long-term view or if you're like me, some long-dated calls to minimize capital outlays.

$SPY pattern HEAD & SHOULDERS With the government coming back from the longest shutdown in history. We could still be expecting blowbacks from the affected sectors and companies. So what better pattern to complete this mash-up than a head and shoulders.

$SPY pattern HEAD & SHOULDERSPlease Like if you agree. The longest government shutdown in history ended with 35 days. But the blowback effect of all the reports and cutback are still ahead of us.. This is why I see head and shoulders in our pattern traders forecast.

Might be something to this Gann Fan thingFans drawn well in advance, prior to highs touching precisely at different points


Next Week Expected Move ($41) + Gravity PointsThis is the most spectacular rally I've ever traded.
We cruised above last week's $46 expected move. Actual Move? $74
So we broke outside the expected move, and yet this coming week's expected move is only $41? What's the deal?
Well it's only a 4 day trading week. So the options market did increase their volatility. $41/4 days = $10.25 vs. $46/5 = $9.20
Despite Monday being closed for the U.S., keep a very close eye on China Sunday night as they're releasing GDP numbers..
Update: They were the worst in the last 28 years.
Check out my trading Partner's page for additional ideas and updates:
www.tradingview.com
It would appear my post was still set on Private vs. Public. I was looking for my typical 5-6 views but 0 seemed out of the ordinary.
30 Min Chart / Unpublished Post
Last Week's Post:
Chart Dump for Review:

