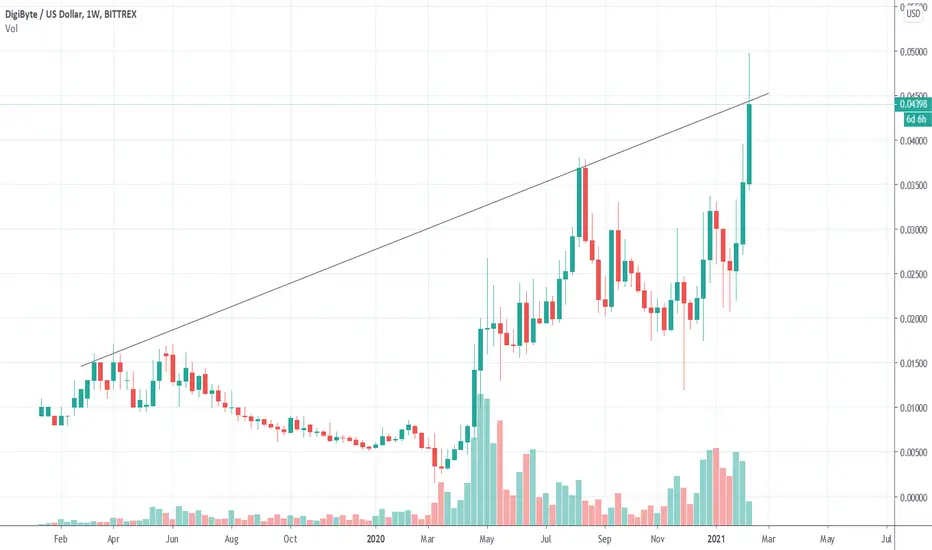
DGB/USD Weekly NeutralAfter the recent run, DGB/USD price might go sideways and/or slightly downwards. Neutral outlook
Digibyte
Digibyte: Did You Buy It?Believe it or not this is where DGB is going.
Unfortunately, long-term data as it relates to USD is absent from Tradingview due to the poloniex delisting. However, with a bit of due diligence you can find the missing data from other sources. My guess is that if long-term data for this coin was currently circulating this site, the price of DGB would be already much higher at this juncture.
Also, you can basically ignore the timeframe here, as I had to make some adjustments just to paint a long-term picture here.
A simple fib-extension from $0.0002 back in March 2017, up to DGB's all-time-high @ $.14 (in 2018), mapped back to DGB's bottom of $0.0026 (in March 2020) will give you this chart.
Digibyte has so much room to run. This is just the beginning. I'll map out some future price points below as it relates to market cap.
Marketcap -------------- Price
$1.3 billion -------->> $0.093
$2 billion -------->>> $0.14
$3 billion -------->>> $0.21
$5 billion -------->>> $0.36
$10 billion -------->>> $0.72
$14 billion -------->>> $1.00
(As usual, this is not financial advice ;)

Is this a turnaround for DGB/BTC?After it has broken out of the downward trend, DGBBTC looks like it took a turnaround. Note the increase in volume. First target around 140 sats.

DGB/BTC Potential +300% ProfitLooking at the weekly we have been holding the bottom support for years now. We had a little run up that bounced off the previous red support (turned resistance) and retraced back to the long term support and double bottomed more or less (hopefully). We are looking close to a MACD cross as well. I am expecting another run up to the red resistance, possibly where it coincides with the horizontal dotted resistances. If we just hit it again it'll be roughly a 300% profit.
DGB has always been a coin I have thought was extremely undervalued, although that could be due to lack of marketing and hype. Regardless, it looks like a good risk/reward to me.
This isn't something I expect to happen overnight btw. Just a coin I put a bit into for a long term trade.
Disclaimer: I am not a professional. Trade at your own risk!

DigiByte... What Would You Tell Your Kids If...DigiByte (DGBBTC) is looking great right now, especially if you compare the chart to how it was looking two weeks ago.
Imagine going into the future....
What would you tell your kids if they asked why you didn't buy crypto in its early days...
What about Siacoin and those other altcoins that are bottomed and yet to move?
This is just a joke of course, but what would I tell myself if I fail to buy knowing again that the price will move?
Enjoy the bullish market.
Remain patient, do not get excited.
Take your time to make every single decision.
If one opportunity is lost, wait patiently because another one will show up.
Wait for prices to be stable; buy around the lows and support.
Do not join when there is strong action ongoing, to either side, it is better to have a strategy and be prepared before trading anything at all.
This is Alan Masters...
Thanks a lot for your support.
Namaste.

Digibyte 4h analysis1) Very little pullback after touch the resistance (red line)
2) Price holding above EMA 50/200
3) RSI holding above 50
4) Stock RSI is preparing to rise again
Digibyte will break the strongest resistance VERY SOON!
Fasten your seatbelts! 🚀

DGB PENDING BREAK - STRONG MOVE INBOUNDclustering under a multi year trend line
intersecting with recent consolidation resistance
compression is peaking
supported by the 18 MA (of lows)
a break out here would likely send DGB on a moon mission to minimum ATH @ .13 (circa 2018)

DigiByte - Hypothetical WedgesSo far only the falling wedges has came to fruition
The broadening wedge can be established from previous price action within the falling wedge
Alike with the Rising Wedge
We can use these wedges to establish a TP in the short term - medium term.
Looks very stable at this price level
Entry is appropriate for medium term

EMA 50 x EMA 200 is ready to cross!1) After 117 days with EMA 50 below EMA 200, #DGB is ready to cross;
2) EMA 50 above EMA 200 turn $DGB to bullish;
3) RSI holding strong on 50+ level;
4) Neutral MACD;
Big movement coming!
Put your seat belt on

Digibyte the final chart & trade setup.I still remember back in 2017 when I was screaming all over DOGE & DigiByte are the leaders of a new generation, and yes I remember when I was mining DOGE in 2013 with short money to pay electricity while 8 rigs were heating up in the cold winter.
I always look for historical stuff, and #DigiByte for sure is one of my favs , and since I've seen #DOGE doing his thing in the last few days, I came to the conclusion that #DigiByte is next.
I do have the same feelings for #SC, you can find the setups I've posted, but #DigiByte is way above it.
That's why here you have the easiest chart and trading setup for this year.
If you find this helpful make sure you don't miss it.
Feel free to comment & follow for more ideas!

EMA 50 x EMA 200 almost crossing!EMA crossing will turn 4 hour chart to bullish mode (REVERSAL point).
We don't see EMA 50 above EMA 200 since October 2020 (110 days).
Digibyte holders have waited so long for this moment. :)
Enjoy

U$0,032 big fightDGB is fighting 170 days against U$0.032 resistance.
Touched 16 times this resistance, since 10 Aug 2020.
It is almost breaking this strong resistance, which will become a VERY STRONG SUPPORT!
If daily candle close above U$0,032, Digibyte will run fast to U$0,044.

Digibyte (DGB) Trading SetupDigiByte (DGB) is an open source blockchain and asset creation platform. Development began in October 2013 and the genesis block of its DGB token was mined in January 2014 as a fork of Bitcoin (BTC).
A longstanding public blockchain and cryptocurrency, DigiByte uses five different algorithms to improve security, and originally aimed to improve on the Bitcoin blockchain’s security, capacity and transaction speed.
DigiByte consists of three layers: a smart contract “App Store,” a public ledger and the core protocol featuring nodes communicating to relay transactions.
What Makes DigiByte Unique?
DigiByte is a modification of Bitcoin which aims to diversify security, speed and capacity possibilities.
Digibyte is one of the top coins I'm watching for years, huge potential right here while we are at lows.
Simple trading plan with details posted on chart.
For details comment at any time!
Don't forget to follow and like if you find this helpful!

DGBBTC a big bullish setupStrong rejection line:
On the weekly chart, the Digibyte with US Dollar pair has found a strong rejection line. After the recent rejection the price action is breaking down the weekly 25 simple moving average and it can re-test the 50 SMA.
Harmonic BAT move:
On the 2-day chart, the price action of DGB is completing the final leg of the bullish BAT pattern. When the price action will enter in the potential reversal zone of this pattern, then it can also re-test the 50 SMA on the weekly chart.
EMAs and Shark move:
Now I would like to recall a big bullish Shark move that the price action of Digibyte has completed with Bitcoin pair. The price action is moving below the EMA 10 and 21. We need a bull cross between these two EMAs at least on the weekly chart for any big rally to the upside.
Ichimoku cloud:
The price action is moving below the Ichimoku cloud on the weekly chart, this cloud has turned bullish. Therefore if the price action will start bullish divergence from the potential reversal zone of Shark then it can also easily breakout the Ichimoku cloud.
Conclusion:
Even though the price action has entered a potential reversal zone of a big bullish reversal Shark pattern but we need a moving average cross over at least at the weekly chart for any big move to the upside.

DGBDigibyte is a solid Blockchain project standing out in this crypto space in 7 years.
it broke down on a Head and shoulder.
Think we are at bottom. Showing good rsi divergence
Think we heading for gains over 100% soon.

DGB/BTC Dont miss the pump, most Binance coins have pumped or are starting to move. Scanning coins that are still in a downtrend that potentially can give us some gains! DGB is super popular and CT raves about DGB and how great it is, nonetheless its dumping and I would not want to be holding this.
Looking for some bullish signs before I jump in a position
1) Find some support
2) Break downtrend market structure
3) Candlestick bullish variation
ect ect
Jumping in now you can still lose 50% of your BTC value, that aint happening. Especially in a bull run. Use stops, stack sats.
On the weekly using 4/9 EMA for a golden cross could be a good entry for a longer position but if you want to try to catch the bottom will need to use a LTF!

140 days downtrend breakoutDigibyte broke 140 days downtrend and now is fighting to break the strongest resistance, U$0,032.
We need more volume to break it.
The second resistance (U$0,037) isn't too dificult to break.
Daily candle closing above to U$0,034 will put Digibyte to mega bullish phase (best moment to entry).
Ps: If bitcoin corrects strongly, the price of altcoins will fall.


DGBBTC upto 87% profit possibility a headHi friends hope you are well and welcome to the new update on Digibyte (DGB).
On the daily chart, the price action of the DGB is completing the last leg of the bullish Butterfly pattern and soon it will be entered in the potential reversal zone.
Buying and sell ranges:
The buying zone starts from 1.27 to 1.618 Fibonacci levels, and the sell zone can be the Fibonacci projection between 0.382 to 0.786 .
Stop loss:
The maximum extent of the potential reversal zone at 1.618 Fib level can be used as stop loss.
Possible profit and loss ratio:
As per the above targets, this trade has a huge profit possibility of 87%, and the loss possibility is only 19.5%.
Note: Above idea is for educational purpose only. It is advised to diversify and strictly follow the stop loss, and don't get stuck with trade.


DGBBTC forming bullish Shark | Upto 13.5% move expectedOn daily chart, the price action of Digibyte coin is completing the final leg of bullish Shark and soon it will be entered in the potential reversal zone.
Buying And Sell Targets:
The buying and sell targets as per the Fibonacci sequence of the Shark pattern should be:
Potential reversal or buying zone: 0.00000091 to 0.00000088 btc
Fibonacci projection or sell zone: 0.00000094 to 0.00000100 btc
Stop Loss:
The potential reversal zone area that is up to 0.00000088 btc can be used as stop loss in case of complete candlestick closes below this level.
Possible profit and loss ratio:
As per the above targets, this trade has a profit possibility of 13.5% and as per the above-mentioned stop loss, the loss possibility is 3.2%.
Note: Above idea is for educational purpose only. It is advised to diversify and strictly follow the stop loss, and don't get stuck with trade.
