Digibyte


There is a possibility for the beginning of an uptrend in DGBETHTechnical analysis:
. DigiByte/Ethereum is in a range bound and the beginning of uptrend is expected.
.The price is above the 21-Day WEMA which acts as a dynamic support.
. The RSI is at 66.
Trading suggestion:
. There is a possibility of temporary retracement to suggested support zone (0.00004050 to 0.0000360). if so, traders can set orders based on Price Action and expect to reach short-term targets.
Beginning of entry zone (0.00004050)
Ending of entry zone (0.0000360)
Entry signal:
Signal to enter the market occurs when the price comes to " Buy zone " then forms one of the reversal patterns, whether " Bullish Engulfing ", " Hammer " or " Valley " in other words, NO entry signal when the price comes to the zone BUT after any of reversal patterns is formed in the zone. To learn more about " Entry signal " and the special version of our " Price Action " strategy FOLLOW our lessons :
Take Profits:
TP1= @ 0.0000460
TP2= @ 0.0000530
TP3= @ 0.0000604
TP4= @ 0.0000767
TP5= @ 0.0000899
TP6= @ 0.0001031
TP7= @ 0.0001219
TP8= @ 0.0001459
TP9= Free

DGB ROI since 2017The average ROI of Total crypto market cap comparing to DGB ROI since the beginning of 2017.

Digibyte Elliott Waves DowntrendIn this chart I am trying to visualize an Elliott Wave market cycle of DGB/BTC with 5 waves pattern, and ABC pattern forming which is getting close to finalize close to current price range levels, anytime soon we expect a trend reversal with possible new targets. Digibyte had a lot of development during the bear market 2018-2019, and stands out with great fundamentals which can have a huge impact on $DGB price. Currently Digibyte awareness is at level of Ethereum in 2014, but the development of Digibyte is far ahead and looks like it's very forward and innovative blockchain network with best technological properties.

Digibyte to $150! Carefully shorting DGB, massive potential!Digibyte has hit this channel multiple times, each time has shown massive growth.

Bitcoin at $24,000 by January 20, 2020I predict BTC will surpass it's all time high by January 20, 2020, we've already hit our bottom, and BTC has been making it's way back up, it's always somewhat of a slow process at first, butas soon as we hit our all time high, we can expect slight retracement, and then a break above it's ATH. That's when it will really gain momentum.
Only those who are patient will reap their reward.

DGB BACK TESTED TRADE STRATEGYStacking DGB responsibly (not financial advice)
Apply 50% rule for purchases
- purchase initial position using half the amount you want to invest
- only ever purchase more if the price falls by 50%, using half of the remaining amount
- you have an infinite number of times to purchase
- apply the same formula to any new crypto position
Apply the 10% rule for withdrawals
- sell 10% if position does 100x
- sell 10% (of the remaining 90%) if it doubles from there
- sell another 10% (of the remaining 81%) if it doubles from there and so on
- you have an infinite number of times to sell
Specific example:
- lets say you had $1000 to buy Digibyte in 2016
- maybe you bought at .0008 in the bull run 625,000 ($500)
- in the next 15 months you would have bought 625,000 at .0004 ($250)
- and 625,000 more at .0002 ($125)
- you now have 1,875,000 Digibyte (cost $875)
- in 2018 you sell 187,500 at .04 ($7500) (100x average buy price)
- sold 168,750 at .08 ($13,500)
- now you made $21,000 by selling roughly 1/5 of your original $875 investment.
- the remaining 1,518,750 Digibyte has roughly never been worth less than $15,000 and for a very short window of time it could have been sold for $182,000 in addition to the $21,000 you made along the way.
- but now you have 1,518,750 DGB going into the next bull run.
Stack responsibly
Do you think DGB will 100x, 200x, or 500x in the next bull run?

DGB bottom Rounded bottom and support area with large volume . We are not seeing DGB with these prices for very long. Next 135sat

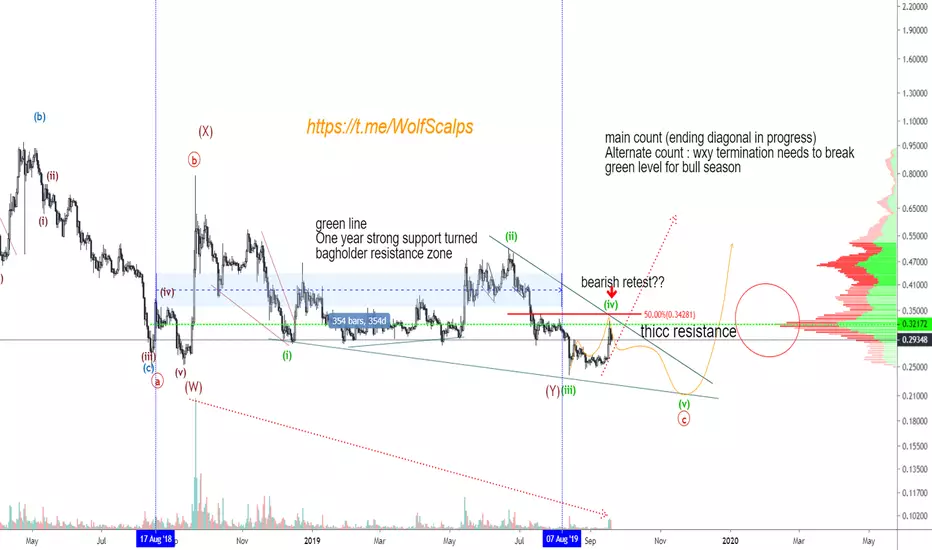
XRP Big Ending Diagonal. Correction almost over $10 soon! recent bounce only triple waves so it has to be corrective. If we dont break the green line/1D high value area of the VPVR then expect this ending diagonal to finish
Should be good to accumulate while it stays in this wedge. If it breaks out then HELLO BULLZooKA
DigiByte Breaks Its Downtrend | Manual Stop-loss Saved Us!DigiByte (DGBBTC) broke its downtrend on the weekly time frame (left) and printed a clear reversal candlestick (circled in blue).
We can expect for DigiByte to recover here and a start a new, strong and sustained uptrend... Yes, I am calling for a change of trend here.
DGBBTC hit bottom on a low wick at 15 satoshis.
If you follow "conventional" trading and had a stop-loss in place, you would get killed here and lose all of your money to this long wick.
We use what I call a "manual stop-loss" and only activate this based on the weekly candle close.
The same candlestick that hit 15 satoshis, ended up closing at 85 satoshis.
We have an active trade for DigiByte and our stop-loss is a weekly close below 82 sats... So for use we remain active, our funds are safe and we can collect profits up once the trend change.
Here you can read more about our manual stop-loss strategy:
Thanks a lot for reading.
Namaste.

Lowest pointDGB is at its lowest RSI point in its life.
I won't call it a bottom, but it's silly not to accumulate at this unbelievable prices.
Not much to say.
This is DGB.
It's turbo underrated.
I don't think you can go wrong with it

Can DGB do another 90% drop? VERY possible. We are riding too close to this support level, and if we crash through it there's nothing to hold it up anymore. That is a HUGE gap to fill.
I am not predicting this will happen, but for all you hodlers out there, DGB has not done anything this year except drop in USD and BTC. Now that everything is dropping it could tank even more, so buyers beware. This is still risky IMO.
Now there's also a chance we completely blow out of the water on this one since it still hasn't shown us any action this year. I still worry though, look at that nonexistent volume over the last many months. Up to you to decide.

Is DGB fueling for a massive explosion in 2020Longer fractal patterns on DGB could supply the fuel required to take it to extremely high levels.

DGB SleeperI don't think DGB gets enough attention despite the community's great work, so I'll go ahead and point out that it's up 44% since its low and has made a very clean set of higher lows along that journey. Worth a read if you haven't looked into it yet. Very trade-able price action if that's your thing and tremendous risk:reward setup if you think the project has long term potential.


DGB TESTING 200 MAback for a test at the 200 MA
the markets offering traders many opportunities in a long drawn out test of the trend change

Bullish divergences in DGBMostly presented without comment. DGB had MASSIVE gains last time the charts were oversold like this on the larger timeframes. There's slight bullish divergence that looks like it did before reaching 13 cents. Is this too good to be true?! I mean, alts are eventually going to have to catch up, and DGB could be the perfect put since it has a LOT of room to fly (presuming it's not dead). Lots of other coins could be reaching short term limits being overbought already. This may convince me again of DGB. But still, it would probably be a shorter hodl than my LTC and BTC bags.

DGBBTC a bearish shark move | Upto 780% or more profitThe price action has formed a bearish shark from X to C leg.
Now the priceline has entered in potential reversal zone and we have pivot 1st support withing this PRZ area which will push the up to hit the sell targets soon insha Allah.
Volume profile is also showing very poor interest of traders in this area.
The targets are:
Buy between: 0.00000168 to 0.00000001
Sell targets:
Secure sell targets:
Sell between: 0.00000338 to 0.00000694
Aggressive targets:
Sell between: 0.00000808 to 0.00000969


DGB UPWARD SLOPING REVERSE HEAD AND SHOULDERSa powerful pattern is forming on DGB
bears failing to make new lows
breaking the neckline on an upward sloping H&S pattern could trigger rapid price increase
volume is exactly as needed for pattern completion.
a strong move is likely when the neckline is broken

DigiByte Price Analysis DGB / USD: Powering UpFundamental Analysis
DigiByte price is pumping after the partnership announcement with Netherlands-based company V-ID. In cooperation with V-ID, DigiByte is launching a new ID verification tool that will validate and verify the authenticity of social media profiles. The tool will also help to further increase awareness and adoption of the DigiByte Blockchain.
DigiByte / USD Short-term price analysis
Digitbyte has a bullish short-term trading outlook, with the cryptocurrency rebounding back above its 200-period moving average on the four-hour time frame.
The four-hour time frame is showing that a complex inverted head and shoulders pattern has formed, with the DGB / USD pair testing back towards neckline resistance.
Technical indicators on the four-hour time frame are bullish and continue to issue a strong buy signal.
Pattern Watch
Traders should note that the DGB / USD pair could target the November 2018 swing-high if the bullish pattern is fully ignited on the four-hour time frame.
Relative Strength Index
The RSI indicator is also bullish on the four-hour time frame, although it is starting to correct lower.
MACD Indicator
The MACD indicator is bullish on the four-hour time frame and is continuing to generate a buy signal.
DigiByte / USD Medium-term price analysis
DigitByte has a bullish medium-term outlook, with the cryptocurrency testing towards the upper end of its yearly trading range.
The daily time frame is showing that the DGB / USD pair is trapped within a rising price channel, with buyers attempting to make a much-anticipated bullish range-break.
Technical indicators on the daily time frame are rising and are starting to issue a buy signal.
DGB / USD Daily Chart by TradingView
Pattern Watch
Traders should note that if a bullish range-break occurs the DGB / USD pair could test towards the October 2018 trading high.
Relative Strength Index
The RSI indicator remains bullish on the daily time frame, although it is attempting to correct lower.
MACD Indicator
The MACD indicator on the daily time frame is rising and is starting to issue a buy signal.
Conclusion
The latest move higher has been unable to change the technical dynamics for DGB / USD pair, with the cryptocurrency remaining trapped within its established range.
If bulls can ignite the large bullish pattern on the four-hour time frame, the DGB / USD could finally make a much-needed medium-term range break.
