Digibyte


DIGIBYTE: NEW DEVELOPMENTS = 22.65% PROFIT!!!Our "Crypto Scalper" Trade Indicator has correctly identified a buy in point on the 26th of April 2018.
Using this buy in point and selling at today's price, you would have expected to net 22.65% PROFIT!!!
The increase in price may also be explained by positive developments including:
April 4: Abra the first and only all-in-one app adds Digibyte to its app (Abra is an app that allows users to buy, sell and store over 20 cryptocurrencies and 50 legal currencies)
April 4: OkCoin (Korean cryptocurrency exchange) adds support for Digibyte.
April 6: Exodus Wallet adds Digibyte support.
April 14: Proposal that Digibyte will fund David Hay's Cúcuta humanitarian project.
April 18: South African cryptocurrency exchange Artis Turba adds Digibyte to its list of tradeable cryptocurrencies.
April 25: Digibyte releases their Android wallet.
April 25: Digibyte officially announces Digi-ID (integrated with their wallets). This is a DigiByte Blockchain-powered authentication service that can be used to replace username & password combinations and even 2FA. This allows users to register and login to any website or webshop with a single click or QR code scan.
April 26: Digibyte announces their IOS wallet (beta).
An increase is trading volume is driven by Bittrex and Poloniex accounting for 46.61% and 23.27% respectively.

DGB ProposalDGB strong resistance at 500 sats. We should see a small retrace to the fib line before breaking the 500 sat mark and breaking out.

DigibyteI looking for new cycle of DGB
Storng News
litepal is in some capacity involved with #DigiByte & DigiByte Foundation.
LitePal is a free platform and service for merchants and buyers to transact without the clutter and complexity that would otherwise be associated with accepting, sending, or receiving cryptocurrency.
twitter.com

DGB the sky is the limitPrepare for liftoff on this one. Digibyte has broken or is in the process of breaking an almost four year down trend line. It depends what time frame you view the chart to tell if the trend line has broken. I am using a weekly in this chart but on the daily it looks to be breaking the downtrend today.
I expect a retrace up to 0.00002 BTC at least. The time frame I am looking at is by August or September. In US dollar terms it would put DGB between 0.20-0.40 depending on if BTC is closer to $10,000 or 20,000. That would put DGB's market cap somewhere between 2-4 billion.
In my opinion Digibyte is one of the most undervalued coins out there. I would look for large corporations to start investing large sums into coin specific blockchains going forward, if these corporations want to stay relevant. DGB would be an ideal candidate for an investment by a large firm.

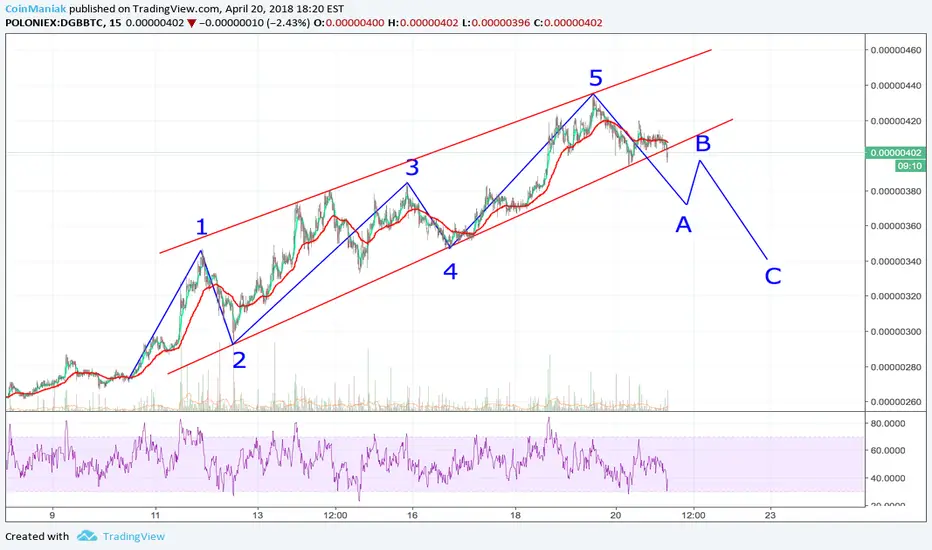
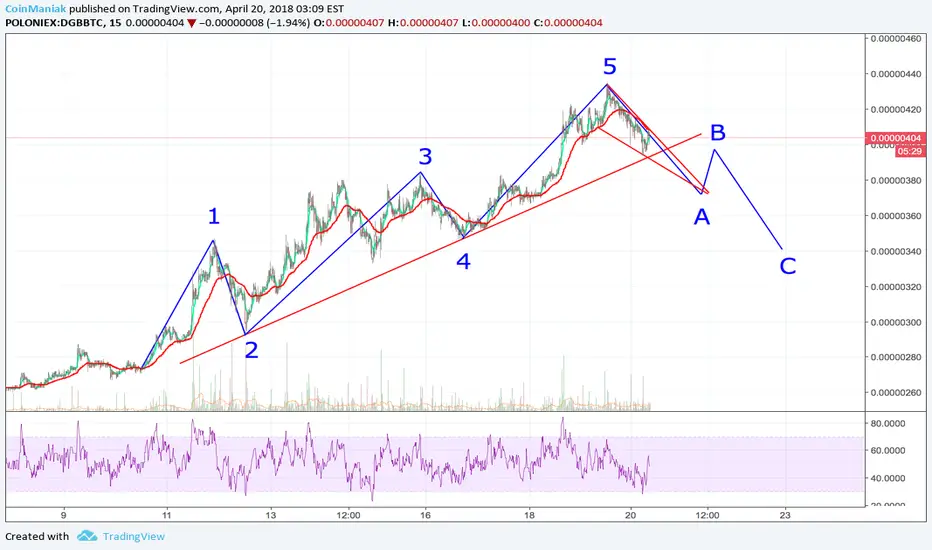
Wave 5 is coming!DGB ( Digibyte ) tested 363 sat level as support and we believe Elliott Wave 5 is happening now!
363 sat level is also 0.618 Fibonacci Retracement, measured from wave 2 bottom to wave 3 peaks, 0.618 is a golden number of Fib Retracement and Elliott Wave 4 relation.
Bounced perfectly from that.
BUY ZONE
0.00000370 - 0.00000390
SELL TARGET
T1: 0.00000467
T2: 0.00000549
STOP-LOSS
0.00000349
If you find this idea helpful, leave a like, comment and follow us on Tradingview & Telegram!
Any questions? Want to get these ideas first? Feel free to DM.

Digibyte | DGBBTC Don't need to make professional charts. Just draw lines that can make us happy :)
Please always DYOR!


Digibyte is above the rim of its picture perfect cup & handledgb has formed a picture perfect cup and handle and has broken above the rim/neckline...if it closes the current 4hr candle above the neckline then I think it's ready for blast off. Also take a look at the volume boost on it on the last 4 hour candle...explosive.

DGBUSD , DigiByte would probably begin a new uptrend !!DIGIBYTE/DOLLAR
Technical analysis:
DigiByte/Dollar is in a range bound and Beginning of up trend is expected.
The price is below the 21-Day WEMA which acts as a dynamic resistance.
The RSI is at 39.
Trading suggestion:
*The price is in a range bound, but we forecast the uptrend would begin.
*Price is in the Buy Zone (0.023 to 0.011), we would set orders based on Price Action and expect to reach short-term targets.
Beginning of entry zone (0.023)
Ending of entry zone (0.011)
Entry signal:
Signal to enter the market occurs when the price comes to "Buy zone" then forms one of the reversal patterns, whether "Hammer" or "Trough" , in other words,
NO entry signal when the price comes to the zone BUT after any of reversal patterns is formed in the zone.
To learn more about "Entry signal" and special version of our "Price Action" strategy FOLLOW our lessons:
Take Profits:
TP1= @ 0.031
TP2= @ 0.037
TP3= @ 0.049
TP4= @ 0.068
TP5= @ 0.089
TP6= @ 0.109
TP7= @ 0.136
TP8= Free

We will soon see an opportunity to buy in DGBUSD . Be ready!Technical analysis:
DIGIBYTE/DOLLAR is in a downtrend and Beginning of up trend is expected.
The price is below the 21-Day WEMA which acts as a dynamic resistance.
The RSI is at 37.
Trading suggestion:
.The price is still in a downtrend in the market, but we forecast the uptrend would begin.
.There is possibility of temporary retracement to suggested support zone (0.023 to 0.008), if so, traders can set orders based on
Price Action and expect to reach short-term targets.
. Beginning of entry zone (0.023)
. Ending of entry zone (0.008)
Entry signal:
Signal to enter the market occurs when the price comes to "Buy zone" then forms one of the reversal patterns, whether "Hammer" or "Trough" , in other words,
NO entry signal when the price comes to the zone BUT after any of reversal patterns is formed in the zone.
To learn more about "Entry signal" and special version of our "Price Action" strategy FOLLOW our lessons:
(We have started to prepare these lessons in TradingView. If you want us to continue, give us feedbacks!)
Take Profits:
TP1= @ 0.037
TP2= @ 0.049
TP3= @ 0.068
TP4= @ 0.085
TP5= @ 0.109
TP6= @ 0.136
TP7= Free

DGBUSD , weekly update:Total profit 6764220 in 27 days.!DigiByte/Dollar
New trading suggestion:
*The price is in a range bound, but we forecast the uptrend would begin.
*There is still possibility of temporary retracement to suggested support zone (0.023 to 0.011), if so, traders can set orders based on Price Action and expect to reach short-term targets.
Beginning of entry zone (0.023)
Ending of entry zone (0.011)
Entry signal:
Signal to enter the market occurs when the price comes to "Buy zone" then forms one of the reversal patterns, whether "Hammer" or "Trough" , in other words,
NO entry signal when the price comes to the zone BUT after any of reversal patterns is formed in the zone.
To learn more about "Entry signal" and special version of our "Price Action" strategy FOLLOW our lessons:
Trade Setup:
We opened 8 BUY trade(s) @ 0.02017274(day close price) based on the reversal candle (Hammer) at 03.18.2018.
Total Profit: 6764220
Closed trade(s): 1082726 Profit
Open trade(s): 5681494 Profit
Closed Profit:
TP1 @ 0.031 touched at 04.13.2018 with 1082726 Profit.
Open Profit:
Profit for one trade is 0.02828916(current price) -0.02017274(open price) = 811642
7 trade(s) still open, therefore total profit for open trade(s) is 811642 x 7 = 5681494
All SLs moved to Break-even point.
Take Profits:
TP2= @ 0.037
TP3= @ 0.049
TP4= @ 0.068
TP5= @ 0.089
TP6= @ 0.109
TP7= @ 0.136
TP8= Free
Technical analysis:
DigiByte/Dollar is in a range bound and Beginning of up trend is expected.
The price is above the 21-Day WEMA which acts as a dynamic support.
The RSI is at 64.

Digibyte | DGBBTC CorrectionExpecting a correction to 350 - 360 sats.
After this we go to 580 sats, if bitcoin can stay above downtrend line.
Please always DYOR !

BTC/USD - Probable Pathway Into The Summer, Fall, Etc.This sort of goes along with the feel of my earlier Digibyte analysis...(Which by the way is an awesome coin, with a lot of potential technically and fundamentally. See my old analysis for details.)
1. Tip For Investing In Cryptocurrencies
Before I get started on my analysis, here is a tip...
Keep a clear head while investing/trading in crypto. Don't shout moon or doom and don't get trapped in the echo chambers of Trading View, Reddit, Twitter, etc. Pull your head out every now and again. Zoom out. Keep yourself calm and collected. Control your emotions. Trade what you are seeing in the charts, not what you are feeling in your heart.
2. The Analysis
Ask yourself an important question first and foremost. Do you really believe that Bitcoin could provide a global storehouse of wealth for the entire world to come over the next several years? If your answer to that is yes, then rest assured that the price trajectory for Bitcoin is up. (If your answer is no, then you are probably looking for further opportunities to short, the time for which has already passed in my opinion until possibly the end of summer.)
So, to get to the point, this is what I see...
I see Bitcoin potentially forming a cup and handle right now. The finishing of the cup would provide a triple top for Bitcoin around 11,200 - 11,400. At that point, I believe Bitcoin won't be able to make it through in one push, and will correct slightly to form the handle of the cup (and test the support currently building around 9k) before trying again for that top, where it will ultimately break through. Taking into consideration the height of the cup (basin to the top) and placing that height into the basin of the handle, the total length would eventually take Bitcoin to roughly 14k. Here at this point I think a lot of sellers will come out of the woodwork to take profits to pay taxes for the extensions they filed which are due in October (15th), as well as those who had bad entries earlier in Bitcoin just trying to break even as they now fear from this past brutal correction that this is a potential bubble and do not ultimately believe in the technology.
This correction could last through the end of the summer and into the fall, and depending on the severity of panic (people again doubting their investment and believing Bitcoin is on its way back to 3k for sure this time) could test the 1st or 2nd trend line. My primary count would be a correction to the 1st trend line, but again, taking into account the amount of FUD that currently exists in this market, I would not be surprised or even flinch at seeing it test the 2nd one after a brief bounce off the 1st. Ultimately, my trading plan for the year sees Bitcoin returning to all time highs, if at very least testing close to it. Of course, do your own research, try charting your own course. These are just my own personal thoughts and interpretations from what I am currently seeing in the charts. Take them with for what they are worth and take them with a grain of salt.
3. What Does This Mean For Digibyte?
Taking into consideration my previous analysis and the conservative approach to the satoshi value of Digibyte mid-summer, let's assume that Digibyte does reach ~960 and that Bitcoin reaches 14k. That would put Digibyte roughly around .12-.14, near or close to its all time high. For those who found entries around .02 - .04, I would seriously consider taking profits above .10.
That's it and good luck!


Digibyte vs Bitcoin - Digibyte set to come out on top... for nowWelcome to heyitskolin's analysis of DGB (Digibyte) and BTC. This is charted using the four hour chart on the logarithmic scale.
Ok, so from 10th of April DGB seems to have finished it's consolidation phase that began around the 19th of March forming a new uptrend channel (dotted black line). Accumulation Distribution has been increasing adding strength to this new uptrend channel (Note: for those of you learning, An uptrend in the Accumulation Distribution Line reinforces an uptrend on the price chart and vice versa – one of the many uses for the accumulation distribution indicator).
Aroon Up is high, whilst Aroon Down is flat to the floor, adding further confirmation that the new uptrend is valid; whilst the 200 EMA is also supporting this view.
Now it is worth noting the MACD has just crossed over bearish and we have fallen below the EMA 12. Therefore the latest emerging candle is looking to now test the bottom of the uptrend channel. I am not worried about falling through the bottom of the uptrend channel at this point in time as we have the EMA 26 as support whilst (at the time of writing this) also having a bullish doji star emerging in the 15 minute chart (these patterns are usually of medium reliability). The area we are now testing has also previously been confirmed as support back around the 8th/9th of February. Therefore, I think the next valid price action would be for a bounce off the bottom of the uptrend channel and provided this occurs (seems likely) we will then have a free run through a lack of resistance to test the 38.2% Fib level.
Trade safely, and as always DYOR.
Cheers
