Digibyte

Digibyte - Elliott waves says this is a 17x coin potentialWave 1 on a weekly scale is (almost) done, as it did a 5-3-5 correction pattern which is very common with altcoins. Elliott wave theory says wave 3 is usually 1.6 times the length of wave 1 (or higher) so at the current price this would be 17x potential! Definitely watch this one over the next 6 months.

DGBUSD up to 500% Profit until June 2018 - Premium Signal Hello dear Traders, newbies and Followers!
After we pointed out a scam in the comment section in one of a so called "Top Autor" he informed the support about a violation of a House Rule and as result all our previous Trading Ideas have been disabled and are invisible for ever.
(Promoting a different Channel then our TradingView Account, can't tell exactly because this would violate the House Rule again)
Just our last two Predictions that have been disabled brought our Followers and Subscribers up to 110% Profit within only 3 Days, if you want to see a Proof see our Signature Text below, follow the Link and check our latest Predictions for these Coins.
Just try to not get fooled by Top Autors on Page one who basically never make any Predictions! Giving 5 to 10 possible outcomes and update every 15 minutes is not a Prediction, they are just commenting what the current Price is doing, even a newbie can do that.
And giving 10 outcomes so that you can literally not be wrong and then shout out that you called it is hilarious.
With that sad, back to this fresh new Trading Idea: Digibyte - US-Dollar (DGB-USD)
We try to keep this short why we think that this coin is a safe bet.
This is a very nice underrated Coin traded on nearly every Exchange out there (!) were we can expect a massive Profit within a short time.
An upcoming DigiByte hard fork that will change some of DigiBytes Mining algorithms to maintain GPU friendliness (June 2018).
Its a mineable coin were only 50% of its supply circulating till now also No ICO, Pre-ICO or premine has happent with Digibyte.
Huge Potential because this coin was already worth 1$ and history always repeats itself when its about Crypto.
Even if we could see Profit above 1000% with this Coin, we stay realistic and expect a gain between 100% and 550% Profit until end of June.
BUY ZONE:
0.00000250 to 0.00000275 DGB/BTC
TRAGET:
1. Target 0.00000375 DGB/BTC
2. Target 0.00000625 DGB/BTC
3. Target 0.00001250 DGB/BTC and above
Good Luck and Enjoy your Day
BitcoinSector Trading Group

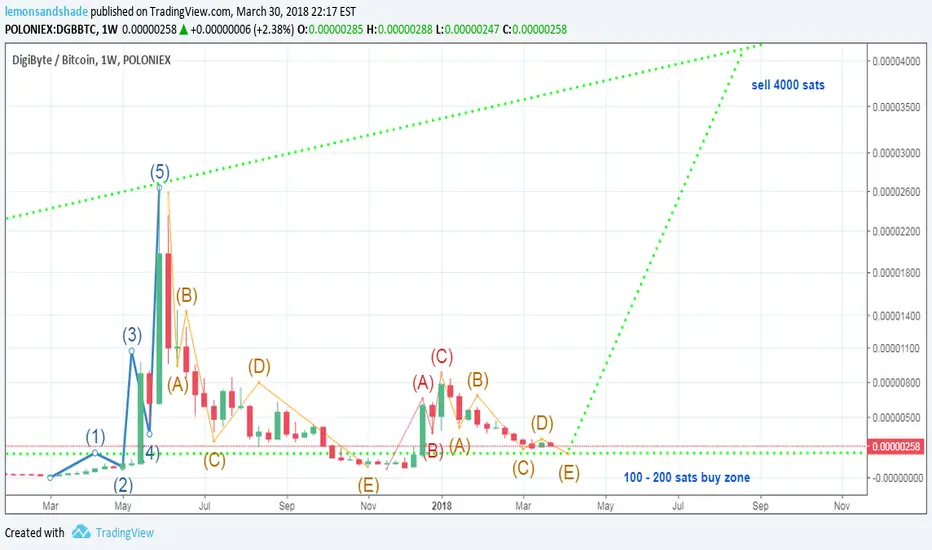
Digibyte - few weeks away from a possible great trade setupIt appears DGB is doing 5 - 3 - 5 elliott wave corrrection pattern, and is possibly making it's final move down to 200 sats zone. Buy 100 - 200 sats, sell 4000 sats.
Either way, buy or sell you better read!Set up on it's way! this post is going to do 1 of 2 things for you! It's a must read and I had no choice to post it as a lot of you are already in this trade it's running high volume and just hit a low from back on the 22nd December.
Let's get in on how to trade this DGB
You see the triangle with the black dotted lines, when in this formation if you every get a break in the first 2 thirds of a triangle it will either be a high momentum coin, false break out or plain manipulation. You will see we have already had one of these but whats important to us is what happens in the last 2 thirds of the formation which I've highlighted in red.
As you've seen in the past I have posted similar set ups, these are my favourite as it's win win for all parties that read this post. We don't enter or sell until we get a break so we have no risk.
If we break low of the triangle and close below it's a immediate sell if your holding DGB. If we break high it's a buy and we advance to green targets.
Now right at the moment this coin is losing momentum as you will see with the black dotted line drawn on the RSI, this would tell us we will break low.
We need momentum to bounce back for the move to break high However volume is there and looks good so there is a chance we can break high we would of lost momentum with the false break out at the start of the formation many people would of stopped trading this coin over that. So we need to watch this because if we break high we are looking at a healthy ROI that I won't be saying no to.
Let's hope this coin breaks high, if it doesn't it has a long way to fall as the next support is a fair way down. If we do take off please keep an eye on the BTC as it will affect trade you can hold through the BTC move or if have notice and in profit best close some of your position. I am going to post another article with exactly what to do when BTC has a sharp move. This will fill your pockets.
Cash Is King! Let's make some today!


DGB. Sleeping Giant awakens?Coin of the day is DigiByte.
DigiByte’s supporters call DGB coin a sleeping giant of cryptocurrency. The coin exists more than three years now. Founded in 2014, it’s part of the older class of cryptocurrency projects, focusing on improving security, decentralization, and speed.
Lately, the coin started to gain upward momentum and drawing a bottoming pattern. Today DGBBTC has already broken all Bearish Trend Line resistances; this breakthrough was supported by high volumes.
Despite the bearish global picture (overall, the coin had a massive fall), recent bullish signs could point on the beginning of the bottoming and beginning of the new bullish cycle.
From below, the 0.0000275 support is crucial and should hold for the further uptrend development.
From the upside DGB will have a lot of obstacles, the nearest ones are 0.0000035, 100-days EMA and 0.00004 levels.

HAMMERHammer
The market has been in a downtrend, so there is an air of bearishness. The
market opens and then sells off sharply. However, the sell-off is abated
and the market returns to, or near, its high for the day. The failure of the
market to continue the selling reduces the bearish sentiment, and most
traders will be uneasy with any bearish positions they might have. If the
close is above the open, causing a white body, the situation is even better
for the bulls. Confirmation would be a higher open with yet a still higher
close on the next trading day.
*DISCLAIMER*:
I am not a financial advisor nor am I giving financial advice.
I am sharing my biased opinion based on speculation.
You should not take my opinion as financial advice.
You should always do your research before making any investment.
You should also understand the risks of investing. This is all speculative based investing.


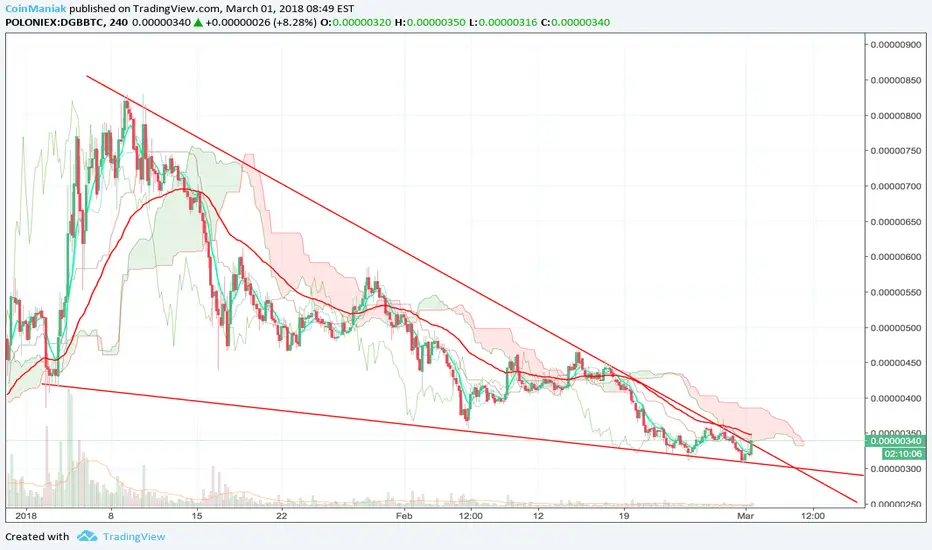
Digibyte | DGBBTC - Neckline of a Head & Shoulder is broken!Neckline of a Head and shoulder pattern is broken. Target is +/- 245 sat. That's the support of a big falling wedge!

Digibyte Trade Idea (Retracement almost done, then ATH cycle)Digibyte Mid Term Idea
As I've posted an idea about this one earlier, I'd like to update this one.
Sometimes you're right, sometimes you're wrong. Sometimes you'll need to analyze a little more and that's with this one.
Updates since the earlier posted chart from 22 February:
The retracement zone is getting close. If you want to make a long swing on this one, I'd say it's about time to buy this one. Still thinking we'll reach somewhat good heights.
Wave towards 900 is done. Currently retracing and didn't finish retracement as you'll see.
Expecting that retracement will be towards 220-240 zone.
Then some accumulation and then we're off towards 1400-1500 sats.


The DGB tries to hold the SupportThe DGB tries to hold the 300Sats level. If this support level is broken then we could see another leg lower with the DGB sliding down to the 140Sats level. The reason I am mentioning this is because BTC surged higher on Saturday with big volume as traders start to anticipate this drop. If the DGB price starts to drop, then holding BTC may be the best safe haven.
3-Day Chart:
From the chart, it looks like the DGB trend may fall through weak support level and test the next support at 140-150Sats, I think it will be several weeks before we see such a test. The falling volume is a concern. If volume can rise above the monthly average, it is a good sign that price will test the weak support before the uptrend can start.
RSI is below 50, a sign of the downtrend. The MACD turned down through the centerline, a sell sign and it is still trending down, which is a negative sign. In addition, the EMA lines put pressure on the DGB price, as well as 20EMA and 50EMA can make a death cross soon, which will be the sign of the strong downtrend.
1-Day Chart:
I can't say it's a different chart, but the daily card a copy of three day chart, 20/50/100EMA is a resistance lines, the RSI is below 50 level, it's sad :( and the MACD below centerline without any positive sign on the horizon to bounce from the first support at 280Sats area.
4-Hour Chart:
Volume has been trailing off, which is not a good sign for the price to keep going up. Watch for above average buying volume as a sign the DGB price will start it's up trend. Otherwise, we should expect a pull back.
RSI is below 50 indicating the downrend. The MACD is at a low point, so the price need a spike to end the correction and start it's uptrend
My concern is that most people seem to think the markets had bottomed, and if that's the case, everyone should be long right now. If the markets continue this downward slide a few more days we could see prices drop very quickly as I mentioned above. I would rather see the trend flatten more or start to head higher before I take long term trades to the long side.

DGB/Dollar Prediction to AugustThis is my first ever chart, I have set up elliot waves with fibonacci ratios.
Technical Analysis:
Degree of trend: Intermediate
I believe we are in the midst of a wave 3 with subwaves 1 & 2 complete.
Ending Diagonal Triangle in SUBwave 2 similar to wedge in wave 2 which is caused current wave 3 * Drawn (Orange A,B,C,D,E)*
Fundamentals:
Longest UTXO Decentralized blockchain in existence.
Most secure blockchain with 5 mining algorithms.
Fastest decentralized on chain transaction time @ 15 seconds. (560 TX per second)
Has the most full nodes online @ over 190,000.
Just recently hired PR Marketing firm.
First blockchain to use Segwit from GUI wallet.
DigiShield & DiguSign technology.
Mobile wallets (Android & iOS) + Exodus wallet almost ready to be released.
One click miner also close to being deployed.
Huge community with loyal following.
READY FOR MASS ADOPTION !
**I am personally expecting the gains to be more than I displayed on this chart, especially with how crypto's have been going. I am seeing that crypto's are really more favorable to wave 5 being the extended wave as opposed to the usual wave 3 (in things like commodities). But for this being my first ever chart and publishing it, I played it more conservative and stayed true to the ebb and flow of elliot waves & fibonacci. I am also going long with this coin, a true long term hold definitely into 2020) WISHING EVERYONE PROFITS !
TIP JARS:
BTC:
32mUo9cXTASM5C8wscKzwkvps3bvKiGjJ5
DGB:
DDMJeNRwDRpnTHn2rxfCYN1wn4anoBqEmT
LTC:
LVcKwbsATpBUjAW3dvnp7WBAdAuio1m3un
ETH:
0xAC6f867DdB1F2c26ffebdf16B6bd187d04fDd6B1
ETC:
0x37f55ef94AE2669f9E12A967805016012d2135bd

DGB WILL GO BACK UNDER <100 satsHere are my thoughts on one of the most undervalued cryptocurrencies
Digibyte DGB, is a very fast/cheap multialgo cryptocurrency.
It got a lot of expectation back on May 2017 when it was some leak/lie? about minecraft integration . It went from 70 sats to 2000 sats in 2 months , but, after that event, bad news become real and a lot of DGB were stolen from this kind of integrated game platform wallet mixed with a no fully team support at that time.
My chart is about how this year it will come to <100 sats, a really possible scenario, compatible with a long BTC run in 2018, DGB on 2017 was stable between 0,005 $ - 0.0030 $.
As we see on the chart, the support level goes 10-20% everytime DGB has a bull run (2-4 months) that means the big Wales, or DGB foundation, or anyone with a big bunch of coins is losing their support power,A change of owners, a end of a cycle.

DGB-BTC killer hodl for 2018, 189% ++ profit potentialHowdy, let’s take a look at one of my favorite picks for 2018, Digibyte (DGB).
Fundamental drivers:
Marketing Overhaul Begins Feb 1: www.reddit.com
Details:
With over 100,000 full nodes (compared to BTC's 11,000), Digibyte is highly decentralized. Digibyte uses five separate mining algorithms to ensure mining decentralization. It’s also one of the oldest blockchain projects out there (2013), with early SegWit implementation. It offers super fast transactions.
For those who know da woo, Clif High’s web bots have found hints of a “minor mania” for Digibyte in the summer of 2018. Considering the man’s accuracy up until now, I’m more than happy accumulating DGB at these current levels. Now’s a killer time to be shopping.
Official website: www.digibyte.io
—
Analysis:
DGB has respected a global Fibonacci range ever since the enormous run-up in the summer of last year. I would argue that it is now in a good range to begin some harmonic kind of movement, but first let’s establish some congestion zones and look at the Ichimoku.
The Ichimoku cloud is lining up almost perfectly with this Fibonacci range.
The Higher lows in price and lower lows on the RSI indicate hidden bullish divergence, while declining volume and a symmetrical triangle forming with the 50 and the 200 MA are creating a solid base for a sort of bull flag. It could be a pennant and will need more time to consolidate. The Ichimoku cloud has flipped bullish just as there was a golden cross of the MA’s a week or so ago. Here I see a pattern similar to some other reputable projects out there — en edge-to-edge cloud break, followed by a retracement to the top of the cloud, and then the establishment of a new price floor. Bulls would be careful, however, as it is beginning to look like a head and shoulders pattern. Now all of this may be difficult to see at once (unless you’re as bugged out as I am), but I also see what could be a bullish pennant forming in the RSI. Bollinger bands included to show how tight the price is getting.
Here’s the triangle using the 200 MA as the base. Long term I see a lot of upside for DGB, though it may end up consolidating for many months so I’m not so interested in it for swing trading. Below are your levels indicated by blue horizontal lines.
These targets are primarily based on the Ichimoku, the global Fibonacci range, and previous congestion zones discovered around those areas.
Entry: 0.00000355 - 479
Target 1: 0.00001074
Target 2: 0.00001383

Digibyte | DGBBTC breaks out of a falling wedge!Digibyte breaks out of a falling wedge and volume is showing.
Digibyte above 800 sats between 2018-05-01 & 2018-05-09Digibyte above 800 sats between 2018-05-01 & 2018-05-09


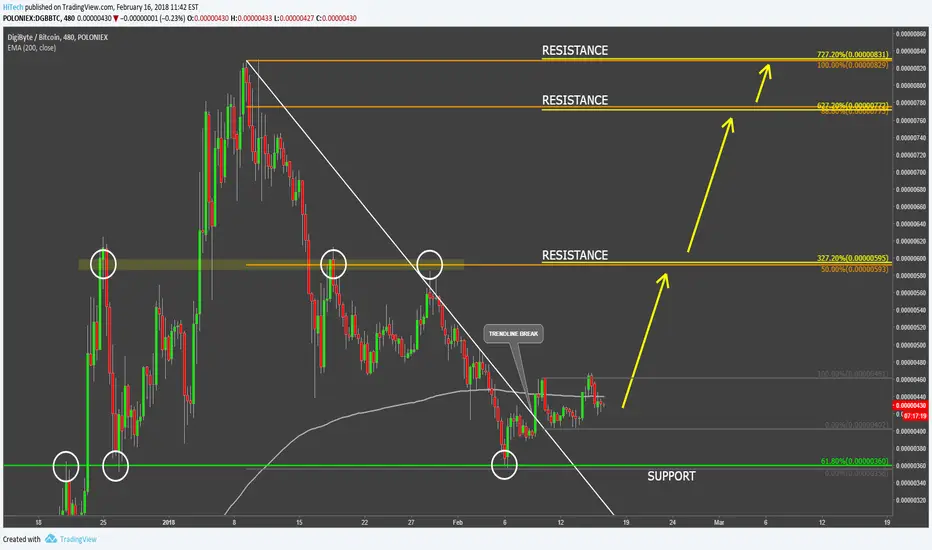
DigiByte VS Bitcoin Signs of ReversalDidiByte found the resistance at 830 satoshi and corrective wave down started, resulting in a 56% loss to the Bitcoin. The decline of the DGB/BTC price was stopped by the 61.8% Fibonacci retracement level applied to the 07.12.17-10.01.2018 wave up.
After the clean rejection of the Fibonacci support, the price went up and broke the 200 Moving Average and the downtrend trendline, suggesting the potential change in the medium term trend. Although range trading could be extended a little longer the growth potential remains. DigiByte is expected to rise towards one of the 3 resistance levels confirmed by two Fibs.
First resistance: 600 Satoshi
Second resistance: 770 Satoshi
Third resistance: 830 Satoshi.
If price will break above first resistance is will become very likely that DigiByte will produce a double top, hitting the area between 770 and 830 sats. Daily break and close above the 830 sats resistance should confirm a long-term uptrend. On a downside. Daily break and close 360 could invalidate bullish outlook.
What do You think? Verge VS DGBHello Traders!
I have found a suitable comparison. Generally speaking, history repeats itself and the price always comes back. To be honest, we all love something new, for example, we need to change cars once a year or fly to different countries, in the case of DGB and XVG, I can safely assume that we are dealing with one major player in the market who likes to change things once a year.
Let's start the analysis. In the last few weeks XVG showed a weak downward trend. The RSI was below 50, bears in the market, the same trend is confirmed by the MACD which is now below zero. In the next few weeks, I expect that the Verge will be traded at 750-700 Sats, and then smoothly reach its fair price the same as DGB did. I will follow the daily schedule closely, because I'm very interested in whether the coin price can break through the center line (MACD) and how strong the trend will be, how rapidly will the market move within this trend.

