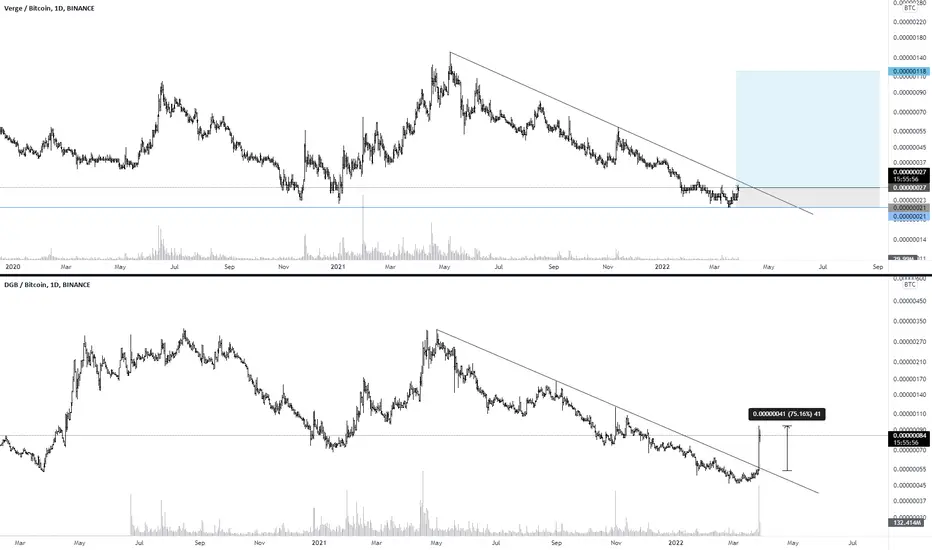
DigiByte vs Bitcoin Updated (What Happens To Those Who Hold?)We were expecting a drop to around 40 sats or the 0.618 Fib. retracement level for DGBBTC.
It hasn't happen which doesn't mean it won't happen but since it isn't happening something else is likely to happen.
As long as DGBBTC stays trading above EMA50 the probabilities are in favor of a new high happening...
But we still have the 40 sats level as immediate support.
Here we are mapping 70 to 81-sats as target but there can surely be more.
Whatever happens, DigiByte has been with us since the beginning and is likely to stay with us for the long-run.
Good things happen for those who buy and hold.
Namaste.
Digibyte

DigiByte Higher Low Mapped (Next Target +75%)Right now we can see DGBBTC trading above EMA50; this is the main support.
From this level DGBBTC can move up but further correction is more likely/possible.
On a further drop, we are mapping where support will be found.
We say a range between 37 and 40 satoshis (0.00000037 - 0.00000040).
From here, a higher high to follow.
You can see additional details on the chart.
Higher potential for growth when we consider the long-term.
The 75% is only short/mid-term.
Namaste.

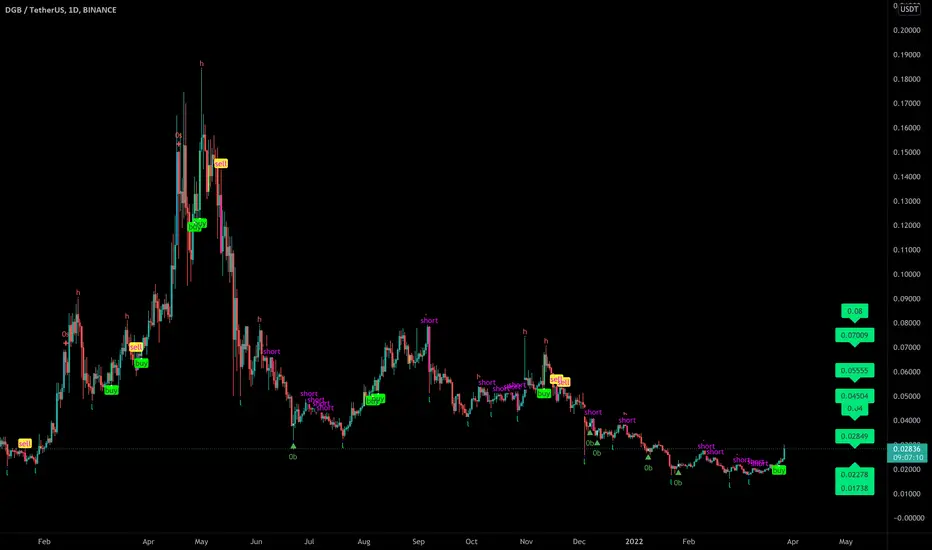
DGB/USDT 88% upward Potential if hold This Support#DGB Technical Analysis:-
#DGBUSDT Bear Flag Forming in Daily Time Frame.
But Target Depends On Breakout So Never Do Hurry.
I am Expecting Upward move but Exit If Below $0.01
Upside Breakout Target:- $0.026
BreakDown Target:- $0.006

$DGB $DOGE FRACTAL COMPARISONthe fractal for dogecoin seems to be pointing the way for DGB
the fib extensions for DGB are phenomenal
It always helps that no one seems to think there is any possibility that DGB will blow up.... just like no one (including myself) thought dogecoin would ever break out
time
will
tell

DIGIBYTE DGB USD Update: Previous prediction still Stands $14My previous prediction on Digibyte still stands. I still this as a sleeping monster, Digibyte is going to melt your face when it takes off! One of the oldest and most practical cryptocurrencies that work, for pretty much everything. When governments and institutions look for a project to invest in or implement into their company or government they will look for something that has some serious legs. Digibyte has stood the test of time and has proven itself over and over again. The network security is top notch, extremely efficient and fast both in transaction speeds and mining, and it, and its uses are endless. This project is going to explode in the near future and I am confident in that. This is not financial advice just my opinion. Thank you and follow me if you find this content useful. Good luck out there.

DGB DGB Technical analysis basically on elliott waves Principles and Priceaction Strategy
DGB can be Grow Fastly
Wait and watch.

DGB 3 day chart looking Fantastic!DGB 3 day chart looks to make a move
upward. DeMark 9 reads we may of hit
bottom. Look at the yellow line price targets
on the right and look for DGB to make a
retracement move up to the Golden Pocket.

XVG to follow his friend DGB ?In an early Bullrun, DGB and XVG tend to move together within a few days apart.
DGB pumped +75% in 2 days.
We are looking to see what XVG can do when it breaks the trendline.
Digibyte... Is the monster wave coming?I'm not going to say much here, I'm simply following the cycle for Digibyte. We are 4-5 bars short of a major breakout if the cycle is to repeat . One bar on this chart is equivalent to one week.
In my opinion it's been following it to almost perfection. I'm not saying this is a guarantee, it's simply an observation.
Enjoy and have fun investing.

Resistance coming next week?What do you think of the analysis? Lots of coins moving in this pattern. I think GALA broke out of this patterns

DigiByte Coming Out Of A Strong DowntrendHere we can see a very strong downtrend that started in April 2021... One year ago.
The downtrend ended in March (last month) and we see a strong breakout followed by a retrace with prices now moving weekly back above EMA10.
We also have the harmonic pattern... Honestly, I don't know how it is called but this pattern works most of the time... It is pointing up.
See the chart.
Thanks for the support.
Namaste.

DGB daily looking to light some fireworks?DGB daily is looking like we may see an end to this bottom
and ready to start making some substantial moves and bring smiles to thousands of wallets!
when Digi busts thru this orange circle, it will rock roll!
So this orange circle represents the only area of significants to this chart....why?
we have the Hull suite Indicator to break thru, the 50/100 ema to break thru,
the bull Market Support band to break thru...and last but not least,
The DeMark 9 Indicator is reading we have hit bottom a few days ago with a 80% probability...
lets watch what this powerful security company that is loved by millions of Investors will do in the coming 2-3 weeks,

DigiByte Confirms Feb. Support (300%+ Potential)Back in February DGBBTC (DigiByte) hit 46 satoshis and a long lower shadow.
Nothing came out of this candle (24-Feb.) and prices moved back down to retest this level.
4, 5, 6 and 7 March this same was tested again as support and holds...
We are now seeing a break above EMA10 and resistance being challenged. This signal tells us that this pair is trying to break up.
We have a very small cup pattern but the trading volume is still low.
Conclusion
Any trading above 46 satoshis (0.00000046) and the doors are open for a bullish wave to show up.
On the other hand, if this support level breaks, DGBBTC will chase after a new low.
You can find the targets with additional details on the chart.
Namaste.

DGTX IS READY FOR MEGA PUMP....I am not kind of a trader who put his money on hope. Although i got good returns on SHIBUSDT by doing so. Having hope is not bad, but combining with strategy will make it benificial.
If you are new or old to trading business, you might hear Trade the fear and buy the rumours and sell the news.
Coming to DGTX and it's falling price. Is it over?
The answer is yes, in recent news its considered to be safest investment for good returns.
Technically a huge RSI bullish divergence is spotted in DGTX. In the same time a huge volume in single candle is a clear sign of fake dump and mega pump to atleast 50-80 percent in upcoming weeks.
Time is now buy this penny project for mega return.
Hold till April.
Invest around below the volume pivot line.

Digibyte nearing an Adam and Eve double bottom breakout.Neckline still resistance for now. May need a slight correction before confirming a breakout above it. Definitely one to keep an eye on.

DigiByte vs Tether Will Also Grow Strong (140%)We know that DigiByte and Siacoin move together...
We know that both DGBBTC and SCBTC are both bullish right now.
We already looked at SCUSDT recently and we have left DGBUSDT; here it is.
Chart Signals
We have the "Adam & Eve" pattern which we looked at before.
We also have other bullish signals, like the reversal candle February 24.
We also have a bullish cross of EMA10 and EMA50 and the very strong RSI is the confirmation of this all.
The more bullish signals we have, the stronger the bullish case becomes.
You can find some targets and even support levels on the chart.
Namaste.

DigiByte Challenges Resistance (Over 120% Soul Profits)What is better to close the day than our beloved DigiByte?
Shall I read the chart for you or just tell you that "it will go up!"?
Well, I just did that one so let's focus on the chart.
DGBBTC (DigiByte vs Bitcoin) is looking good now as it closed above EMA50 yesterday.
This one has yet to start moving which is always good, I mean great... Because we like to jump in early to get the maximum potential earnings/profits on the way up.
We have the bullish indicators, the chart patterns, this, that and what not...
I am feeling so blessed right and incredibly grateful for your continued support.
Do you enjoy the content?
Is it useful to you?
You can pay me back by putting it into practice...
Make the most of it; Use it...
Become RICH.
Become financially free...
Use your newly acquired wealth/freedom to enjoy any and all the things that you want.
Remember, abundance is a natural state of your Soul.
Namaste.

Digibyte pumpDigiByte (DGB) is a highly scalable peer-to-peer digital currency that enables industry-leading transaction speeds with negligible fees.
Next Zil ?
APEUSDT No BrainerLike extremely great marketizing ,
I don't know but yet it got a shit load of volume...swings that's what i'm looking for...
and some hold aside.
Just my brain talkin to me.. OutLoud

$11 DGB DIGIBYTE POSSIBLE THIS YEAR! MANY INDICATORS POINTING UPDigibyte in my opinion is poised for an extreme upside move that will catch everyone by surprise. I show in the chart many indicators and pivot points from previous cycles with dates and percentage gains. The past doesn't always predict the future but every chart is a beast of its own and has similar movements through out its lifecycle. The same people who don't believe this target are possible probably didn't believe the last run up of multiple thousand percent wasn't possible either. See the chart above and decide for yourself. this is not professional trading advice, just my opinion. Thank you for looking, subscribe for more updates and leave a comment on what you think.

DigiByte vs Bitcoin Weekly by RequestThe low is likely in for DigiByte vs Bitcoin (DGBBTC).
All that is needed is buy and hold, long-term.
Here is the chart:
The rest is just patient, let it play-out.
If you have any questions just leave a comment.
Thanks a lot for your support.
Namaste.

DigiByte vs Tether (Good Potential 4 Growth)We have many signals on the DGBUSDT chart for the long-term, good potential.
Let's start with the weekly now:
- We have the bottom pattern (multiple).
- TD Count.
- Wave count.
Looking at the daily chart, we can see a broken downtrend while prices moving above EMA10 and EMA21.
We've been having bullish consolidation as prices creep up slowly...
We have low volume, but after 7 consecutive green candles we can say that DGBUSDT is getting ready to grow.
Namaste.
Note: Remember to have a plan before you trade.

DGB, Digibyte looking extremely bullishIm very bullish on dgb. Look at the chart we have a falling wedge big ass pennant and 3 rising valleys and hidden bullish div on the macd. This all on the weekly chart OMGGGG GOOOOOOOOOOOOOOOO
