🟢 DigiByte +100% UP ?I've been watching DGB for a while and today I've got my bag full of DigiByte.
As you can see we are broken out of a big trend line and I think we are going to be happy this month.
Follow me for more and please give me a LIKE if you agree with me.
Let me know what you think,
Thank you.
Digibyte

DigiByte About To Make A Strong Move!It is no joke when I say that "Patience is the key".
Here we have DigiByte (DGBBTC) consolidating at a low and getting ready to boom at any given time.
It can take a few days, weeks, and sometimes even months in a consolidation phase.
But not this time around though, it is likely to move up right away.
We are patient of course, that's how we trade.
We buy, hold and let the market take care of the rest.
Calmed and relaxed.
There is nothing to lose if you wait.
If prices go below your buy-in you simply hold.
If a new low is hit you simply hold.
You can only consider selling when you are ahead.
This is very simple, very easy and you can win no matter what the charts, experts, analysts or anybody says.
Here is a good one for you, DGBBTC...
Try this strategy and see what results you will get.
Set your waiting time to 8-12 months to start.
This is not financial advice.
Namaste.

2022 could be the year of small cap stocks/cryptosThe first chart shows the Russell 2000 compared to the S&P 500, hence the stength of small cap stocks. Digibyte is just an example but you see a similar picture in many pennystocks, cryptos and small cap stocks.

DGB [DigiByte]* Please share your opinion in the comments.
* This is just an idea, Not financial advice.

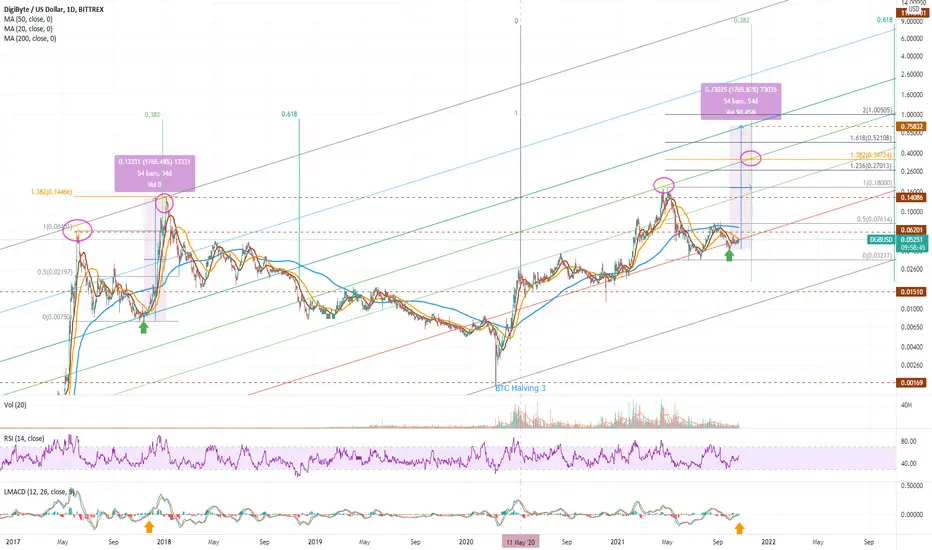
Digibyte (DGB) - Structure and TargetsTaking a closer look at the Digibyte chart in the daily timeframe and adjusting slightly for BTC Hashrate slowdown due to the exodus of Chinese miners, and the Fractal is even more strongly correlated.
What do you think? Do you have any targets for DGB?
looky looky where Digibyte is catching support!Digibyte is showing a lot of respect to the 05.8 cent to 06 cent area and in my opinion is very bullish going forward for the next couple months. Targets to come as we move forward, let's make new highs first.
Look at the historical resistance this area has played in the past and now has conquered it and flipped it to support.
Your patience & diligence will be rewarded.

The time has come or DGBAfter the btc movement it s time to release DGB. I am gonna hodl it until december.

Digibyte - Current PostureA review of the posture of Digibyte, following the completion of three corrections, printing three successively higher-lows.
In terms of Elliott Wave analysis, there are two interpretations:
DGB has now completed a Wave 4 and commenced a Wave 5; or
DGB has completed a Wave 2 and just commenced a Wave 3.
Either case is bullish and is well supported by the MACD crossing bullish and the RSI sitting comfortably in neutral territory. Looking at the the Fibonacci projection of the correction on this standard scale chart and two targets present themselves:
$0.278 at the 1.618 resistance line
$0.336 at the 2.0 resistance line
Of course there are higher levels, but they will become exponentially less likely the longer DGB remains under $0.185.
What do you think? How high can DGB rally to complete this next impulse wave higher?

DGB/USDT SELL SIGNALThe market has been tricky the last couple of weeks, providing a relatively wide range trading for most cryptocurrency pairs. However, sooner rather than later the range trading will be over. The DGB price action is much weaker than most coins, thus it can be dumped further during the next week.

🆓DigiByte (DGB) Sep-19 #DGB $DGBThe selling pressure on DGB is weakening so in next days DGB could recover to 0.065$ zone or even pump strongly to 0.08$ and 0.1$ zone. So in this period, we will keep accumulating DGB at 2 support zones : 0.05$ and 0.055$ zones. But if it loses 0.05$ zone it will fall down to 0.04$ zone
📈BUY
🔴Buy : 0.0538-0.0562$
🔴Buy : 0.0488-0.0512$. SL if B
🔴Buy : 0.0635-0.0665$ if A. SL if B
📉SELL
🔴Sell : 0.0635-0.0665$. SL if B
🔴Sell : 0.078-0.082$. SL if B
🔴Sell : 0.0975-0.1025$. SL if B
♻️BACK-UP
🔵Sell : 0.0488-0.0512$ if B. SL if A
🔵Buy : 0.039-0.041$. SL if B
❓Details
📈Red Arrow : Main Direction as BUY and SELL section
📉Blue Arrow : Back-Up Direction as BACK-UP section
🟩Green zone : Support zone as BUY section
🟥Red zone : Resistance zone as SELL section
🅰️A : The Close price of 1-day candlestick is Above the zone
🅱️B : The Close price of 1-day candlestick is Below the zone

$DGB $13.33 TOPthree wave 5 targets equal to wave 1 or 3 exceeding channel to 1.382, 1.5, or 1.618 fibonnacci
you can only get there on a rainbow ;)
not financial advice

DGB COULD POP 625% $.40 INCOMINGI think people need to pay attention to #DGB. In early 2017, $DGB had a spike, and then at the end of 2017 DGB popped 120% from the previous high earlier in the year. If DGB repeats this same pattern, we could easily be looking at a 625% increase from here on the second run up.
And that is without being listed on Coinbase, or any new partnerships or project announcements.
THIS IS NOT FINANCIAL ADVICE. PLEASE DO YOUR OWN RESEARCH.

DGB is Ready!Tested the parabolic trend line 4 times already. Strong support and its ready to enter in price discovery
I hope you found the idea interesting:)

DigiByte to $28 by 2022 | JBPredictionsW'e're in the 5th wave longterm, and 5th sub-wave shorterm. I am expecting extensive 5th wave longterm, 0.18's breakout and great exponential growth in the next months.
We can buy, add more at 0.02.
Targets: 10, 29, 53
From now, I am DigiByte holder.
See you soon!


DigiByte (DGB) formed big Gartley for huge bullish moveHi dear friends, hope you are well and welcome to the new trade setup of DigiByte (DGB) with Bitcoin pairt.
The previous chart of DGB with USD pair is still going good and will hit the sell targets soon.
Now this time on the monthly time frame chart with BTC pair, DGB has formed a huge Gartley pattern.
Buy and sell targets:
Buy between: 0.00000109 to 0.00000080 btc (because at 0.00000080 we have a very nice support)
Sell between: 0.00000189 to 0.00000273 btc
Stop loss:
The maximum extent of buying zone 0.00000080 btc can be used as stop loss. because at 0.00000080 we have a very nice support.
Possible profit and loss ratio:
As per the above targets, this trade has a small profit possibility of up to 240%, and loss possibility is only 27 %, therefore it is a very low risk and high reward trade setup.
Note: Above idea is for educational purpose only. It is advised to diversify and strictly follow the stop loss, and don't get stuck with trade

DigiByte Analysis - Bullish Weekly MACD / Monthly RSI This Is Looking Really Interesting. Price Explosion Expected This Weekend.
Entry: 0,0064

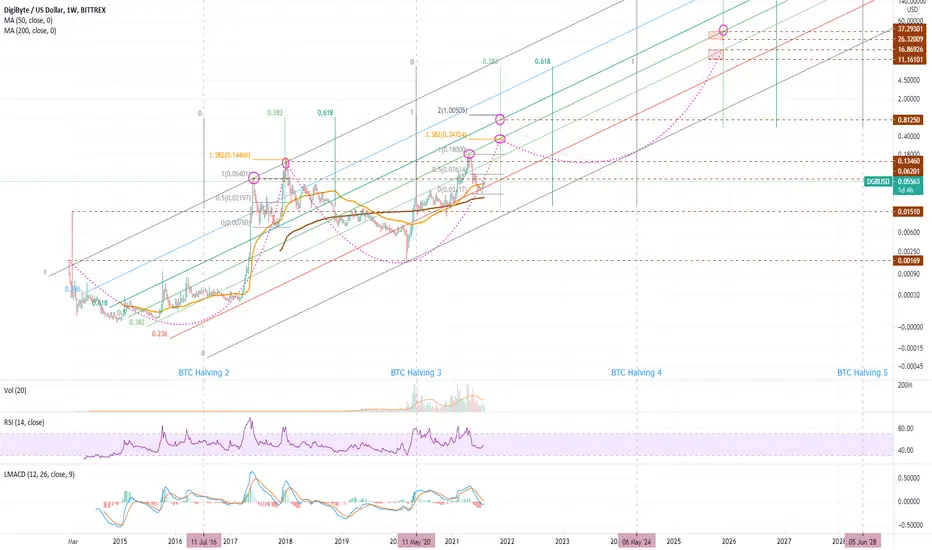
Digibyte - Past, Present and FutureIn this Digibyte study requested by a subscriber, I look at the longer term market structure of this Proof of Work crypto currency through the lens of the BTC halving cycle, assuming a continued correlation to that cycle. There are some apparent target for the peak of the current market cycle in both time and value, and future projections for the subsequent correction and future rally.
I have had to estimate the date of the 5th Bitcoin halving to align the future cycle, so I caution that there is in increased margin of error beyond the 4th Bitcoin Halving.
DGBIt had a good support level in the range of 3 cents
It is currently resisting in the range of 6 to 7 cents, which corresponds to the level of 0.236 Fibonacci trend base (in weekly time)
Surely, after the completion of the Bitcoin pullback and the beginning of the upward trend of the market, this resistance will be broken with strength. (in short-term)
-The red Ichimoku cloud is broken and the green cloud is formed
-The first shopping area can be a good place to shop
-It has good goals for the short and medium term

Possibilities of DigibyteWeekly chart with the fib retracement, and pitchfork. Lets see how this plays out.
This is not financial advice.

DGBUSD IdeaIdea for Digibyte Just making assumptions based on the last bullrun and the base formed before the bullrun began (in green)

DGB 350 MA & BREAKOUTbreaking out of the price wall of decline
sitting at the 350 MA
double bottom at long term support
continuation depends on getting above the 350 MA

