WAVES ($WAVES): Motive Wave is in the game!Imo, high propability that new uptrend started!
More details mentioned in TA.
If you like my TA, pls. hit that "Like" button, follow me or leave your comments.
Thank you!
Digitalassets

My thoughts on BTC for the next couple of days/weeks.Please as I said in the video keep in mind that this video is for educational purposes, its very far from any type of financial advise!
Feel free to comment and give me your opinion and constructive criticism.
Happy trading everybody!

BITCOIN ($BTC): 5th Extension Terminal ImpulseBTC developing potential 5th Extension Terminal Impulse.
All of finished Waves-i / ii / iii have corrective behavior and they are divided into :3 segments structure. This pattern usually occurs in Wave-C.
If this scenario is valid, the last 5th Wave would lead us to $4400 mark.
This pattern is usually followed by the price decline. In this case it should be drop down below $3400 mark.
If you like my TA, pls. hit that "like" button, follow me or leave your comments.
Thank You.

BITCOIN ($XBT): Bearish setup...target below $3000My plan B - bearish setup if current Bitcoin's pump fails.
EOS ($EOS): Looks pretty bullish!All informations are mentioned in TA!
If you like my TA, pls. hit that "Like" button, follow me or leave your comments.
Thank you!

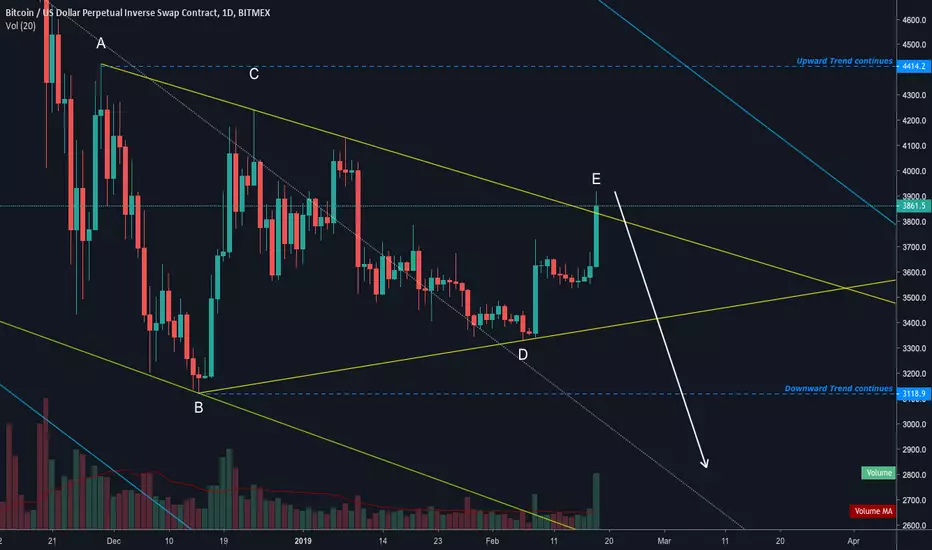
BITCOIN ($XBT): ABCDE PATTERN'LL LEAD US BELOW $3K..RE-COUNTEDBased on current price action, I re-counted my ABCDE Triangle Idea.
There is a good chance, that Wave-D hasn't been finished yet. In that case, the Bitcoin will re-test $3300-$3200 before goes significantly upward.
If you like my TA, pls. hit that "Like" button, follow me or leave your comments.
Thank you!

BITCOIN ($XBT): IN MORE PERSPECTIVE...Hi Guys,
As I can see Bitcoin, in more perspective. All informations are mentioned in TA.
If you like my TA, please hit that "Like" button, follow me or leave your comments.
Thank you!

#BITCOIN ($XBT): Corrective ABC wave to $3300-3200.My main bearish idea remains valid.
If the trend is to turn, it will be $3300 - $3200 zone.
Termination point is $3500 mark.


ZRX/USD - Definitely way more upside on this one...First analysis for the year. If I have more time, I'll try to increase the frequency of my analysis posts.
Feedback, input, and comments are all welcome!
==================================
Pair: ZRX/USD
Time Frame: 1-Day
The current trend for ZRX/USD is a weak bearish movement. Since November 2018, a descending triangle has been forming, as shown by the progressive lower highs. The current support is holding at the $0.25 zone. Price action will probably continue to stay within the triangle, but the market will be forced to pick a direction within the next few weeks (or months). If the bulls decide to break out upward, then their momentum could easily take them to the $0.45 zone (Fib 23.6%), and beyond that probably test the $0.58 zone (Fib 38.2%). However, any bullish sentiment should be taken with caution as there is still enough bearish volume to slowly push price action south, as shown by the thickness of the Kumo(Cloud) on the Ichimoku. The fact that there is still no cloud twist shows the possibility of downward movement. Additionally, on January 10, the thicker part of the cloud acted as a hard resistance and forcibly pushed the price action downward. The support at the $0.25 zone is tentative, and if broken can see the price action move south towards the $0.20 zone. Any further collapse can see the price action touch the $0.15 zone. Regardless, the general assessment for this asset pair is that there is still much more room on the upside.
For the Bulls:
There are a couple ways to play the entry points for this current market environment.
Recommendation 1-
Buy at price (up to $0.35) and wait for upward momentum.
Take Profit Targets are: $0.58, $0.68, $0.78
Recommendation 2-
Wait to see how the market reacts to the ascending triangle.
If the $0.25 support is broken via bearish momentum, then:
Set BUY targets: $0.20 ( up to $0.35 (as the bullish momentum is regained)
Take Profit Targets are to remain the same.
For the Bears:
Recommended Short- $0.24- $0.25 (zone)
Take Profit Target 1-$0.20
Take Profit Target 2-$0.15
For Rangers:
There has not been a solid ranging window in the recent history of this pair.
==================================
As always, manage your risk!
-DC
----
NOT INVESTMENT ADVICE. The opinions and analysis expressed above are strictly my own.
This analysis was sponsored by the Paribus Group (www.paribusgroup.io)

Litecoin Gonna Forming Cup & Handle?hello guys, today i'm charting on LTC/USD.
LTC/USD is just breaking the 0.382 fibonacci ratio, if the 4H candle can defend this level
it will much possible forming cup & handle pattern.
keep on eye at the volume, we need higher volume to do that, if the lower volume making higher high,
becarefull of the bull trap.
trade safe, like & share if this helpful :)

Bullish wave extrapolation What it would look like if Bitcoin is at the termination of a long term corrective wave and the fifth long term impulse wave mirrored one of the previous impulse waves. Long term Bitcoin impulse waves have taken around 3 years to complete so far, the last corrective wave took 2 years. This is for education purposes, is not a prediction.

#NEM (#XEM): Another short-term opportunity to go LONG!My thoughts on XEM! Use tight stop loss, follow your money management a pay attention to BTC.
If you like my TA, please hit that "like" button, follow me or leave your comments. Thank you!

Digital AllyDigital recording stock for enforcement sector: Aka insurance and guaranteed visual crime enforcement. Huge volume buyers noted. Play as you like.

BTCUSD: Crazy MindHi All,
Hope all your trades are going well.
It's all in the chart. Current BTC is trading within it's channel.
Be sure to Follow me and like this post if it was helpful, and thank you all.
Like the Phoenix we will rise from the ashes
Happy trading People...

LTC/USD (BITS) 20 MA crossing the 9 MA in a bearish patternThe 20-period moving average (MA) has crossed over the 9-period moving average 4x times according to daily price chart between last December (2017) and now.
Each of the 4x times, price historically followed with a decline by over 20% - one such instance (the 3rd crossing) by over 62%.
Based on the daily chart, the 20-period MA will be approaching the 9-period MA in what appears to be signaling the fifth bearish crossover.
(1)
(2 & 3)
(4)
(5?)

BTC Set Up for Rally Here is how I'm looking at the market. Could we see a gap up? Anything is possible, always have a plan for crazy. Tonight is going to be interesting.

Bitcoin Elliott Wave ExamplesNot a lot of commentary on this one. Just know that when it hits the true top, it's going to come back down even faster, with frightening speed. Watch carefully and you'll know, listen to your gut when it tells you. Only the strong shall survive, it WILL crash back down again, and the cycle shall rinse and repeat. History tells us that. This is simply the nature of the market. Bless you all.

DGD/BTC CnHLooks like a no brainer to me.
It's current value is higher than when BTC was at an ATH so it may be inversely proportional to BTC's preformance
Large Cup and handle forming and it's already in an uptrend.
Set your stop-loss and some high sell points incase of spikes similar to previous ones

EOS/BTC: Will we see further downside?Hey guys! As you can see, EOS has been in a steady downtrend since the end of January. Our first wedge pattern consolidated the downtrend, dragging the price down by approx. -22%. The price seems to be catching its breath after the freefall, and we can see another wedge pattern taking form. In the event the price closes below the wedge's bottom trend-line, along with a spike in volume, we can expect to see another move to the downside, till it reaches our intra-day support level at 0.0007 BTC (black horizontal line). Additionally, the RSI is struggling to go past its mid-point value (RSI 50). First, let's see which direction the price breaks out from the wedge before we place a trade. If you guys ask, I'd be happy to update you on this later on. Cheers!
Note: These are merely my predictions and observations. Please take my advice with a grain of salt, and always place your trades at your own discretion.

ETC Nut up or Shut Up! Ballsy Long TradesHello, Lovely ChartHunter-PipGatherers, there are herds of mainstream altcoins to be harpooned right now, so I'm serving up some thoughts on ETC. Yes, I like big profits. Yes, fraudulent fools call me a "reckless cowboy." Yee-haw. I'm not going to go too much into the fundamentals other than to say this: know your FORKS from your spoons. ETH has dropped almost half of its price since I posted my short trade idea on it. If you were holding you got squashed, lol. There may be a few bounces here and there but I believe ETH will continue to sell for a while, and looking for ETC to pick up lots of slack.The most fascinating part of this chart is that it appears to be the most oversold conditions ever on RSI for ETC. I like that. Keep Hunting Everyone.

Bitcoin and Altcoins Insist on RangeThe Crypto Spread Indicator has reflected the breakout in Ethereum and has tipped the scales back to the Altcoins accordingly. However, the recent pullback across the board is reflected evenly and the spread has returned to parity. Both Bitcoin and the Altcoin index have retraced slightly, though we do see some technical strength in both, and breakouts can be expected in each.
Bitcoin and many Altcoins are finding support at Fibonacci levels. Across the board, cryptos appear to be in Wave 2 of the next impulse of the 5-3 Elliott Wave, though if we cannot see a strong momentum push to mark entry into wave 3 to make new highs, we must regretfully accept that we are still in the corrective phase.
Interested in the Altcoin Index and the Crypto Spread Indicator? Check them out here !
For daily commentary on cryptocurrencies, subscribe to our newsletter !

DASH ASCENDIG Wedge - 1000k backBefore this hudge and common down momments not only in DASH but in all coins we can see the market taking the ascending route
dash made 4 highs in one risk
and 3 highs at another building our know ascending wedge, taking volume to got catch it 1000k price on the next days before february
