$US500 Monthly Chart AnalysisThe US500 is currently still in a long term downtrend however is currently attempting to reverse this scenario. If the current Monthly candle establishes a green candle, the demand imbalance will be confirmed with a likely run to Supply Above. The following two upside scenarios could occur: US500 will make it's way back to supply where a large reaction can be expected with a run back down to demand in a double top scenario which was not yet captured at 3200. Or US500 will run to the market maker discount zone and promptly turn around and grab demand around 3200.
Alternatively if December fails to establish a demand imbalance and turn's around, we can expect a run to 3200 with capitulation selling along the way as the Bears stay firmly in control of the Long Term Downtrend.
It is worthy to Note that the US500 has not given up the Zero Momentum line on the Monthly chart and this is an area will the market will hold and rally to a target or capitulate to lower targets.
Dikfat

$NFLX Long at Montlhy DemandNFLX has found some buying pressure at monthly demand. Being that the market is oversold into the big picture downtrend and we have rallied away, potential upside in many stocks is a great buying opportunity. NFLX closed above the 20 SMA on the Daily and is forming a rounded bottom breakout. Target into the fib discount zone between 216 and 230. Looking for a top target of 230-250 over the next 3 weeks.

$SNAP Long Opportunities at Monthly Demand ZonesSNAP has had quite the pullback with a lot of other names lately. The areas in green are areas of monthly demand where a long position can be built. Currently we are trading into and just above the first major area and also within the Market Maker Discount zone.

$GOLD Safe Haven? or Pipe Dream?GOLD as valued as it is may not be the safe haven asset people would have you believe. While it has been a runner in the past due to economic downturn, There are rare market events that come around swiftly and without warning that drag all assets down. The wealth transfer/changing of the guard. One such even was the great depression. Considering the deepening economic crisis and the ongoing devaluation of the dollar, GOLD will likely collapse to lows it hasn't seen in many decades as America has one of the worst Deflationary periods in it's history. As people seek to possess gold and refuse to exchange it for worthless dollars, they will turn to physical commodities of all sorts for barter and trade such as coffee, weed, and other priceless goods.

$AAPL The Last of the Giants to Fall..AAPL currently has sold off out of it's Monthly Supply Zone to confirm its on it's way to find Demand somewhere in this chart like the rest of the market. Look to buy the Dip somewhere around the Market Maker discount zone or lower into the next Demand Level Down.

$DIS Searching for Demand - Long Opportunites on DeckDIS is currently trading below its first major demand level and into the Market Discount Zone. Long positions can be built here but expect a possible return to the origin of the march move between 70 and 90 dollars at the next Major Demand area Down. Remember building a responsible long position in the market means buying time if you are in options or allowing sufficient time to pass while accumulating for any reasonable opportunities to play out. The market wont be a casino forever, and will eventually return to the slow and boring long crawl we are all used to.

A Hisotrical View of Market Behavior Under the FedDetailed is a Chronological view of the the Fed Chairs and how the s&P 500 behaved under each of their terms... I'd hate to be the guy running the show at the top of this channel..

$FB Long off Monthly DemandAs is with most stocks right now, FB is returning to the former breakout area from march. The market does this time and time again. This area is called Demand. The first time back to Demand typically results in a nice rocket ride. While the high time frame demand zone is the most ideal place for a long, It is also possible that FB bounces from this area which is the market maker discount zone. If they want a deeper discount they will visit the equal lows indicated by the pivot markers or somewhere nearby in the demand zone before taking off.

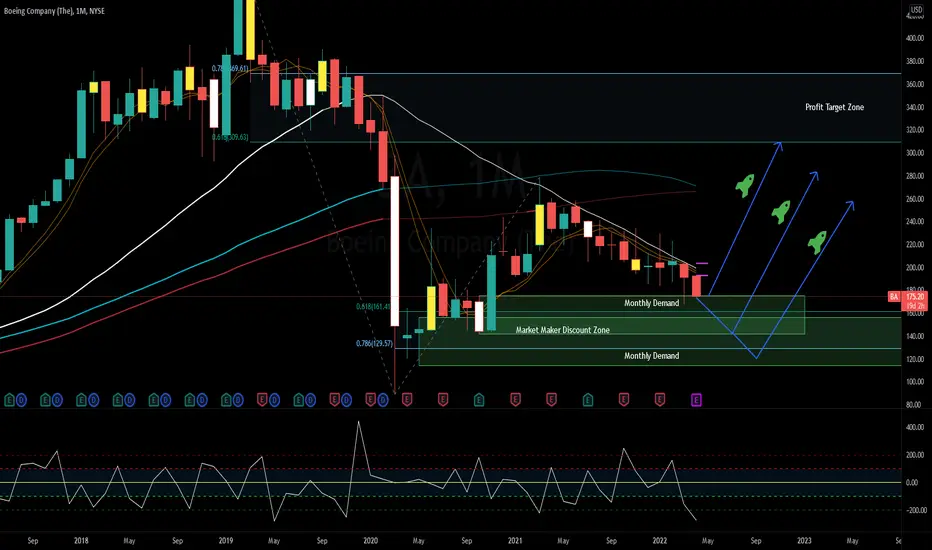
$BA The Long Awaited Long.. BA is currently testing the top of a monthly demand zone. There is a lower zone with daily and weekly gaps below. Both of these zones are centered around the Market Maker Discount Fib zone. Building a Long Position anywhere from here down will be the most epic long awaited long you can ask for. Profit target zone is highlighted up top.
$GOOG Google Rich. Short me Pl0xGOOG has been on an epic run and has long reached it's extended pullback zone. We are currently forming Supply and is expected to sell off to a better value for the market makers to pick up at a discount. Long term options short to the discount zone will be extremely lucrative.

$NFLX The Bull CaseAll jokes aside, NFLX may be in for a bumpy ride but you cant ignore areas of demand Higlighted in green. These are high probability areas to build a long position. Much like the rest of the market, overblown stocks are selling off as part of profit taking after an epic rally. The market maker discount zone is also a preferred area to buy, but demand is always better.

$NVDA Weekly Short Still in Play. Wide Open Space.NVDA weekly chart created and rested the Hekin Ashi Resistance level at 269.24 created in Feb 2022. This level failed and was rejected resulting in a bearish box. On the weekly chart there is no other weekly support level leaving a Widfe Open Space all the way down to the area at 136.73 first target and finally at 123 to fill the box. These tartgets also happen to be directly in the middle of the Market Maker Discount Zone. Unless NVDA can create some more support at its current level; like much of the rest of the market it will return to a former breakout area from March 2020.

$TSLA The Bull Case..While there are significant reasons this stock is overvalued and will need to come back to earth in the future, there is always the possibility that this stock is manipulated even higher through the yet unidentified TSLA Whale buying call options every week. A simple fib based trend extension yields targets above, pone of the more popular being the 1.618 extension at 1924

$TSLA The Bear Case..As with all good things that must end, TSLA will eventually test former breakout areas it has made in the past. Should TSLA Break below Heikin Ashi support at 780.79 it will promptly fold to 539.49. Measuring it's meteoric rise, there is a discount zone the Market Makers would love to take out between 300 and 500 bucks. As you may have noticed Elon Musk has been pumping fake news and looking to acquire other companies to control the flow of information because his current marketing tactics are wearing thin in an economic environment that is sure to be disastrous for the tech space in the mid to long term. Short to 780 and reassess.

$TNX Hyperinflation here we come.. The TNX has created a solid Hekin Ashi Resistance level in January of 2014 at 3.034% that has been tested multiple times on the yearly chart. This level is our first short to mid term target on the TNX looking to breakout from a decades long downtrend. Should the TNX break out above this level subsequent areas of resistance are circled as targets in white. This being a Bullish box on the Indicator would suggest that we will likely take that top target resistance created in Jan 1983 at 10.12% Should the shit really hit the fan, we have supply at 13.99 % circled in red. Hold on to your Butts..

$DXY The Death of the Dollar. Epic Breakout Imminent..DXY has formed Quarterly Equal Lows and reconfirmed support at 91.91 multiple times with an extremely bullish double bottom on Hekin-Ashi Support created in April of 2016. Targets above are 112.27 and 120.51 as our first major target on the way up. Since we have a set of Equal Highs that created Hekin-Ashi Resistance already in place at 120.51 in Jan of 2002 this could be the final destination. However if the Dollar continues to break out above it will be looking for Supply around 150 to 160. The Dollar is about to Self Destruct..

$TLT 20 Year Bond Quarterly Demand BreakoutTLT is at an area of Quarterly Chart demand with 2 other high probability areas for a long at Quarterly demand identified below. I have also included the Overall Market Maker Discount zone where price is likely to be driven before the great bond breakout. If you are Long on TLT, now is as good a time as any to start purchasing those Leap Options and building a long position with time.

$ABBV Epic Short in the MakingABBV has been on an epic blast higher and is Vertical off the monthly moving averages. Looking for a round number 180, 200 or into the extreme extension above 210. Shorts should be looking to build a nice position on this with time as it continues to extend. Short back down to the Discount zone.

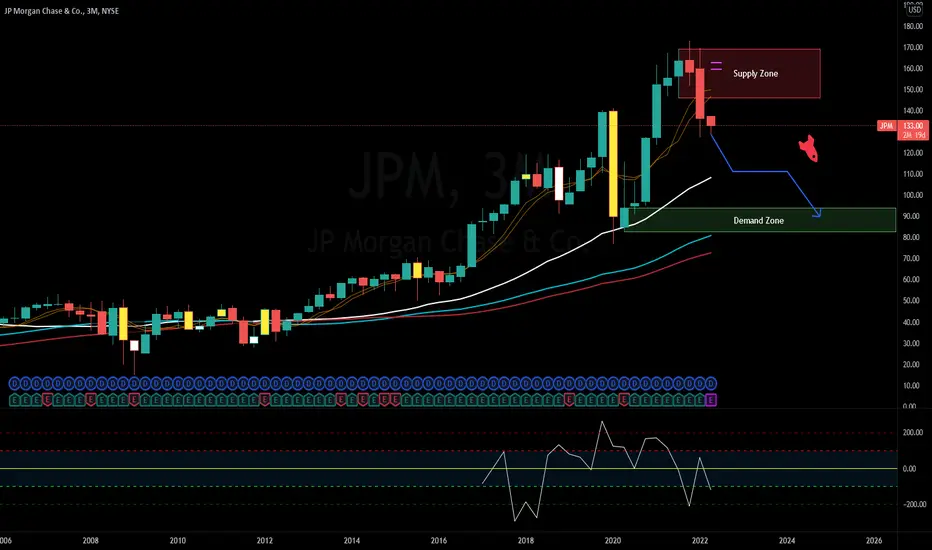
$JPM Quaterly Chart ShortJPM is currently trading down from a quarterly Supply Zone . Short to Demand around 96$
$AMD Long Opportunites Monthly DemandBelow are a few highlighted ares for Monthly Demand where a long position can be built with time.

$IWM Small Cap Slaughter is Underway..Short to Demand or Discount Zone. Long off Demand or Discount Zone back to Supply. Nuff' Said.

$PLTR Long off Monthly DemandAs is with most stocks right now, PLTR is returning to the former breakout area from march. The market does this time and time again. This area is called Demand. The first time back to Demand typically results in a nice rocket ride. The high time frame demand zone is the most ideal place for a long as PLTR has broken through the market maker discount zone for a deeper discount.

$W Long off Monthly DemandAs is with most stocks right now, W is returning to the former breakout area from march. The market does this time and time again. This area is called Demand. The first time back to Demand typically results in a nice rocket ride. While the high time frame demand zone is the most ideal place for a long, It is also possible that W bounces from this area which is the market maker discount zone. If they want a deeper discount they will visit the equal lows indicated by the pivot markers or somewhere nearby in the demand zone before taking off.
