$DIS doesn't look good hereHello my dear padawans of the charts. I hope everybody had a good weekend and is ready to start what promises to be a good week for the markets given the amount of (good) stocks that are reporting earnings this week. DIS is not among of them, but its ER is coming soon on 02/11. Of course things can change, specially with earnings around the corner (and Disney+ getting so many subscribers), but things are not looking good for DIS here. It is looking weaker than in my previous analysis (link below).
TECHNICALS
In my previous chart DIS was above the long term resistance. However, it failed to stay there. It is now below that resistance and struggling to move back up. It found support on the 14/21 emas but didn't move much to the upside. It is sitting on the 21-ema now after having broken below it a few times. Other things to take into account:
1. MACD crossed over bearish and is moving down to the 0 level. If it crosses below it could be very bearish.
2. The 14 ema is about to cross bearish under the 21 ema, another potentially strong bearish signal.
2. ADX is curling down very sharply, meaning the current uptrend is getting weak.
3. -DI is moving up while +DI is moving down, meaning a change in sentiment is happening.
4. RSI is still above the 50 level--where it is sitting--but has been moving down steadily
5. The gap was still not filled. Gaps don't need to be filled necessarily but since DIS reached ATH and is in retracement, it seems that this is an exhaustion gap, which most of the times is filled.
BEARISH SCENARIO
If DIS keeps going down, it will probably find support on the 50ema and some fib levels on the way, so expect price action there and even reversal depending on other factors. If you are a long term holder I think anywhere on/below the 50ema is a good buy opportunity. Keep in mind that the price could fill the gap and continue going lower but if you are in for the long term this should not scare you. You would still be getting the stock at a discount from ATH. You can DCA your way into it as well. (Not financial advise).
NEUTRAL/BULLISH SCENARIO
DIS could benefit from potential euphoria generated by the earnings of big players this week and continue its sideways move (or even move up). Given the indicators, I am bearish in the short term but there are other forces on the market that cannot be ignored.
Again, keep in mind earnings is right around the corner, so plan to trade around it as well in the coming weeks.
Safe trades my friends!
Share the love:
If you get anything out of this TA, please like the chart so it moves up and others can benefit from my work. A simple click on the like button goes a long ways.
Follow for more:
I have an outstanding winning rate (check my other charts). If you want the best entry/exits just follow me, you won't regret. Thanks a lot!
***The ideas shared here are my opinion, not financial advise to place trades. Please do your own research before buying/selling stocks***
DIS

Flag Pattern on DIS, We are ready to execute this setupToday, we will show our view on DIS; let's start with the Weekly view:
The price is above two key channels, and we don't spot any other Dynamic resistance zone for the price
On the 4hs chart:
We can see a clear Flag pattern supported on the secondary broken ascending channel. Based on the Fibo extensions we can draw, we expect a bullish movement first towards 200 and then 225
The green line represents our activation level for the setup; We will set our stop loss below the Flag pattern and break even when the price reaches a risk-reward ratio of 1:1

Disney's price on a crossroadHolidays are over and it is time to get back into the markets, refreshed and with new strength.
I am making another revision of Disney as the price on Friday closed at the internal trend support and played out the small bearish flag. Volumes were higher than Thursday as there were 12.23M shares traded against 8.951M shares on the day before Friday. The activity had increased before the weekends, but with that dip buying before the close, it looked more like long position covering.
Now two options are on the table that will be crucial if confirmed by the price action.
1. Price dips inside the $165 - $169 zone and we may see potential trend-reversing price action;
2. The zone holds and Disney'sprice resumes inside the uptrend with the broader market;
Be cautious on the first trading day after the break.

An optimistic future for DIS As vaccines continue to roll out and talks on potential shutdowns to come, entertainment stocks continue to rally. Overall Im still bullish on Disney. News Recently announced operating hours through out now to March. and as Cinema stocks continue to get bashed with this pandemic, Dis streaming service continues to grow. Post pandemic world will be very optimistic for Mickey Mouse. I'm looking at PT of 190 on the breakout of the triangle, under 175 we can see possible bounce near 172 to complete an a-e correction. 200 Mental target

DIS on support of trendline and 21-emaHello my young padawans. Behind the scenes of the EV frenzy, biotechs, and SPACS the good old DIS has discretely (maybe no so discretely if you look at the past month but sort of behind the scenes) made its move up and reached new ATH on the hopes of vaccine and prophylactics, and other branches of the conglomerate such as Disney+. If you have been buying throughout the pandemic like I did you should be sitting very comfortably now.
It seems though that the spike up lost a little of its steam. After the peak DIS dropped a little and has been trading sideways for a few days. Today it breached the long term trendline (yellow) and found support on the 21-ema on the daily. The price closed above the trendline, which is a good sign but other indicators are not very positive:
1. MACD is curling down with bearish crossover of MA and signal;
2. ADX is curling down fast as well which shows the trend is getting weaker;
3. +DI and -DI are converging bearish (red line moving up and green line moving down; quite sharply actually)
4. There is a gap that has not been filled yet
This doesn't mean the price will go down but there is a slight bearish bias at the moment. A pullback would be an opportunity to start a position of add more if you already have one, or at least that is what I am doing.
Safe trades!
Share the love:
If you get anything out of this TA, please like the chart so it moves up and others can benefit from my work. A simple click on the like button goes a long ways.
Follow for more:
I have an outstanding winning rate (check my other charts). If you want the best entry/exits just follow me, you won't regret. Thanks a lot!
***The ideas shared here are my opinion, not financial advise to place trades. Please do your own research before buying/selling stocks***

Update on Disney: price stalling at the topsIn my previous post, I've mentioned that Disney is dangerously high and that technicals are screaming for a correction. Some time has past and the price is still stalled around the highs. RSI has already dipped quite below the 70 line and MACD's crossover is spreading wider. The histogram is increasing as well. We have a small subdued bearish flag (the figure marked in red lines) that with Yesterday's close it has been breached, though not with a strong intention. Two key zones (the squares in blue) remain to be passed to speak about testing the trend and eventual reversal of that uptrend. The target of the figure is implying for a potential move towards the gap level and the trend support zone.


$DIS DailyRsi overbought, with bearish macd cross. Large gap below, does it get filled? Will enter short on a break below 169.68. Gap fill coincides with 50d as well.

Disney reaching it's peak?$DIS - waiting for price action to confirm a potential correction;
RSI divergence and in OB zone;
MACD divergence and a bearish crossover;
Leading way ahead of the SPX as a reference.

DIS to 190?Levels annotated on the chart, Ive updated Disney the past few weeks and almost every week is new ath, Set a tight stop loss as its at all time highs and looks to be coming to an end of its parabolic move, If Dis+ continues to display great news and brings in new content Dis can keep pushing and create new highs. Mickey giving us Disney Land money!

DIS is Santa Mouse coming out this week? Disney had some good movement last week, looking for some nice movement this week with the Santa rally. Look for an entry near my wave c correction, we could see a dip or it could ignore that wave c and have a bullish push pm. Look for an entry near 171.11 under that we could go for that gap fill down at 170.48. Major breakout of 175.84 and we'll see ATH again!
Safe plays: 175C 180C (1/8, 1/15)
lotto play/ day trade: 175C, 180C (12/31) very risky lotto 185C 12/31 .17c

DIS 12/21/2020 LongDIS gapped up on heavy volume over a significant level that it was bumping up against & has spent six days digesting these higher prices.
I bought a half-sized position on Monday (12/21/20) when the market gapped lower due to a new COVID strain mutation in the U.K. I believe that the market is over COVID & has been for some time. Unless there is a negative development on the vaccine front, Pumpin' Powell is going to be able to continue inflating the asset bubble. The DIS pullback also coincided nicely with a bounce off of the 9-day EMA.
My initial stop is below the low of the gap-up day. I'm looking to add larger size on a break of Monday's highs circa $172. I would also be willing to add on a false break & quick reclaim of Monday's lows, at which point I would move stops up to just below the false break.

DIS flagging 175 incoming (intra day update)DIS finally moving could see another leg up during power hour, needs to hold 173.50

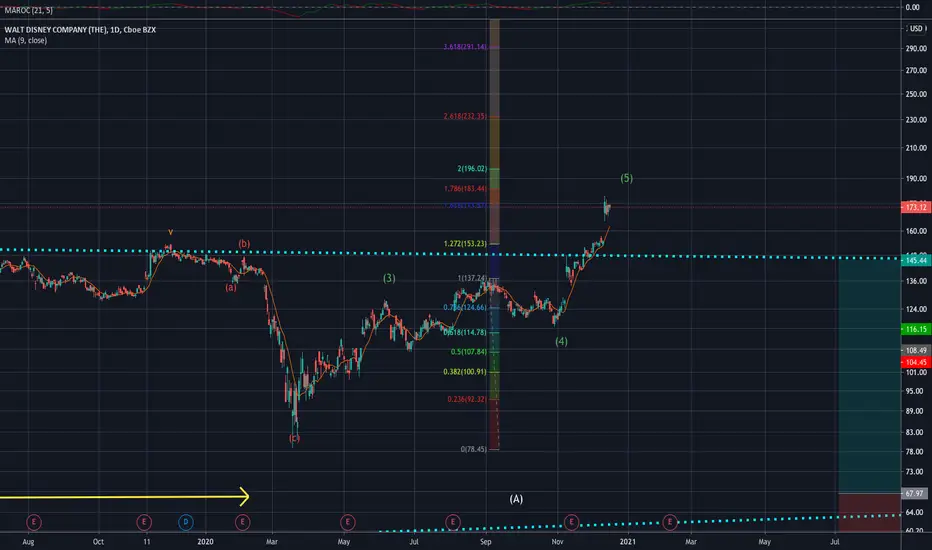
DIS Trade UpdateDIS current breakout pattern is targeting wave (5) upside that may reach 173-183. Our Leaps has gone deep ITM, looking to scale out partial profits 173 and then at 183 wave (5) upside target.
AMZN / SPY (2019)AMZN LAGGING BEHIND SPY REMINDS ME OF LAST YEAR.
Any positive news for AMZN can be the catalyst to send it higher.

TSLA / AMZNAMZN LOOKS LIKE TSLA BACK IN NOV.
I WOULD GO LONG OVER 3200, OR YOU CAN WAIT FOR THE 3250 BREAK FOR A BIGGER BREAKOUT.
I WOULD GO SHORT UNDER 3075.

$DIS The volume goes crazy up when Disney gaps upI Bought Disney before the pandemic, it went crazy down since then and was hard to hold it but luckily I believed in the company and averaged out at the lower price, Finally, it paid off.


$DIS is Disney ready to make another move upDo you think $DIS Disney is ready to make another up move?

DIS BreakoutDis headbutting at ATH, TTM looks good, holding strong, great ascending triangle pattern


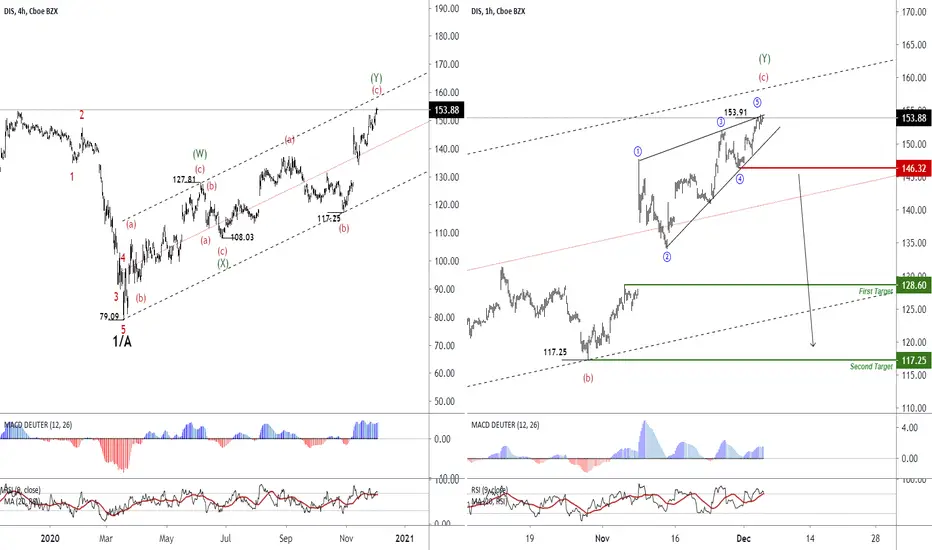
Walt Disney - Ending Diagonal PatternIn the 240-minute chart, we have 5 descending waves, which have ended in the range of 79.09, in continuation, the correction of this downtrend is in the form of Double Zigzag, which has reached the range of $ 153.91. The Diagonal pattern has been formed in this range, of which the targets can be 128.60 and then $ 117.25.
In case the visualization of this analysis become true, the main pattern will be Expanded Flat and we can consider the expansion of the bearish trend up to the range of $ 79.09.
DIS Steamboat Willy into Wave (5) With our DIS leaps profits doubling as DIS, look to stretch existing profits on DIS into December 2020 with upside target at about 180-200. Alternative wave count will be a consolidation pattern that continues.
