Fair price Range for Walt Disney $DISAs shown on the chart I think NYSE:DIS is in a good price ranges that will not be found again in the future
My Entry Price is 88 USD
Stop Loss is Daily Close Below 84 USD
My Target is 104 USD in Mid-Term time and 145 USD in the future
Make Sure that You Can Afford the Loss Before Opening Positions
Disney

Disney - Is Your Compass Upside Down?On trading social media, Disney has been the target of moonboys for quite a while.
For some reason, whenever a stock is in a landslide and doesn't go up, everyone gets it in their head that they're going to BUY THE CALLS and catch the next MOTHER OF ALL SHORT SQUEEZES.
And this is because you want to gamble on a single day candle, which results in you blowing your account, and then you stop using TradingView and can't have fun anymore.
Disney, fundamentally, is a company that may not have any future whatsoever in a society that returns to mankind's traditions.
For so many years, it has been pushing a warped and depraved culture at both its parks and via its broadcasting networks. It was even an entertainment industry leader in onboarding the Chinese Communist Party's Zero-COVID social credit edicts.
And this is a problem if you want to get long.
They always say "zoom out," and so let's look at yearly candles:
8 months of price action for 2023 so far indicates that we've probably just been painting the wick portion of a year that will break the 2020 COVID low.
And the first place you find support below the COVID low is at $40.
"Sure, sure. But it's Disney. It's the stock market. EVERYONE KNOWS it's going up. Bears always get #rekt LOL."
"Bear flags" and "bull flags" are astrology and don't exist. But what does exist is when an equity spends more than a year in an area it should have bounced from and simply doesn't go up, which is what we see on the monthly.
But the contrary, on the Weekly, there is a problem for bears, which is the August of '22 high at $126.
And so there is a potential that tomorrow's earnings call actually results in a raid to $80 that actually produces a bullish buying opportunity with a target of $126.
The problem is, the "JPM Collar" has the world's most significant bank long on SPX 4,200 puts that expire September 29 that have literally been under water every second of every day since they were bought at the end of Q2.
SPX/ES - An Analysis Of The 'JPM Collar'
However, I note in my recent SPX call:
SPX - The Sound of a Shattering Iceberg
And a recent Nasdaq call
Nasdaq NQ - Is It Time To Sell The Rip?
With CPI pending on Thursday morning, what happens tomorrow is really significant.
That although I suspect our index tops to get raided, the problem is, are you going to see $40+ on Disney in a time frame of less than 3 weeks?
September is likely to be something of a "chilly autumn" for equities markets with the way everything is set up, including the SOXS bear semiconductor ETF and the VIX.
If there's to be anymore rally, that rally may only come in Q4.
And thus, that would mean for Disney that a likely scenario would be a raid on the lows from earnings and even more bearish consolidation, with the $126 target being left for the beginning of Q4.
This stock is a lot like Verizon and T-Mobile. It's better left not bothered with until it starts to show you signs that a bank or a fund really wants to rip it bigly in one direction or the other.
There's lower hanging fruit and greener pastures out there to trade.

Disney Long Term Swing TradeMissed the first opportunity to enter once the price was within the marked support zone. Waiting to enter once the price returns to the previous low for a long trade which could take months to provide the desired results.

DIS Wyckoff Pattern UpdateNow at an area where we can assume of a potential spring. On the Monthly it has now finaly hit the $83 200SMA & HBD still forming. Still hopeful about this.

Disney forecastThe price is at its low.
Position long :
take profit:
93.44
103.62
118.35
stop loss:
78.03

DIS Short: Break down from descending triangleServe DIS right for pursuing the Woke agenda. I guessed Little Mermaid is bad enough but Snow White is probably the straw that breaks the camel's back.
I've been monitoring this for a long time and finally it broke down.

Disney Greatest Buying Opportunity or Dead Stock?Disney has seen its largest divergence from the s&P500.
What is this telling us?
Is this a rare phenomenon buying opportunity or is the Disney stock dying?

Disney megaphoneLooking at the monthly on Dis NYSE:DIS #dis #Disney as a megaphone and lows are marked at 57 and 68

Disney - A Long Term Investors Opportunity?Disney NYSE:DIS
- Three decade long parallel channel in GREEN.
- We are reaching the bottom support line of the GREEN Channel (little downside remaining)
- We can enter this positive divergence trade with a clear stop loss level anywhere under the downward sloping line on the chart. Also, we could exit the trade and cut losses if the RSI support line is broken. We have defined reasonable risk levels for this trade.
- Long term Investors or DCA folk could enter all the way down to the low green resistance line. It we lost that i think would cut my losses and wait to see what happens.
All in, there is a confluence of;
- Short term support (sloping lower line or RSI support Line)
- Both the same lines highlight a positive divergence opportunity.
- Long term support in green
- Clear stop loss levels under any of these lines depending on your time horizon
Happy Trading Folks
PUKA

Just the beginning guysDo you remember when NASDAQ:NFLX (Netflix) faced a password crackdown?, Something similar is happening here NYSE:DIS (Disney). This might indicate that Disney's stock is currently SUPER undervalued.
In addition to this bullish flag (10%up), there are more patterns in progress, so this will surely be the lowest price we will see at Disney for a long time.

DISNEY Revisiting a 10 year Support LineThis Technical Analysis is on Disney (DIS), on the 2 Week timeframe.
Our Current Price action is TESTING SUPPORT on this MASSIVE Decade Long SUPPORT LINE.
The 1st time we have ever tested SUPPORT on this was September 29th, 2014.
Highlighted by the RED circles, everytime we've tested this we've had some sort of Price Bounce.
The Most massive gains were from the Bottom of the COVID Crash to the TOP @ approx. $202.00
A Gain of about 154%.
It was also a more evident time to buy as the RSI gave hints along with some other indicators.
Another one being the GOLDEN CROSS where 2 week 21 EMA CROSSED Above 2 week 50 SMA .
Whats happening now?
Currently our 2 week candle, has not yet closed. It will do so August 14th. We will give more clues then. If we maintain support thats GOOD, If we see ourselves below it, and CONFIRM BELOW that would be VERY BAD. This would mean we have broken a 10 year SUPPORT LINE.
We have also had a DEATH CROSS, which is when 21 EMA CROSS below the 50 SMA. This often times causes price to fall as we've recently seen. The moving averages currently seems like there pointing downwards, indicating that price can still drop more.
I would like to see the Moving Averages to flatten out at 180 degrees. To have this happen price needs to bounce from here.
Price is also currently in a downward channel.NOTE how the lower trend line of the channel is below the MAJOR RESISTANCE.
It can be possible that we test this.
Notice the BLACK ARROWS on the RSI and MACD. If you relate them to the lower trend line of the downward channel on Price action. This shows a BULLISH DIVERGENCE. Which is a sign of potential BULLISH MOVE UP.
Bullish Divergence = When Price action shows LOWER LOWS but the indicators show HIGHER LOWS. Usually means price is lagging behind the indicators and eventually PRICE will increase to catch up to the indicators. In normal instances, price moves in sync with indicators.
If PRICE moves BELOW the SUPPORT, its possible we touch this area indicated by the BLACK ARROW, which coincides with the horizontal black line that touches the previous candle wicks. This would put the BULLISH DIVERGENCE at play. Look to see in the upcoming weeks what happens.
Some danger signs are seen in the indicators:
RSI -> Currently our ORANGE RSI Line as moved below the BLACK Moving Average. If you look left it has always been associated with price drops. If we continue to stay below, risk of price drop remains.
MACD-> Notice how the size of the GREEN histograms have been decreasing, indicating a slow down on MOMENTUM. If we don't see bigger GREEN histograms print, next likely thing is the appearrance of RED Histograms which will indicate increased probability of PRICE going down.
ADX -> Highlighted zone shows RED LINE above GREEN. This indicates that bearish momentum is present. As long as RED line is ABOVE GREEN, likelyhood of bearish momentum and price falling is probable.
CONCLUSION:
Disney has reached the CRITICAL SUPPORT line for the 5th time in the 10 year history of this SUPPORT LINE. Everytime when it did so as seen in previous history, its been known to be decent area to BUY. Is it a good area to buy? In my opinion its hard to tell in this moment. For one, we should wait till the close of this CURRENT 2 week candle on the 14th of August. Something to note, everytime we test a trendline, support or resistance, each time it gets weaker. Keeping this in mind, with the warning signs in the indicators and a potential BULLISH DIVERGENCE, a scenario that can be possible: we break it, to test the lower trend line of the Downward channel, only to have prices MOVE BACK UP. But its important to state that this doesn't have to happen either. We need to be patient and observe what is to come in the coming weeks. Zooming into the smaller timeframes, can also give more concrete short-term clues on direction. Stay tuned for updates on other timeframes.
Thank you for your time! Please do support this idea and my work by boosting, following and commenting. Follow for updates and ideas on other trade-ables.
If you have any questions do reach out. Thank you again.
DISCLAIMER: This is not financial advice, i am not a financial advisor. The thoughts expressed in the posts are my opinion and for educational purposes. When trading always spend majority of your time on risk management strategy.

Disney stock has maintained strong support in the past 10 weeksDisney's stock has maintained strong support levels in the past 10 weeks
This chart shows the weekly candle chart of Disney stocks from the end of 2019 to the present. The graph overlays the bottom to top golden section at the beginning of 2020. As shown in the figure, Disney's stock has maintained strong support levels in the past 10 weeks, with inter district fluctuations above the golden section's 0.236 level! Once Disney stocks close below this strong support level for three consecutive trading days, the downside space opens up and it is likely to fall below the low point of early 2020!

DisneyDisney is becoming quite an enticing looking Buy IMO (NFA), Even though i prefer typically being more of a Degen #degen and playing with things of HIGHER RISK this is beginning to be hard to not BUY MORE of( I've already been trading it for 3 weeks).
Though maybe not as hard to ignore as NYSE:VZ lately.
I think that Disney has a LOT of future possibilities to make higher profits as well as play into being more of a tech/A/i. play once they begin dropping the narrative with how many various ways A.I. can help them save MASS amounts of $.
I also think in a much longer dated play you'll see a narrative for droids to help cut lifelong healthcare etc. and replace a lot of workers they have doing very basic things.

Walt Disney is in a good place to enterIf we are not mistaken in Elliott's calculations and wave counting, now is a good time to enter Walt Disney.
In this case, the first target will be $120 and the second target will be $145.
If the price goes below 83 dollars, our calculations were wrong.

DISNEY LONG PROJECTIONDisney has formed a bullish triangle pattern indicating a potential upward rally, with a clear confirmation of a breakout. The pattern is supported by a consistent and robust level at the bottom, where strong buying activity occurs whenever the price revisits this zone.

$DIS Parallel Downtrend ContinuesNYSE:DIS Parallel Downtrend Continues, looking for double bottom to hold support. Will take a small position if it gets there. Stop out on a weekly close below the double bottom.

Disney Finding It's Place In The MarketHistorical Performance: Over the years, Disney's stock has shown long-term growth and has been considered a stable investment for many shareholders. However, it's important to note that past performance is not indicative of future results, and the stock market can be subject to fluctuations and risks.
With all of its attractions and streaming products disney will be here for a while and I do think looking at it short term it's been consolidation quite abit at these levels.
On the visible rang volume profile it shows on the 4 hr chart it show consolidation levels at 88.46 - 89.19 and 91.68 - 92.81. If disney falls under 88.46 if could possibly test 87.34 again.
It also shows point of control at $92.25. which means it there's a lot of buying pressure at that level.
It has a huge gap to fill starting at $95.10 all the way up to 96.61. That leads me up to the earnings. The cause for that drop came from a missed earnings which out of the last 6 they missed 3 and beat 3 every other one. If were being optimistic since they missed the last one they should beat this earnings coming up bases off pattern. But, Of course a lot of other things play into their financials.
Looking for a run up prior to earnings to at least mid 90s if it cant break these consolidation zone.
I do think this is more of a long term hold. Next resistance after gap fills we should see disney at the $100 levels.
Trade Responsible,
#TradeTheWave

Disney - In Danger TerritoryLose $84 on a high time frame close, we will easily see a target of T1= $70 followed by a main T2= $50. Go woke, go broke bums.
On the contrary, this is the optimal point to go long to play a swing trade if you have faith in disney bouncing back. Stop loss around $84, targets of T1 = $102, T2= $115. I would have to reassess at that point. Wouldn't anticipate resistance flipping on a bounce.

Disney stocks are now emerging from a weak triangular !Disney stocks are now emerging from a weak triangular oscillation pattern!
This chart shows the weekly candle chart of Disney stocks from the end of 2019 to the present. The graph overlays the bottom to top golden section of 2020. As shown in the figure, Disney stocks fell unilaterally after completing the head and shoulder positions from March to September 2021! In the past year, Disney's stock market has shown a relatively low large triangle consolidation pattern, with bulls powerless! For a period of time in the future, just use the lowest point in 2020 as the watershed to determine the strength of Disney stocks, above it, slightly strong, and below it, slightly weak!

Has Disney Bitten off more than they can chew? Target $23.30Head and Shoulders has formed on Disney.
Since 2021 at the high of $202.00, the market has crashed down to $89.00
Technically, it's really not looking good for the giant.
21>7
RSI<50
My unfortunate target for Disney is to $23.30.
It sounds ridiculous and it is crazy, considering how they bought Pixar, Marvel, Lucas Films.
I trust the company will get out of the doldrums and I will revisit my analysis. But for now it seems like downside is to come.

Wyckoff Accumulation pattern on DisneyIf we can hold these lows, I believe that there's an accumulation going on that could reverse the Macro downtrend on Disney. ~$90 has been a very important price point for Dinsney in the last 8 years.
This thesis supported by: the stock finding itself at the lows of March 2020, the Monthly RSI being at ~39 and Monthly Hidden Bullish Divergence forming inside of a Falling Wedge.

Disney Should Start to Rip FacesDisney is hitting a trendline from 1998 and 2020, it's chart VS SPX looks amazing and longterm bullish here, at $88 and target is wherever the top of the megaphone lands, maybe $360 if I had to guess, cheers!

I might want to own DisneyI might want to own Disney as my first stock. Now this is why!
Are you aware that Netflix stopped allowing users of different IPs to log in and watch the show, even when you had a premium subscription?
That means, even if you are from the same household, but one of you has an extended overseas trip, he could be booted out after he has "used up" the overseas button.
In some countries, the subscription fee of Disney is 3 times cheaper than Netflix. I'm unsure if that's what Disney offers for the first-time sign-up client, but it is worth noticing.
Disney owns some of the biggest brands, such as Marvel, Starwars, 20th Fox Century Studio, and more.
Although I'm not optimistic about some of the new Marvel series, there is so much more potential with Disney.
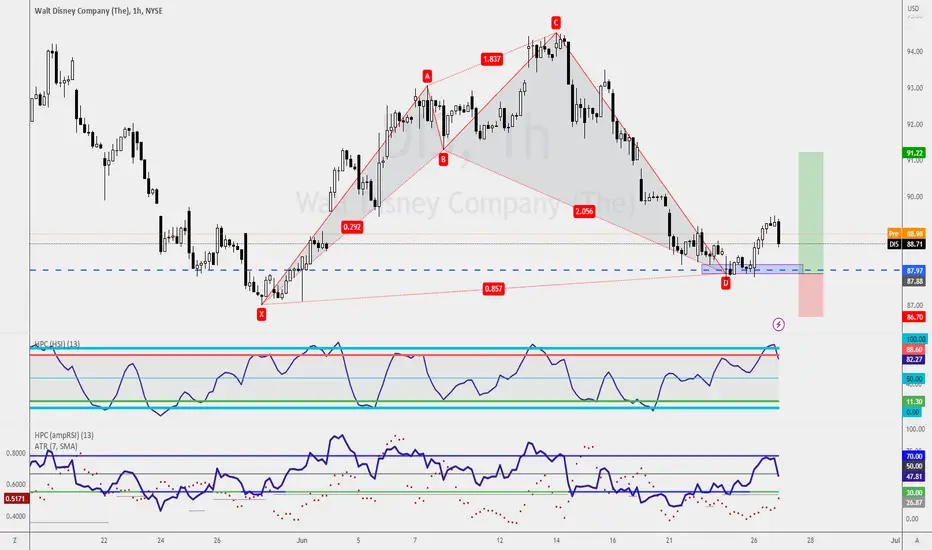
So when the Bullish Shark Pattern has confirmed at $87.90, it is great news for me to own my first stock and it might be Disney.
What's your take on this?