EURAUD – Incoming Upthrust? Accumulation or Distribution? Chart Context:
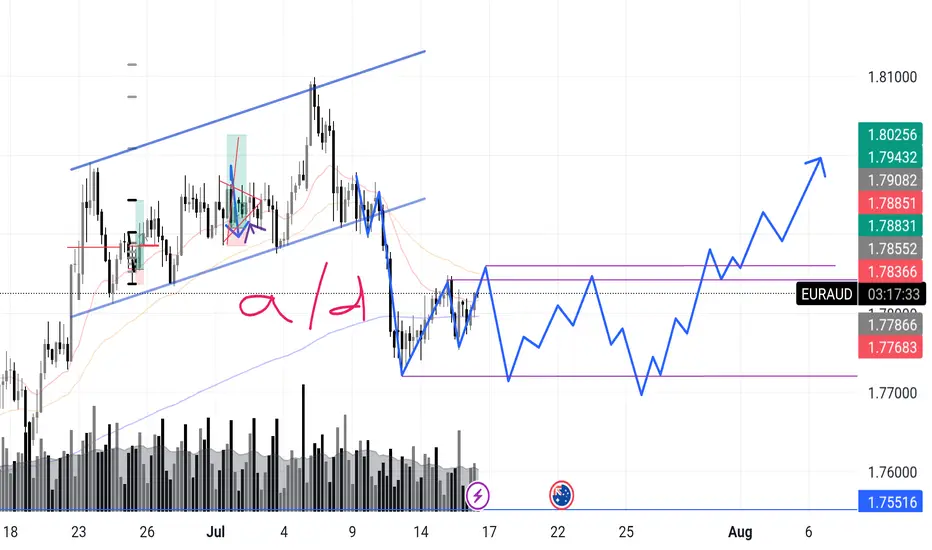
EURAUD recently completed a sharp markdown after a textbook rising channel break. What’s interesting now is that price has entered what looks like a potential box range between 1.7768 and 1.7885.
I'm anticipating a possible upthrust move into the 1.788x zone — and what follows will reveal the true intent.
Here’s the internal debate:
Are we looking at reaccumulation — smart money trapping shorts before driving higher in line with broader money flow?
Or is this a distribution — where the market builds a false sense of support before deeper downside?
🔍 What tips the scale for now is this:
>The overall money flow direction (via volume patterns + structure) has leaned bullish, so I’m favoring accumulation with a shakeout scenario.
Signs I’m watching:
✅ Absorption volume near the bottom of the range
✅ Higher lows inside the zone
✅ Fake breakout / upthrust into prior structure
❌ Failure to hold above 1.7855 could flip the bias short-term
📉 Expecting one more dip to test demand, followed by range tightening, and if buyers show up strong — the breakout can get explosive.
What’s your take?
Are we prepping for a markup or will this fakeout and roll over?
"I go long or short as close as I can to the danger point, and if the danger becomes real, I close out and take a small loss"
Distribution
July 15 2025 -Sell Limit ActivatedGood day, folks!
Just sharing another learning from my ideas here:
EURUSD has been in a bearish structure since July 14, 2025 (1H Intraday). As you know, I always look for clear supply or demand validation before placing a sell or buy limit order. On the chart, you can see a valid supply zone that was generated on Monday. After that, I waited for a clear move during the Tuesday London and New York sessions, with the CPI news release acting as a catalyst for more volatility. The trade came to fruition during the New York session on Tuesday. (See chart for the complete breakdown of the movement and entry.)
RR: 1:3
Another Wyckoff schematics and structure analysis.

BTC to sweep liquidity?4 Hour Analysis:
- Market moving out consolidation phase (Accumulating late buyers)
- May sweep the 1st buyside liquidity (see chart)
- Or may sweep the ATH above the 1st buyside liquidity (see arrow on the right of the chart)

What Is T-Distribution in Trading? What Is T-Distribution in Trading?
In the financial markets, understanding T-distribution in probability is a valuable skill. This statistical concept, crucial for small sample sizes, offers insights into market trends and risks. By grasping T-distribution, traders gain a powerful tool for evaluating strategies, risks, and portfolios. Let's delve into what T-distribution is and how it's effectively used in the realm of trading.
Understanding T-Distribution
The T-distribution in probability distribution plays a crucial role in trading, especially in situations where sample sizes are small. William Sealy Gosset first introduced it under the pseudonym "Student". This distribution resembles the normal distribution with its bell-shaped curve but has thicker tails, meaning it predicts more outcomes in the extreme ends than a normal distribution would.
A key element of T-distribution is the concept of 'degrees of freedom', which essentially refers to the number of values in a calculation that are free to vary. It's usually the sample size minus one.
The degrees of freedom affect the shape of the T-distribution; with fewer degrees of freedom, the distribution has heavier tails. As the degrees of freedom increase, the distribution starts to resemble the normal distribution more closely. This is particularly significant in trading when dealing with small data sets, where the T-distribution provides a more accurate estimation of probability and risk than the normal distribution.
T-Distribution vs Normal Distribution
T-distribution and normal distribution are foundational in statistical analysis, yet they serve different purposes. While both exhibit a bell-shaped curve, the T-distribution has thicker tails, implying a higher probability of extreme values. This makes it more suitable for small sample sizes or when the standard deviation is unknown.
In contrast, the normal distribution, with its thinner tails, is ideal for larger sample sets where the standard deviation is known. Traders often use T-distribution for more accurate analysis in small-scale or uncertain data scenarios, while normal distribution is preferred for larger, more stable datasets, where extreme outcomes are less likely.
Application in Trading
In trading, T-distribution is a valuable tool for analysing financial data. It is primarily used in constructing confidence intervals and conducting hypothesis testing, which are essential for making informed trading decisions.
For instance, a trader might use T-distribution to test the effectiveness of a new trading strategy. Suppose a trader has developed a strategy using the technical analysis tools and wants to understand its potential effectiveness compared to the general market performance. They would collect a sample of returns from this strategy over a period, say, 30 days. Given the small sample size, using T-distribution is appropriate here.
The trader would then calculate the mean return of this sample and use T-distribution to create a confidence interval. This interval would provide a range within which the true mean return of the strategy is likely to lie, with a certain level of confidence. If this confidence interval shows a higher mean return than the market average, the trader might conclude that the strategy is potentially effective. However, it's important to note that this is an estimation and not a guarantee of future performance.
How to Plug Probability and Normal Distribution in Your T-Calculation
To use a T-calculator for integrating probability and normal distribution, follow these steps:
- Input Degrees of Freedom: For T-distribution, calculate the degrees of freedom (sample size minus one).
- Convert Z-Score to T-Value: If using normal distribution data, convert the Z-score (standard deviation units from the mean in a normal distribution) to a T-value using the formula: T = Z * (sqrt(n)), where 'n' is the sample size.
- Enter T-Value: Input this T-value into the calculator.
- Calculate Probability: The calculator will then output the probability, providing a statistical basis for trading decisions based on the T-distribution.
Limitations and Considerations of T-Distribution
While T-distribution is a powerful tool in trading analysis, it's important to recognise its limitations and considerations:
- Sample Size Sensitivity: T-distribution is most effective with small sample sizes. As the sample size increases, it converges to a normal distribution, reducing its distinct utility.
- Assumption of Normality: T-distribution assumes that the underlying data is approximately normally distributed. This may not hold true for all financial data sets, especially those with significant skewness or kurtosis.
- Degrees of Freedom Complications: Misestimating degrees of freedom can lead to inaccurate results. It's crucial to calculate this correctly based on the sample data.
- Outlier Sensitivity: T-distribution can be overly sensitive to outliers in the data, which can skew results.
Advanced Applications of T-Distribution in Trading
T-distribution extends beyond basic trading applications, playing a role in advanced financial analyses:
- Risk Modelling: Utilised in constructing sophisticated risk models, helping traders assess the probability of extreme losses.
- Algorithmic Trading: Integral in developing complex algorithms.
- Portfolio Optimisation: Assists in optimising portfolios by estimating returns and risks of various assets.
- Market Research: Used in advanced market research methodologies to analyse small sample behavioural studies.
The Bottom Line
The T-distribution is a powerful tool, offering nuanced insights in scenarios involving small sample sizes or uncertain standard deviations. Its ability to accommodate real-world data's quirks makes it invaluable for various trading applications, from strategy testing to risk assessment. However, understanding its limitations and proper application is crucial for accurate analysis.
This article represents the opinion of the Companies operating under the FXOpen brand only. It is not to be construed as an offer, solicitation, or recommendation with respect to products and services provided by the Companies operating under the FXOpen brand, nor is it to be considered financial advice.

GBPUSD Sell Limit Activated June 17 2025This trade was taken today, (tuesday- june 17, 2025). Based on 1H timeframe Supply. I wait for London Session and check for possible liquidity sweep in 15 min and 5min timeframe. I noticed a CHOCH followed by tap in Supply zone of the schematics. I decide to create a sell limit order during New York Session to maximize the Risk to Reward Ratio. (Check the charts for detailed label and movement). 1:7RR
Wyckoff schematics in 1H timeframe--> confluence of supply in lower timeframes for validity.
RR:7
Another classic distribution. patience is the key :)
#wyckoff
#sell
#supplyanddemand

AUDUSD → Correction after a false breakout before growthFX:XAUUSD continues to rise amid uncertainty surrounding the dollar, which continues to consolidate. The currency pair is preparing to test resistance at 0.6537
The dollar is stuck in place due to market uncertainty. At the same time, the Australian dollar is strengthening and is ready to test the liquidity zone
Within the current trend, the currency pair is heading towards resistance and the liquidity zone. We opened far away, and as we move towards the target, the potential for further growth may end. A false breakout of 0.6537 could trigger a correction
Resistance levels: 0.6537
Support levels: 0.6509, 0.6479
A sharp move towards resistance without the possibility of further growth could cause a false breakout of 0.6537. Price consolidation below this level could trigger a correction before growth.
Best regards, R. Linda!

BITCOIN WEEKLY WYCKOFF — DISTRIBUTION OR REACCUMULATION?BTC has formed a textbook Wyckoff structure on the weekly chart — but are we entering Phase D markdown, or is this just a trap before continuation?
📉 Distribution Case (Primary Bias):
BC → UT → UTAD clearly defined
Bearish RSI divergence at UTAD confirms momentum exhaustion
Volume drying up = weakening demand
🎯 Targeting the 0.618–0.66 fib zone near 87k–89k, confluence with previous structure
🧠 Reaccumulation Possibility (Alternative Scenario):
Structure also mimics Reaccumulation Schematic #2
If support at 101k–104k holds and price reclaims 112k with strong volume → UTAD may prove to be a SOS, not a trap
⚠️ Levels to Watch:
🔺 UTAD: 112,087
🔸 BCLX: 108,496 → structural pivot
🔻 AR: 92,160 → distribution confirmation if lost
🎯 Target: 89,050 – 87,206 (fib + horizontal confluence)
🟠 Final invalidation for reaccumulation: weekly close below 87k
Whether we’re heading for Phase D markdown or one final shakeout before markup, this structure will define BTC’s path for the coming months.
Bias: Bearish unless price reclaims UTAD with strength.
Conviction: Grows with breakdown + volume spike under 101k.

Bitcoin – Entering a distribution phase after a bull trap?Since the second week of May, Bitcoin (BTC) has exhibited a textbook accumulation phase, with a well-defined trading range forming just below the previous all-time high. Beginning around May 12, price action became increasingly compressed, marked by a series of higher lows and relatively flat resistance, indicating growing demand and waning selling pressure. This consolidation structure persisted for more than a week, suggesting that larger players were accumulating positions in anticipation of a breakout. Now it could be making the Power of 3. Accumulation, manipulation and distribution.
Accumulation, manipulation and distribution
Eventually, this coiled energy resolved to the upside. BTC broke through the upper boundary of the accumulation zone with increasing volume and momentum, triggering a sharp rally and leading to the formation of a new all-time high. At that point, market sentiment turned decidedly bullish, with breakout traders entering the market, expecting continuation. However, the price failed to sustain above the previous ATH for long. Despite the breakout’s initial strength, Bitcoin was unable to establish a solid foothold above the critical psychological and technical level, which has now proven to be a key inflection point.
Soon after setting a new high, BTC began to reverse, shedding gains and retracing back below the former resistance level, which had temporarily acted as support. The breakdown below the $106,000 mark, previously the ceiling of the accumulation range, signaled a notable shift in market structure. What was initially viewed as a healthy continuation pattern evolved into what now appears to be a classic bull trap. This type of failed breakout often leaves market participants vulnerable, as late buyers are caught in drawdowns and early longs may be incentivized to exit positions.
Given this context, the recent price action carries the hallmarks of a Power of 3, where market makers and institutions may be offloading positions to less informed participants. This phase is often mistaken for continued accumulation by retail traders due to its structural similarity; however, the key difference lies in the failure to maintain new highs and the emergence of lower highs on any attempted bounce. The rejection above the ATH and the subsequent breakdown below $106K has introduced significant overhead supply, which may act as resistance in the near term.
Target levels
As BTC continues to trade below this critical level, the likelihood of a further retracement grows. The market appears to be transitioning into a phase of redistribution or distribution proper, where price is likely to be capped on rallies and pressured lower over time. It is reasonable to expect that Bitcoin could revisit $100.000 to mid-$90,000s, an area that may serve as a magnet for liquidity and a potential staging ground for the next major move. This region could represent a "Last Point of Supply" (LPSY) within the Wyckoff framework, typically the final area where smart money distributes before initiating a more decisive markdown phase.
Nevertheless, this potential pullback should not be viewed solely as a sign of weakness. In many bull cycles, such corrections and shakeouts serve to flush out over-leveraged positions and reset sentiment, ultimately laying the groundwork for renewed upward momentum. Should BTC find stability and demand re-emerge in the $95K–$100K range, it could mark the beginning of a new re-accumulation phase, leading to a healthier and more sustainable advance.
Conclusion
In summary, the recent breakout above ATH followed by a sharp reversal and loss of key support paints a cautionary picture in the short term. Bitcoin may currently be navigating a distribution zone, with downside pressure likely to persist as the market digests recent gains. However, such corrections are typical in broader uptrends and often present opportunities for strategic entries once the next accumulation structure becomes clear. Patience and disciplined observation will be essential as the market defines its next directional bias.
Thanks for your support.
- Make sure to follow me so you don't miss out on the next analysis!
- Drop a like and leave a comment!

AUDCAD | Double Top RejectionThe double top rejection mentioned in the last post. We can see that price topped out at 0.90 and is now retesting the breakout from the last swing low.

AUDCAD | HnS Pattern | 500pips DownPrice action has continued selling off after retesting the previous breakout below the neckline and will be looking to hit another 500pips+
When looking at local price action on lower timeframes the double top rejection at ~0.90 has entered a distribution phase which is signaling price to fall further with the first target at 0.88 and so on.
For price to hit the last target around 0.855 I would like to see a break first then a retest/distribution phase.

Mastering the ICT Power of 3 concept - How to use it in trading!The financial markets often appear chaotic and unpredictable, but behind the scenes, institutional players operate with clear strategies that shape price action. One such strategy is the ICT (Inner Circle Trader) "Power of 3" model, a framework used to understand and anticipate market cycles through three key phases: accumulation, manipulation, and distribution. This guide will break down each of these phases in detail, explaining how smart money operates and how retail traders can align themselves with the true direction of the market.
What will be discussed?
- The 3 phases
- Examples of the PO3
- How to trade the PO3
- Tips for trading the PO3
The 3 phases
Accumulation
The Accumulation Phase in the ICT "Power of 3" model refers to the initial stage of a market cycle where institutional or "smart money" participants quietly build their positions. During this time, price typically moves sideways within a tight range, often showing little to no clear direction. This is intentional. The market appears quiet or indecisive, which is designed to confuse retail traders and keep them out of alignment with the real intentions of the market's larger players.
In this phase, smart money is not looking to move the market dramatically. Instead, they are focused on accumulating long or short positions without drawing attention. They do this by keeping price contained within a consolidation zone. The idea is to gather enough liquidity, often from unsuspecting retail traders entering early breakout trades or trying to trade the range, before making a more aggressive move.
Manipulation
The Manipulation Phase in the ICT "Power of 3" model is the second stage that follows accumulation. This phase is where smart money deliberately moves the market in the opposite direction of their intended move to trigger retail stop losses, induce emotional decisions, and create liquidity.
After price has consolidated during accumulation, many retail traders are either already positioned or have orders waiting just outside the range, either stop losses from those trading the range or breakout orders from those anticipating a directional move. The manipulation phase exploits this positioning. Price will often break out of the accumulation range in one direction, appearing to confirm a new trend. This move is designed to look convincing, it might even come with a spike in volume or momentum to draw traders in.
However, this breakout is a false move. It doesn’t represent the true intention of smart money. Instead, it's meant to sweep liquidity, triggering stop losses above or below the range, and then reverse sharply. This stop run provides the liquidity needed for large players to finalize their positions at optimal prices. Once enough liquidity is collected, and retail traders are caught offside, the real move begins.
Distribution
The Distribution Phase in the ICT "Power of 3" model is the final stage of the cycle, following accumulation and manipulation. This is where the true intention of smart money is revealed, and the market makes a sustained, directional move, either bullish or bearish. Unlike the earlier phases, distribution is marked by clear price expansion, increased volatility, and decisive momentum.
After smart money has accumulated positions and shaken out retail traders through manipulation, they have the liquidity and positioning needed to drive the market in their desired direction. The distribution phase is where these positions are "distributed" into the broader market, meaning, institutions begin to offload their positions into the retail flow that is now chasing the move. Retail traders, seeing the strong trend, often jump in late, providing the liquidity for smart money to exit profitably.
This phase is typically what retail traders perceive as the real trend, and in a sense, it is. However, by the time the trend is obvious, smart money has already entered during accumulation and profited from the manipulation. What appears to be a breakout or trend continuation to most retail participants is actually the final leg of the smart money’s strategy. They are now unloading their positions while price continues to expand.
Examples of the Power of 3
How to trade the PO3?
Start by identifying a clear accumulation range. This typically happens during the Asian session or the early part of the London session. Price moves sideways, forming a consolidation zone. Your job here isn’t to trade, but to observe. Draw horizontal lines marking the high and low of the range. These become your key liquidity zones.
Next, anticipate the manipulation phase, which usually occurs during the London session or at the NY open. Price will often break out of the range, triggering stop losses above the high or below the low of the accumulation zone. This move is deceptive, it is not the real trend. Do not chase it. Instead, wait for signs of rejection, such as a sharp reversal after the liquidity grab, imbalance filling, or a shift in market structure on a lower timeframe (like a 1- or 5-minute chart).
Once manipulation has swept liquidity and price starts showing signs of reversing back inside the range or beyond, you now look for a confirmation of the true move, this begins the distribution phase. You enter in the direction opposite of the manipulation move, ideally once price breaks a structure level confirming that smart money has taken control.
For example, if price consolidates overnight, fakes a move to the downside (running sell stops), and then quickly reverses and breaks above a key swing high, that's your signal that the true move is likely up. Enter after the break and retest of structure, using a tight stop loss below the recent low. Your target should be based on liquidity pools, fair value gaps, or higher-timeframe imbalances.
The key to trading the Power of 3 is patience and precision. You're not trying to catch every move, but to wait for the market to complete its cycle of deception and then ride the clean expansion. Ideally, your entry comes just after manipulation, and you hold through the distribution/expansion phase, taking partials at key liquidity levels along the way.
Tips for trading the PO3
1. Learn price movements
Before you can effectively apply the ICT Power of 3 strategy, it’s crucial to have a deep understanding of how price behaves. This means being comfortable identifying market structure, recognizing trend direction, and interpreting candlestick dynamics. Since the Power of 3 is deeply rooted in how price moves in real time, a strong grasp of these basics will give you the confidence to read the market correctly as each phase develops.
2. Analyse multiple timeframes
Although the Power of 3 pattern shows up on lower timeframes, relying on just one can lead to misreads. You’ll gain a clearer picture when you align the short-term view with higher timeframe structure. For example, what appears to be accumulation on the 15-minute chart may simply be a retracement in a larger trend on the 1-hour or daily. By examining multiple timeframes together, you can better identify the true setup and avoid being tricked by noise.
3. Exercise patience
A key part of trading the Power of 3 is knowing when to act, and more importantly, when not to. It’s easy to get impatient during the accumulation or manipulation phases, but entering too early often leads to frustration or losses. True discipline comes from waiting for the expansion or distribution phase, when the market reveals its real direction. This is where the most favorable risk-to-reward setups occur.
Thanks for your support.
- Make sure to follow me so you don't miss out on the next analysis!
- Drop a like and leave a comment!

Wyckoff Distribution Unfolding: UTAD Confirmed, LPSY In ProgressThe 4H BTC/USDT chart presents a textbook Wyckoff Distribution structure nearing completion:
• Buying Climax (BC) defined the supply ceiling
• Secondary Test (ST) confirmed resistance zone
• Upthrust After Distribution (UTAD) swept above 106K, trapping late breakout buyers
• Price is now back at triangle support, potentially forming Last Point of Supply (LPSY)
Technical Snapshot (4H):
• Current Price: 102,540
• Bollinger Bands:
▸ Upper: 105,400
▸ Basis: 103,522
▸ Lower: 101,884
• 55 SMA: 103,642
• RSI: 44.85 (bearish momentum)
• Volume: Red bars rising, above 23.7K MA
What to Watch For:
A confirmed close below the triangle apex and lower Bollinger Band, with RSI below 45 and increased volume, would solidify the LPSY and trigger a likely markdown phase. Until then, the structure remains vulnerable but unconfirmed.
Bearish Targets (if breakdown confirms):
• TP1: 100,678 (horizontal + psychological)
• TP2: 99,595–98,115 (Fib retracement zone)
• TP3: Trail below breakdown with 1% callback logic
Wyckoff Perspective:
This appears to be Phase C, following a clear UTAD. If LPSY forms and support breaks, the market transitions into Phase D with accelerated markdown potential. Holding here may imply range extension or reaccumulation — next 1–2 candles are pivotal.

NZDJPY may end its rally with a correctionNZDJPY almost without pullbacks, with one impulse forms a strong fall. The potential is starting to run out and the market will need a breather. The current wave may test the zone of interest at 85.268 and move into the correction phase
The price is ready to test the strong support at 85.268, the limit level is most likely still in the market and may hold the support area and thus trigger a correction and pullback to 0.5 fibo
Scenario: fall to 85.268, false breakdown and rebound to the first zone of interest (imbalance) 86.500

GBPUSD → A false breakout can trigger a correction FX:GBPUSD is strengthening as part of the rally associated with the fall in the dollar index, but there is a technically strong resistance zone ahead that could trigger a correction...
The dollar index, due to US politics, desire for lower interest rates, tariff war, continues its decline, giving an advantage to the currency pairs of the main basket.
Against this background, the pound sterling is strengthening and is ready to test the key resistance at the moment: 1.343. The huge pool of liquidity, accumulated behind this area may not let the price up at the first time. The last test and confirmation of this level was half a year ago.
Resistance levels: 1.343
Support levels: 1.3292, 1.3207
A sharp approach to resistance, a false breakout without the possibility of growth continuation and consolidation below the resistance 1.3430 may provoke a correction in the imbalance zone or liquidity 1.3292.
Regards R. Linda!

NEIROUSDT → Countertrend momentum. Is the reversal close?BINANCE:NEIROUSDT.P is one of not many coins that is growing. But the only disadvantage is that the coin is at the bottom. Most likely it is forming a set of liquidity before continuing to fall.
NEIRO is strengthening and heading towards the resistance of the range while bitcoin continues its correction.
Strong resistance and liquidity zone at 0.187 is ahead. Strong gains could be stopped by a false breakout and reversal
Just because a coin is at the bottom doesn't mean it has nowhere to fall. Yes, there is.
At the moment the price is in the range on the background of a strong downtrend, within which the price does not show signs of life. The previous buyback ended with a strong sell-off.
Resistance levels: 0.000187, 0.0002045.
Support levels: 0.000169, 0.000154
In the short term, we should expect a false breakout, reversal and price drop to the support of the range.
I do not rule out a prolonged struggle in the resistance zone, within which the price may go higher and test the 0.00020 liquidity zone before continuing to fall, within which it may renew the bottom.
Regards R. Linda!

Ranging? Not Really. The Big Guys’ Plan Is Already Set…Ever wondered what the crowd is really doing behind the candles?
This video breaks down how to read Cumulative Volume Delta (CVD)—
from retail behavior to sentiment charts, and why the market doesn’t always follow logic.
✅ When price moves one way but the crowd trades the other...
✅ When sideways markets aren’t as neutral as they look...
✅ When emotions take over—and how to spot it in advance.
We’re lifting the hood. The engine’s running. Let’s see what drives it.

EOSUSDT → False Breakeout of resistance (counter-trend )BINANCE:EOSUSDT.P within the consolidation distribution 0.54 - 0.6 reaches the key resistance and forms a false breakdown without the possibility of continued growth.
The cryptocurrency market is showing weakness, especially after yesterday's Trump speech and the approval of new Tariffs, which creates risks and pressure on the cryptocurrency market. Bitcoin is back in the red zone after rallying, while altcoins will continue to look for a new bottom. EOS stands out in this list, which strengthened quite strongly and the purpose of this maneuver was countertrend accumulation and liquidity capture relative to the range of 0.7 - 0.8. The distribution is tempered by a false breakout of the level 0.82 - 0.86
Resistance levels: 0.82, 0.86
Support levels: 0.793, 0.666
If the bears hold the resistance 0.82 - 0.86 and the consolidation under the level will end with the breakout of the trigger 0.793 and price consolidation in the selling zone, it may provoke a reversal and fall to the zones of interest: fvg, 0.64, 0.541.
Regards R. Linda!

BTC - Slight Distribution After Nearly 10xMorning my fellow traders, and happy new year!
I hope you do not have a hangover right now. But if you do, get a tea going, it usually does the trick for me!
I can't deny the possibilities for another rally to take out the highs, but I'm thinking what the market makers are planning is a simple inverted Adam & Eve pattern that will lead us to new opportunities within the next month or so.
Keep in mind that for sometime now Alts have not been giving, and I believe that after this next Alt season (which I believe we will still get), they will keep giving less and less.
I sold near $100k for probably a couple weeks now. Did not get a perfect $108k sale, which is fine. Now I'll focus on a reentry if this plays out.
Trade thirsty, my friends!

Possible Distribution Scheme in XRP (Chaotic Scenario)Someone asked me what the most chaotic scenario for XRP's price could be — and I answered: a long-term Distribution phase.
In this image, I illustrate a radical distribution scheme that could potentially extend into late 2025. But first, a sign of weakness — with price dropping below the Corona Dump levels, possibly close to $0.10. Sounds absurd to many, I know.
If it's Scheme 1, XRP would drop and then bounce back to the Last Point of Supply (yellow line).
If it's Scheme 2 (red line), price could spike between $5 to $6.8, with an average peak around $5.5–$5.7, likely triggering extreme euphoria.
But remember, this is just one insane possibility — and it depends heavily on Bitcoin, Market Makers, Supply vs Demand, public interest, and the macroeconomic context.
If this scenario plays out… what would YOU do?

$NVIDIA ─ Wyckoff Distribution #4 aka Rising Wedge PatternVANTAGE:NVIDIA ─ Wyckoff Distribution #4 aka Rising Wedge Pattern
Although Rising wedge turning into more like Rising Channel distribution idea is still valid.
#2 Long Trade TP1 Hit so far 🔥
------------
------------
Note: This is the most positive outcome possible.
As always, my play is:
✅ 50% out at TP1
✅ Move SL to entry
✅ Pre-set the rest of the position across remaining TPs
It's important to take profits along the way and not turn a winning trade into a losing trade.

MEWUSDT → False breakout of resistance after distributionBINANCE:MEWUSDT.P in the distribution phase is testing a strong resistance and liquidity zone against which it makes a false breakout.
Regarding the current situation, we should pay attention to several key levels - support and upper resistance. A retest of 0.00300 - 0.00312 is possible, the target of which could be another liquidity zone, before MEW continues its fall according to the current local and global trend, which have a common direction on the background of weak bitcoin and weak cryptocurrency market.
Resistance levels: 0.002793, 0.003, 0.00312
Support levels: 0.002696
The key support area plays the role of 0.002696, which are trying to contain the market. Below this line is a free zone and there are no levels that can prevent the movement. Thus, the breakdown and consolidation of the price under 0.026969 can provoke a strong impulse towards the zones of interest 0.00222, 0.002
Regards R. Linda!

LAYERUSDT → Far retest of key resistance at 1.400BINANCE:LAYERUSDT.P is forming a realization within the uptrend. The coin is stronger than the market, but the initial reaction to the strong resistance at 1.400 may be in the form of a false breakout and a pullback to 1.275 or 0.5 fibo
Since the opening of the session, LAYERUSDT has passed the daily ATR, but after reaching the resistance, the coin may not have the potential to continue rising. Liquidity above the 1.400 level may hold this area and prevent the coin from breaking through this zone the first time around.
Bitcoin is testing trend resistance at this time and could likely form a rebound or a continuation of the decline, which could affect altcoins accordingly!
Resistance levels: 1.400
Support levels: 1.2932, 1.2747, 0.5 fibo
BUT ! Everything depends on the price reaction at 1.400. A sharp and distributive approach with 90% probability will end in a false breakout and correction to the mentioned targets.
But, if LAYER starts to slow down and consolidate in front of the level, an attempt of breakout and struggle above 1.400 is possible and further movement will depend on it.
Regards R. Linda!

EURAUD → False breakout & Pin-Bar on W1FX:EURAUD is testing important resistance from the weekly timeframe. A false breakout is formed after liquidity capture. There is no potential for continuation of growth and the chart is drawing everyone's favorite “pin-bar”
After the price exits the consolidation, the resistance of which was the level of 1.6787, a distributive pattern is formed, the target of which was the liquidity behind the weekly resistance of 1.7196.
The target has been reached and the price is consolidating below the base of the reversal structure and thus preparing to continue falling. It is possible formation of liquidation or downward impulse to 1.71 - 1.70. The forex market has been behaving calmly since the opening of the week and the market can work out technical nuances calmly, until the fundamental factors are connected.
Resistance levels: 1.7196 - 1.7304
Support levels: 1.7107, 1.7016
Zones of interest are located behind the local lows, but from a technical point of view, the market is most interested in liquidity beyond 1.6787 and there are all chances to reach this zone, as there are no obstacles below 1.7016. Accordingly, when the support at 1.7016 is broken, a free zone will open up
Regards R. Linda!
