BTCEUR, example of a trend break after active accumulation.Example of a trend break after active accumulation.
The analysis was performed using the X-volume indicator. Thin vertical dashed lines indicate candles with active accumulation. The blue dashed lines indicate the process of redistribution. For details, refer to the instructions for the indicator. It should be noted that it is not true to speak of a trend change analyzing only a few bars.
Distribution

CAUTION! Possible distribution phaseI find ETC USD chart abnormally similar to text book distribution phase. Everything is presented on a chart. This is only my opinion, use it, or not.

$AMZN - Amazon is "OUT OF RALLY TIME" using Time@Mode Amazon has rallied for 15 weeks into last week's close after accumulating at the mode back this past fall for 15 weeks. In other words: Amazon has "run out of time".
Once Amazon blasted off on its previous earnings report back in October, it kicked off a 15 week rally which ran far beyond the rally that was implied by the previous move from $766 (where it lingered for 17 weeks in 2016 and had a 22 week rally out of that accumulation). A move from $766 to $980 was 29% and the implied rally from $980 was also 29%, but it ran up over 50% (see chart).
Now that $AMZN has reached $1498, the PSR reached 4 times (an extreme reading) while the free cash flow yield has fallen to 1%, which means that the $7 billion in free cash flow is only 1% of the $700 billion in market cap for Amazon. Growth over the coming decade will help drive up that yield, but right now that is the return you would earn if you took Amazon private.
Using the Time@Mode methodology, together with Key Earnings Levels stemming from quarterly earnings reports and raw and relative valuation analysis, we can see here that Amazon has "RUN OUT OF TIME" on a weekly basis for this rally and would only expect it to move sideways to down over the upcoming 15 week time frame as a new level of consolidation builds as the fundamentals "catch up".
For now: It is opportunistic to sell short $AMZN with 5%-10% downside targets. Cover and re-short on 75% rebounds as many times as possible for the next 14 weeks.
Tim
12:41PM EST February 7, 2018 $1439 last $AMZN

Accumulation & Distribution...So I'm glad I finally got to wipe my nose... but I'm pushing through making these video's for you guys, because I know you guys are hungry to get to mucking up your own charts with some awesome strategies!!
Lets talk Accumulation & Distribution

BTCUSD - Has Further to fallBTCUSD is in the last phase before a further move down. If the price cannot get above the ICE, the price will fall further. See the Attached YouTube video on distribution to explain the concept.
www.youtube.com


XRPUSD is squeezing the weak longsThe breakdown of the XRPUSD from the big speculative top formation is readily apparent from the chart.
The market is driving towards the weak long holders' stop order pool to wash out weak longs. Until those trapped weak longs are washed out, we are not going to see price rallying above 2.4 dollar mark.
What I am looking for is a accumulation pattern below 1.4 dollar before switching my bias to the long side.

A great example of trading alt-coins with more than 500%+ profitWhen it comes to cryptocurrency trading, almost everyone is looking for quick wins... Buy and sell after 5%, repeat this several times in a week and boom... But what about playing the game in a different way... Here's a great strategy to make 500% on almost every trade you will make...
Just watch out for new cryptocurrencies getting into the game in Bittrex. For example, Enigma ( BITTREX:ENGBTC )... This coin has become available for trading on Bittrex appr. 33 days ago. When it dropped down and stabilized, I purchased plenty amount of ENG and hold it for 33 days. At the end of 33 days, I sold a small amount of ENG with more than 500% profit!!!
What you need to do is, you need to buy in accumulation phase and sell in distribution phase... It's so easy...
Happy Trading!

Bitcoin Wyckoff Distribution EventNOTE:
I am not actually in a short position as I really dislike shorting bitcoin at times like this.
It is a risky maneuver especially since Bitcoin often rallies hard to the surprise of many.
I have just sold all my Bitcoin holdings which I have held since earlier this year.
2017 has been an amazing rally for Bitcoin with almost 100x growth.
With the opening of futures markets and the continuing drama among the bitcoin community filled with uncertainty about the identity of Bitcoin, it appears a Wyckoff Distribution Event has been engineered by the new and incoming large interests.
This certainly does not spell the end of Bitcoin, but Bitcoin has a history of 90% crashes after 10,000% rallies.
It is hard to tell when and at what price Bitcoin will enter an Accumulation Event and reverse, but I will be sure to re-enter the market at that point.
For now, it seems that Bitcoin's long rally will come to an end, and this is a nice point of exit for those who have made substantial profits this year.
Merry Christmas and Happy New Year!
Here's to a great and prosperous 2018 for all!
Extra Note:
This analysis may very well fail if Bitcoin does not fall below the highlighted trading range again in the next couple of days!

EURSEK Lets short it for 1500 pips!Trading method: RSADVANTAGE Stage 5, accurate system manually forward tested over 3 years designed to stay out of ranging markets and only target strong trends suited for swing trading. This system is made of custom adaptive volume indicators and Oscillators that properly detect trends very early and provides exit signals at dynamic S/R zones once the trend has ended. // Average yearly pips gained is 40k per pair on D1 charts alone. I have provided a similar limited version of the system on Trading view to help traders visualize the strategy.
EURSEK
To open SHORT positions for EURSEK , it is required:
In this situation our system indicators to confirm trade entry confirmation for movement to the downside but if the market trend continues to range this signal will become invalid. Market execution for entry, I will confirm signal once the conditions have been met.
Risk Description: Once signal is confirmed we will excecute more positions on the position on H1 and 30M charts. Minimum 1500 pips will be up for grab with small risk SL at swing high. Target 2500 pips
Profit expectations: 1-4 day trade length expected before hitting profit target I will post exit strategy when signal receives a exit signal.

LTCBTC Wyckoff distributionLTC broke down from it's 0.618 fib, and has now found support on 0.768.
Its oscillation with BTC has graphed a wyckoff distribution cycle, which currently will be turning to throwback for a retest of 0.01 BTC.
Several market signals point to a local bottom having been reached. CMF is showing bullish divergence on the daily for LTCBTC, and BTC has reached its channel top and is showing bearish divergence.
Long Target: 0.01 BTC
Long SL: 0.007 BTC
Short Target: 0.005 BTC
This is my personal analysis and should be taken as such. I'll update this Idea as the trade goes forward.
Hope you enjoyed and Happy trading!

EUR/USD : Daily sell setup #2 ** (Another 300 pips?) Hey guys !
The H&S Pattern is now confirmed on eurusd
You can short on the neckline or try higher for a better entry.
Accumulation of :
- Breakout and retest of few trendlines
- Fibonacci confluence
Entry , targets & stop loss are sets with standard deviation , pivot ,support/resistance zone, fibonacci retracements and trendlines .
Good luck !

USD Wyckoff DistributionMaking the case that the market has been in distribution of the USD since early in 2015 when a buying climax (BC) occurred. Since then the USD has been in a trading range with Signs of Weakness (SOW). Most of 2016 low volume adsorption occurred with an upthrust using the presidential elections as springboard. In 2017 we have seen signs of weakness with increased volumes on the selloffs and decreased volumes on the rallies. The first ice was broken with a jump of the confluence of the 200dma and yearly pivot point. A backup to this support level can be expected with a fall through the ice again. So I am looking for a short term rally and then a strong move through the ice.


$rl short weak bouncehigher time frame shows defined downtrend pulling back after strong impulse move
mid time frame shows uptrend weakening and mature looking for a breakdown with negative momentum and negative volume pressure
lower time frame is working bottom of base- worth monitoring for possible false breakdown and continuing consolidation
breakdown of support level of 71.3x area to first target of 70.7x area and next level to 69.8x area

$xlp further short term breakdownhigher time frame is showing defined uptrend with an over-extension on breakout pulling back
mid time frame is showing markup to distribution to consolidation for the next leg down
descending triangle is forming against downtrend line and multiple test of support is showing weakness
possible breakdown to breakout level of 55.7x on higher time frame- first level 56.2x
lower time frame is showing range bound action with sellers slightly in control
descending triangle is also forming- worth monitoring price action

$spy weakening trend short term downside higher time frame is showing defined uptrend with indecision
mid time frame is showing range bound action/distribution
it also shows a break of first uptrend line and a false breakout towards the resistance area of first trend line and price broke down through the second trend line which shows a weakening of the trend
bounces off the third trend line which is also the .618 retracement level back into the range
rsi is showing negative divergence and volume is showing selling pressure
lower time frame shows a break of the downtrend line into resistance area of 243.5x
worth monitoring price action-possibly break resistance area and moves towards resistance of second trend line in mid time frame and move back down

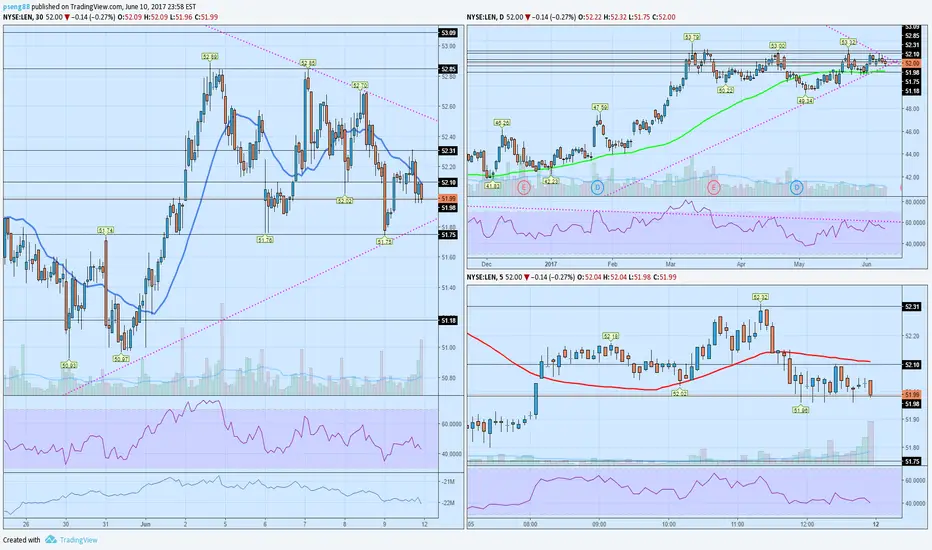
$len losing momentum/distribution higher time frame is showing range bound price action- negative divergence in rsi
closer look at mid time frame shows the transition from a range expansion to range contraction and selling volume pressure being applied along with negative momentum
lower time frame shows price action in that same range contraction apply pressure to the support area with multiple retest
looking for alignment across all timeframes to tilt to the bearish side where theres is the least resistance to the downside
first level to 51.7x area and then down to 51.1x

J6 06 April 2017There are several divergences on volume on way up. There is also increasing volume on down swing. This is bearish change behaviour. I expect move down on Yen future. It means on forex pair USDJPY.

EURGBP 06 April 2017Last week highest volume bar acts as resisstance. We saw the price bouncing the zone. Now, it should go down.
On daily chart EURGBP broke trend line

Kiwi continue downtrend after re-ditributionClearly visible on cumulative volume selling pressure - falling through the ICE pattern.
Wait for pullback and go short.
