GBPUSD - Still Bullish - Dont trap your self ! Hi Guyz, welcome to other episode of analysis for GBPUSD.
From our 1H chat, it is seen that as per DOW Theory, the market has broken the HL and it seems like market has entered into the bearish trend However, the catch is there is no divergence followed by the break of HL. It implies that market is taking a corrective move, which is 50 percent of FIB level. Thus, there is a formation of AB=CD harmonic pattern.
we plan our entry on the break of "B" point and projected TP in our case is "D" point.
stop loss is placed beneath HL as marked.
Divergence

Hidden Bullish Divergence on Bigger tf.HTL Closed at 44.65 (13-05-2025)
Hidden Bullish Divergence on Bigger tf.
If 41 is not Broken, we may witness
upside towards 46.50 - 47 & then
50 to 55.

EURAUD - Bearish Trend to Start - Harmonic + Divergence ComboHello Friends, Market after making series of HH and HLs, have finally made a fantastic Bearish Divergence on 1H time frame which is clear sign of correction.
Further market has almost completed AB=CD harmonic pattern, which is suggesting Potential Reversal Point as marked.
these confluences suggest a bearish trend to start
We are waiting for the neckline (HL) to break with a good candle and then we enter into the market with TP1 and TP2 with a R:R of 1:1 and 1:2 respectively. Further, place stoploss slightly above the HH.


MICROSOFT - Simple Analysis WIN ! Its Bearish Ahead ! MAGIC Microsoft - Lets explore the magic of Technical Analysis / Price action.
Microsoft is currently testing the daily resistance level and it will be more matured once the bearish candle / rejection candle is formed. We see a bearish divergence at this level which is a strong confluence for the bearish trend a head.
forgot to mention, a perfect bookish - Bearish Crab pattern is forming, which is a forming a Potential Reversal Zone (PRZ).
we expect our entry after confirmation on the break of HL - 447 level and then we can plan our TPs accordingly.
Please like and comment!

Bullish Divergence
Closed at 26.89 (05-06-2025)
27.50 - 28 is an Immediate Important
Resistance that needs to cross & sustain
for further upside.
There is a Bullish Divergence which may
help this time to break the resistance.
But better approach would be to wait
for the Resistance to cross & then take entry.
If it does, 32 - 33 is easily reachable.
On the flip side, it should not break 23.50
otherwise there would be more selling pressure.

GBPUSD: Potential Reversal After Strong RallyThe British Pound has shown strong gains against the US Dollar, approaching a key resistance area. After such an extended move, a correction or reversal would be a logical expectation.
Technical Setup
There is a clear series of bearish divergences on the CCI (14) indicator. Price is forming a narrowing rising wedge, which often signals trend exhaustion.
Trade Plan
Sell limit orders: 1.3690 and 1.3850
Market entry: Only after confirmation — either a trendline break or a moving average crossover
Conclusion
GBPUSD shows signs of weakening at the top. I remain focused on short setups from resistance areas, waiting for confirmation to act.

Very Good Monthly Closing.
Closed at 323.58 (30-05-2025)
Very Good Monthly Closing.
Seems like Crossing the Resistance of 329-330
this time.
Potential to touch 390 -400 initially & then
500+ if 395 is Sustained.
However, should not break 305 - 307.

Bullish Flag Pattern on Bigger tf + Bullish Divergence
Closed at 60.50 (02-06-2025)
Bullish Flag Pattern on Bigger tf + Bullish Divergence
is there.
54.50 - 62.50 is an Important Support
Zone. If this level is Sustained, we may
witness further upside towards 70-71.
A very Important Resistance Level is around 90-92
which if Crossed with Good Volumes, may expose
new highs.
On the flip side, breaking 51 may bring more selling
pressure.

As ECB Ready's "Final Cut", EJ "Begins Reversal"OANDA:EURJPY has began to potentially form a very strong Triple Reversal Pattern, The Head and Shoulders @ the Resistance Level lasted visited May 14th.
I say "potentially" because the "Right Shoulder" or recent Lower High has been created but we still wait for the final decline to the "Neckline" or Support Area formed by the Lows separating the "Head" from the "Shoulders" or Higher High from the Lower Highs in the pattern!
Signs of Potential Head & Shoulders:
1) Left Shoulder is an Oversold High
2) A Higher High is created at a level of Resistance
3) The Head not only has the Most Volume concentrated in the Pattern, but is also the start of the RSI Divergence from Price
4) Right Shoulder is formed and unable to surpass the Left Shoulder
..Bringing us to a very important tell..
5) Volume Decreases and logs a 3rd Divergent High in the RSI @ the creation of the Right Shoulder
Now we must WAIT for CONFIRMATION of the Pattern!
This will come when Price:
1) Declines to the Neckline
&
2) Makes Successful Breakout
Once the Head & Shoulders is Confirmed and Breakout is Validated:
- This could deliver great Short opportunities as a Head and Shoulders Breakout and Retest at the Neckline being the Last Line of Defense for the Bulls if Bears can push Price through and pick up Volume!
Fundamentally, BOJ Governor Kazuo Ueda will be speaking on Tuesday, June 3rd where we could see volatility come in for JPY.
The ECB is expected to cut rates by 25 bps from 2.4% to 2.15% on Thursday, June 5th and this could be the Last Cut we see the ECB plan to make until they see downside growth risks make more cuts likely.

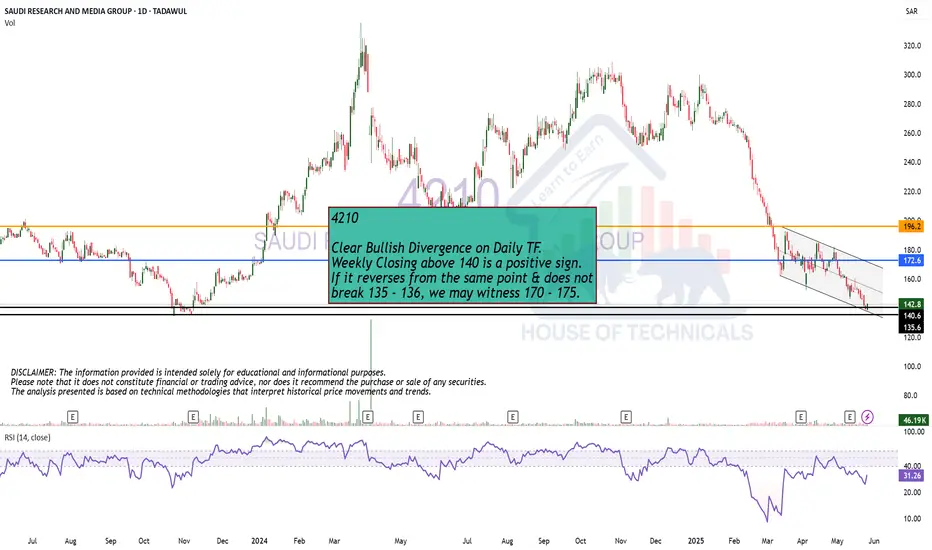
Clear Bullish Divergence on Daily TF.
Clear Bullish Divergence on Daily TF.
Weekly Closing above 140 is a positive sign.
If it reverses from the same point & does not
break 135 - 136, we may witness 170 - 175.
$US10Y and $DXY Divergence and correlation breakdownRecent weeks we might have missed some underlying churn in the market dynamics. Recently there has been a clear visible divergence in TVC:US10Y and TVC:DXY in midst of all the noise about the tariffs. Usually with rising TVC:US10Y yield the US Dollar index TVC:DXY rises with it as visible in the chart below. In this blog we have been following the downward slopping channel in the TVC:US10Y and the yield has remained within this tight range of the channel. In our last blog on 02 May 25 we called for a lower TVC:US10Y @ 4%. Seems that call was incorrect and I was wrong. But in this space, we have been asking for a lower $DXY. The TVC:DXY chart is making lower highs and lower lows and in a verge of a breakdown.
So we have higher TVC:US10Y which is capped to the upside @ 4.6% visible from the upper end of the downward slopping channel and we have TVC:DXY making lower lows but the correlation is broken in the recent weeks as shown in the daily chart below. This kind of unpredictable market behavior it’s difficult to forecast equity market direction. TVC:US10Y seems to create headwind for equities but the lower TVC:DXY is good for risk assets like CRYPTOCAP:BTC , SP:SPX and $QQQ. Hence this push and pull will keep the markets range bound for now.
Verdict : TVC:US10Y currently at top of the range, downside more likely ; TVC:DXY continues to struggle and in penalty box.

Gold Bulls Taking a Breather?Gold has been in an overall uptrend since late January, steadily climbing with strong bullish momentum. After peaking around $3,440 in early April, price pulled back and found support near $3,171, bouncing from that level and now approaching resistance around $3,300.
Recently, price has shown signs of recovery, but the move still hasn’t broken the downtrend from the previous highs. The current area near $3,300–$3,365 is critical. If Gold can break and hold above this zone, it may retest the $3,440 high. But if price gets rejected again, a pullback toward $3,171 or even $2,972 is possible.
Technical indicators are sending mixed signals. The RSI is around 57, showing moderate bullish strength, but not overbought. However, the Stochastic is in overbought territory with a bearish crossover forming, which could mean a short-term dip is coming. Gold is still trading above all major moving averages, which supports a longer-term bullish outlook.
The bigger picture favors bulls, especially because of recent economic and geopolitical news. The U.S. Dollar has weakened after Moody’s downgraded the U.S. credit rating and concerns grew over a massive new tax-cut bill. Tensions between the U.S. and China, as well as ongoing conflicts in Gaza and Ukraine, have also driven safe-haven demand. Meanwhile, traders are betting on potential rate cuts later in 2025, which tends to boost Gold.
Key levels to watch:
Resistance: $3,300 and $3,440
Support: $3,171 and $2,972
Bias Summary:
Upward Bias: Weak USD, rising geopolitical risk, safe-haven demand, Fed rate cut expectations, price above major moving averages, aggressive central bank buying
Neutral Bias: RSI mid-range, price near resistance
Downward Bias: Stochastic overbought with bearish crossover, potential lower high formation, hidden bearish divergence.
Overall Bias: Bullish Long-term, Bearish potential short term – Fundamentals support further upside, but caution is needed near resistance for retracements.

$SPY – Bearish RSI Divergence + Gap Below = Risky Setup👀 The RSI divergence has been signaling weakness for several sessions — with lower highs on momentum while price made higher highs.
And now, we’re stalling right at a volume shelf (see VRVP) with a big unfilled gap looming just below.
⚠️ Things to watch:
Bearish RSI divergence ✔️
Price breakdown confirmation below $582
Gap fill target = ~$572
VRVP shows thin volume beneath current price
If momentum rolls over from here, this could accelerate fast into that gap zone.

BTC Potential Short-Term PullbackBINANCE:BTCUSDT could be setting itself up for a short-term pullback.
It might be forming a Daily RSI Bear Divergence, with the latest retest of the the main supply zone, and RSI Divs/Breakouts have been reliable leading signals for recent CRYPTOCAP:BTC PA.
Key Levels to Watch
• $119k - Measured wedge target, confirmed with last month's breakout.
• $106.2k-$109.5k - Main supply and ATH, a sustained break above it would invalidate any bearish PA.
• $89.6k-$91.9k - Lots of confluence here:
- Unmitigated daily FVG
- The 200-day EMA is sitting there
- A move here would be between 0.5 and 0.618 Fib retracement of the last leg up, consistent with the typical pullback length of Wave 2 (Elliott Waves theory)
- It has also been an important S/R since November 2024, and a retracement here could form an Inverse Head and Shoulders pattern.
I would be patient with it, as I still see a lot of uncertainty short-term, but I think a pullback to ~$90k could offer a great long entry. Worth keeping a close eye on it.

I Think I Should Just Trade This SetupI Think I Should Just Trade This Setup
So long story short, I just:
0. Assess whether price has Seeked Liquidity, or Rebalanced Fair Value to get a clue of current price intention.
1. Wait for Overextended Price (Bearish or Bullish), Higher TF = Better
2. Wait for 4HR up to 15min Divergence + Oversold/Overbought, at least 2 TF with same divergence
3. On 15min, plot your FVA (PDA must be respected).
4. Look for your FVG entry once price has left the FVA.
5. Target nPOCs that align with divergence + price action direction (ex. npoc below price + bearish div + premium array respected + bearish orderflow leg)
I've been winning "random" trades like this, no TradingView needed, just MT5, and has saved my funded account from imminent death lol. But here's how, if I looked back on those trades, I entered.
I mean, this makes sense. Combine Price Action(PDA + FVA Respected) with Volume Momentum.
Oh, and just to add. I think nPOCs from previous sessions give a good clue about where price wants to go.
For example, npoc below price + bearish div & overbought + premium array respected + bearish orderflow leg = target nPOC.
I might have to track tradingview entries to see if this actually works.

Divergence Since 2020 - What Happens When Bonds Continue?When Stocks & Bond Move Opposite Direction what does it mean?
We have observed a divergence between the stock and bond markets since 2020. While U.S. Treasury bonds entered a bear zone, the stock markets continued their upward climb. What are the implications of this decoupling?
Will the stock market resume its uptrend and hit new highs? Or is this merely a retracement before further downward pressure?
A healthy, three-way interdependent relationship occurs when the economy, bonds, and stocks move in the same direction. When investors have confidence in the U.S. economy, they tend to invest in long-term bonds, which it usually will benefits the stock market.
This alignment was evident between 2000 and 2020, during which bonds and stocks moved largely in tandem.
However, from 2020 onward, bonds began declining—signaling a loss of investor confidence in the economy. Technically, this should exert downward pressure on stocks as well.
Yet, we are witnessing a divergence: Where U.S. Treasury bonds have fallen while stocks have continued to rise.
When such a divergence surfaces, it signals the need for caution in our approach in the stock markets.
What could be the other reasons why US T-bond has peaked in 2020 and depreciated by 44% since then?
Micro E-mini Nasdaq Futures and Options
Ticker: MNQ
Minimum fluctuation:
0.25 index points = $0.50
Disclaimer:
• What presented here is not a recommendation, please consult your licensed broker.
• Our mission is to create lateral thinking skills for every investor and trader, knowing when to take a calculated risk with market uncertainty and a bolder risk when opportunity arises.
CME Real-time Market Data help identify trading set-ups in real-time and express my market views. If you have futures in your trading portfolio, you can check out on CME Group data plans available that suit your trading needs www.tradingview.com
Trading the Micro: www.cmegroup.com

BTC bull cycle comes to an end.We can see it clearly on the chart. BTC has ended the 5 waves pattern in Elliot wave count. you can see it on the chart, you can see it on the MACD & RSI.
What we are seeing now is that because of Greed & Hype no one is selling bitcoin. the up-trend we are seeing now is the result of no sellers and Hype Buyers. This is a bull trap. We can see the divergence clear as day. Stay alert and dont let them catch you this time.

Short Idea on Silver (XAGUSD)Based On :
- 1h Supply covered by weekly
- POIV divergence
- IQMS Extremes about to flip


Played exactly the same as predicted last week. KSE100 Closed at 114113.94 (02-05-2025)
Played exactly the same as predicted last week.
Now seems like Hidden Bullish Divergence is appearing.
Important Supports :
S1 around 113100 - 113400
S2 around 110500 - 110800
Important Resistances :
R1 around 114630 - 115120
R2 around 117000 - 117500
