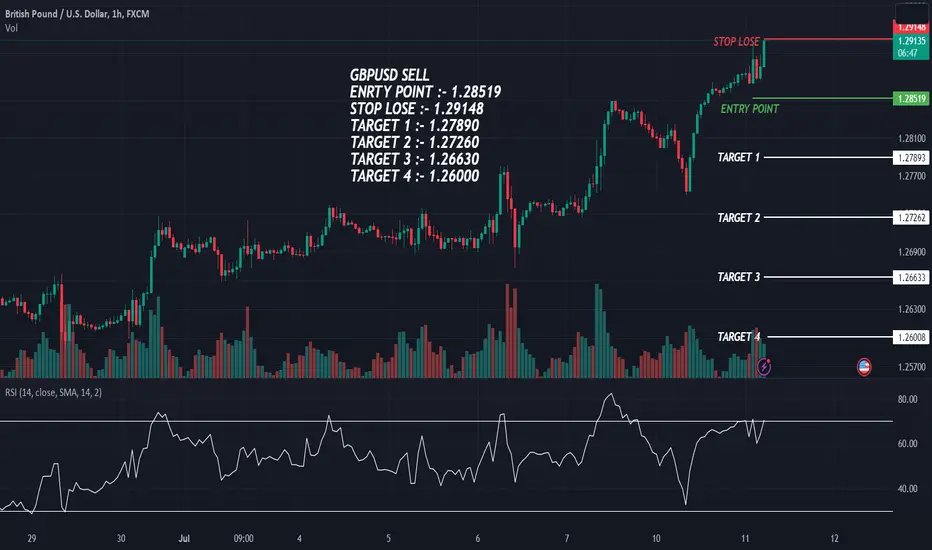
GBPUSD SELLGBPUSD SELL
Entry Point :- 1.28519
Stop Lose :- 1.29148
Target 1 :- 1.27890
Target 2 :- 1.27260
Target 3 :- 1.26630
Target 4 :- 1.26000
Divergence
Will Novavax NVAX go higher? SHORTNVAX popped today for a price jump of more than 20%. Canada agreed to pay out on a contract
for COVID vaccines it now does not want in the amount of $350M. This is hardly enough to
the fundamentals of the company overall. So the question arises, have traders and / or
investors overreacted to a one time bonus which is essentially revenue without overhead and
expense. My opinion is that this is an overreaction and that the price will drop after the
pop hits a high. Buying long right now is essentially the risk of buying a high that will not
go higher. On the Chris Moody dual RSI indicator, the longer one hour TM in black is over
75 while the shorter 5 minute TM in blue has peaked and dropped from 95 to 60. This is
in essence bearish divergence. The other indicator, the mass index, shows the value
arriving at the reversal zone where a drop to below 26.5 will be the trigger.
Overall, for both fundamental and technical reasons, I will enter a short trade on NVAX
expecting a correction / pullback from the pop the stock got after a one-time bonus of
a payout for not producing unneeded vaccines.

GOLD interesting setup.After arriving at the 200 EMA, Gold has made a bullish RSI divergence on the daily chart. This could act a possible consolidation area or serve as the beginning of a fresh up move.

NZDJPYNZDJPY is moving in an ascending channel. The market has reached the major resistance level. The market created a divergence at a major resistance zone. The price is near the 89.000 psychological level, and if it rejects the level, then we might see a massive drop from it

Short Infy Continuation of bigger trendShort infy with sl above1336
1) Bigger trend Down
2) Divergence Check
3) Small trend losing Momentum

Bullish Divergence UpdateBullish Divergence has set the trend and price will continue upward above $100 for the rest of the year into 2024

PROCTOR & GAMBLE IS SOON TO SEE GOOD TIMES AHEADTECHNICALS -
HIDDEN BULLISH DIVERGENCE -
Procter & Gamble has formed a nice Positive Divergence or Hidden Bullish Divergence pattern on the Monthly chart indicating upside momentum on the chart
STRONG SUPPORT LEVEL
It has also Reversed Twice from a Strong Support zone which had earlier acted as Resistance level indicating further upside potential for the stock
REVERSAL FROM 50D SMA
It has also tested 50 Day Moving Average and has reversed from it nicely
FUNDAMENTALS -
NON-CYCLICAL STOCK -
It is in the sector of Consumer Non-Durable Goods (healthcare & hygiene) which is an all-weather sector making the stock immune even to the upcoming recession (if it comes at all)
EBITDA & NET PROFIT -
Its EBITDA & Net Profit Margin growth stands at 24% & 17% which beats almost 90% of its peers and ROE is at 31% which is the industry standard
DIVIDEND YIELD -
If that's not enough then the stock also gives a dividend with yield at 2.72% and it has paid dividend for 133 years and raised dividend for 67 consecutive years, what could be a better alternative than such a stable dividend paying stock during the upcoming downturn in the market (if it comes)

The Bullish Case for Bitcoin! A Comprehensive AnalysisIf price manage to break the falling Wedge . the price can easily reach the target after a little correction.
🌟 Bullish signals in the PRZ area are:
- Support zone
- Pivot yearly
- Bullish Channel
- falling Wegde
- bollinger band
- 5th Waves
⭐ and the bullish signals of market momentum are:
- Regular divergence in MACD
➡️ Note if the PRZ is broken downwards with the strength of Bearish candles or Wedge broken from the bottom , this analysis of ours will be failed.
✅If this post was useful for you, like it ❤️ and if you think it is useful for your friends, be sure to send it to them.
_ _ _ _ _ _ _ _ _ _ _ _ _ _ _ _ _ _ _ _ _ _ _ _ _ _ _ _ _ _ _ _ _
🌍Thank you for seeing idea .
Have a nice day and Good luck.

USD/CHF many reasons to increaseHi every one
U.S. DOLLAR / SWISS FRANC
chart is speaking it self!!
the USD/CHF has finished It's first five waves of Elliot wave principle movement (12345 Impulse wave) and now It must begin the ABC correction wave!
there is also a falling wedge pattern which means that the price would increase and the price has already broken the pattern!
the price now is making a pull back to the descending triangle (which is shown in the picture) if the price breaks that triangle we shall see a lot of increase in the price!
and also there is a regular bullish divergence as well (+RD) which means the price would increase!
Traders, if you liked this idea or have your opinion on it, write in the comments, We will be glad.
Things can change...
The markets are always changing and even with all these signals, the market changes tend to be strong and fast!!
Thank you for seeing idea .
Have a nice day and Good luck

The Divergence Cheat Sheet: Your Quick Reference GuideHello dear @TradingView community!
In this guide, we will delve into the concept of divergence and its significance in technical analysis, specifically focusing on its application in the cryptocurrency market, particularly Bitcoin.
Understanding Divergence: A Key Concept in Trading
Divergence occurs when the price of an asset and an indicator, such as the Relative Strength Index (RSI), move in opposite directions. This pattern provides valuable insights into potential price reversals or changes in trends.
The Divergence Cheat Sheet
To help us identify and interpret divergence patterns, a divergence cheat sheet can be an invaluable tool. It provides a concise overview of different divergence patterns and assists us in making timely and accurate decisions.
By having a cheat sheet on hand, you can save time, reduce errors, and ensure they don't miss crucial signals in the fast-paced cryptocurrency market.
Detecting Divergence
Detecting divergence is crucial for identifying lucrative trading opportunities. By using divergence indicators like the RSI, MACD, or Stochastic Oscillator, we can gain significant insights into market trends and potential price reversals.
To pinpoint divergence effectively, follow these steps:
Choose an indicator capable of detecting divergence, such as the RSI, MACD, or Stochastic Oscillator.
Look for discrepancies between the indicator and the price action. Regular divergence occurs when the price and the indicator move in opposite directions, while hidden divergence occurs when they move in the same direction but at different rates.
Monitor the direction of the trend. Divergence can indicate a trend reversal, so keeping track of the current market trend is crucial.
Confirm the divergence signal with other technical analysis tools. Divergence is just one piece of the puzzle, so it's essential to use other indicators to validate your trading decisions.
Examples of Divergence in Trading Charts
Let's examine a few examples of divergence on Bitcoin charts:
Strong Bullish Divergence:
When lows of the price decreases while the RSI increases, a regular bullish divergence occurs. This signals a potential trend reversal and presents an opportunity for a bullish trade.
Strong Bearish Divergence:
When highs the price of an asset is rising while the RSI is falling, it indicates a regular bearish divergence. This suggests a potential trend reversal and presents an opportunity for a bearish trade.
Medium Bullish Divergence:
When the lows of an asset remain equal while the RSI is rising, it indicates a medium bullish divergence. This suggests a potential increase in price, although it may not be a strong upward movement.
Medium Bearish Divergence:
When the highs of an asset remain unchanged while the RSI is decreasing, it indicates a medium bearish divergence. This suggests a potential decline in price, although the downward movement may not be significant.
Weak Bullish Divergence:
When the lows of an asset is decreasing while the RSI lows is equal, it indicates a weak bullish divergence. This suggests a potential increase in price, although it may not be a strong upward movement.
Weak Bearish Divergence:
When the highs of an asset are rising while the RSI remains unchanged, it indicates a moderate bearish divergence. This suggests a potential decline in price, although the downward movement may not be significant.
Hidden Bullish Divergence:
Hidden bullish divergence occurs when the price creates higher lows while the RSI is creating lower lows. This reinforces an existing uptrend and suggests its strength.
Hidden Bearish Divergence:
Hidden bearish divergence is observed when the price forms lower highs while the RSI forms higher highs. This indicates a potential weakening of the current uptrend and might signal a trend reversal or a pullback.
By recognizing these divergence patterns on trading charts, we can gain insights into potential market reversals, entry and exit points, and adjust trading strategies accordingly.
Incorporating Divergence into Your Trading Strategy
To effectively incorporate divergence into your trading, consider the following steps:
Identify the appropriate indicators: Choose reliable indicators such as RSI, MACD, or Stochastic Oscillator that can detect divergence patterns effectively.
Learn to spot divergence: Familiarize yourself with the different types of divergence patterns and practice identifying them on price charts. This will help you develop a trained eye for spotting potential trading opportunities.
Confirm with additional analysis: While divergence can provide valuable signals, it's essential to use other technical analysis tools to confirm your trading decisions. Look for supporting indicators, chart patterns, or trendline breaks that align with the divergence signal.
Set clear entry and exit criteria: Define your entry and exit points based on the divergence signal and your risk tolerance. Consider using stop-loss orders and take-profit levels to manage your trades effectively.
Practice risk management: Implement proper risk management techniques, such as position sizing, to protect your capital. Divergence alone should not be the sole basis for your trading decisions but rather an additional tool in your arsenal.
Backtest and refine your strategy: Test your divergence-based trading strategy on historical price data to assess its effectiveness. Make adjustments as needed and continuously monitor and evaluate your results to improve your trading approach.
Remember, divergence analysis is not foolproof and should be used in conjunction with other technical analysis methods and market factors. Regular practice, continuous learning, and adapting to changing market conditions are crucial for successful trading.
Divergence analysis is a powerful tool that can provide us with an edge in the cryptocurrency market. By understanding and effectively utilizing divergence patterns, we can identify potential trend reversals, improve entry and exit timing, and enhance overall trading strategy. Incorporate divergence analysis into your trading approach and combine it with other technical indicators and risk management techniques for a well-rounded and informed trading strategy.

ICPUSDT.P Trading IdeaHi!
Here I would expect to see a good downtrend move.
Sweep of the structure point at the top, 3DP + divergency.

NDX - could be due for a bounce soonSo far, the pullback is still a correction within a larger uptrend, with strong support around 14185 - 14385 region.
Potential bullish divergences have been forming between price and RSI on the daily chart which could cummulate to a short term bounce soon.
However, any reversal from a divergence is usually accurate for short term (2-3 candles on the average) and does not predict a larger trend change. For a bigger picture trend, one will have to look at larger time frames (eg weekly and monthly). So far, the larger trend is still bullish for SPX and Nasdaq (for swing or position traders).
That said, it is more important to look the technicals of individual stocks that we are looking to trade as the index is usually only representative of the "heavy weight" stocks.
Disclaimer: Just my 2 cents and not a trade advice. Kindly do your own due diligence and trade according to your own risk tolerance and don't forget that money management is important! Take care and Good Luck!

🔥 OMG Bear Market Bottom: Bullish DivergenceOMG has seen a very bullish week after 3 months of selling. BTC saw a break out and OMG followed. This analysis assumes that OMG has bottomed and will not see new lows in the future. This idea is supported by the fact that OMG lost over 97.5% of it's ATH value and is currently seeing a bullish divergence led reversal.
Target at the all-time highs, around 20. Stop under this week's low. A less risky approach would be to put the SL below the 2023 lows and to take partial profits around 2.50 and 6.

UK100 Bullish DivergenceBullish Divergence formed on UK100 30mins, place your buy stop or wait for LH to break.
Manage your Risk Accordingly!

The Bullish Case for Ethereum, A Comprehensive Review!!If price manage to break the falling Wedge . the price can easily reach the target after a little correction.
🌟 Bullish signals in the PRZ area are:
- Support zone
- Pivot
- Bullish Channel
- falling Wegde
- bollinger band
- 5th Waves
⭐ and the bullish signals of market momentum are:
- Regular divergence in MACD
➡️ Note if the PRZ is broken downwards with the strength of Bearish candles or Wedge broken from the bottom , this analysis of ours will be failed.
✅If this post was useful for you, like it ❤️ and if you think it is useful for your friends, be sure to send it to them.
_ _ _ _ _ _ _ _ _ _ _ _ _ _ _ _ _ _ _ _ _ _ _ _ _ _ _ _ _ _ _ _ _
🌍Thank you for seeing idea .
Have a nice day and Good luck.

Why did I know that bond yields were going to fall?To obtain this information, we need to look at four things:
-Fed Rates: The Federal Reserve's interest rates decisions can have a significant impact on financial markets and the overall economy.
-US5Y (US 5-year Treasury bonds): Yields on US 5-year Treasury bonds are an important measure to assess market expectations for short-term interest rates and investor sentiment regarding the economy.
-US10Y (US 10-year Treasury bonds): Yields on US 10-year Treasury bonds are also a key benchmark to evaluate investor expectations for medium-term interest rates and market risk perception.
-US30Y (US 30-year Treasury bonds): Yields on US 30-year Treasury bonds provide insight into investors' long-term expectations for interest rates and confidence in long-term economic stability.
Monitoring these indicators can provide valuable information about the direction of interest rates, market sentiment, and the overall health of the economy.
If we observe these three together, we can see that the maximum point marked with a red rectangle, the US5Y, is the only one that violated that high. This suggests that the movement in the US5Y was a manipulation (liquidity pool), as none of the other bonds violated the high. Also, the DXY (US Dollar Index) did not violate it and has already created a lower low. This indicates that we can expect the completion of this move in the DXY and a more aggressive decline in bonds.

THIS COULD GO DOWN!!!Divergence was found with a double top so the chances are it would break the bullish trend and go down.

EURUSDEURUSD recently was in strong bullish momentum. But currently it seems like a bullish momentum is fading. A deep correction is also due after such strong impulsive move.

C3.AI: AI = SHORT - wyckoff distribution & bearish divergence1st - Bearish Divergence: RSI & MFI on 1D & 1W chart
2nd - Wyckoff Method: Distribution TR phase C (UTAD TEST) more pronounced in the 4&1H charts.
Analysis:
There seems to be weakness in the stock, and despite the recent highs and uptick in volume the exhaustion can be seen per the TA presented. BUT REMEMBER, the AI craze is still on going and this could be invalidated in minutes if the whales choose to push the price higher.
Targets if you trust the analysis:
Its pretty simple, I use fib retracement levels 21% and 38.2% as targets.
remember to use risk management and positioning!
*THIS IS NOT AN INVESTMENT ADVICE, JUST SHARING MY ANALYSIS AND INTERNAL THOUGHTS TO MYSELF*

AMD Bearish Short TermTwo weeks ago, I published a bearish trading idea on NASDAQ:AMD saying that I would go short if it broke $115.80. Apparently it didn't break, so didn't take any trades. Here is the link to that post:
This week, we have an interesting scenario. Its a double top on daily chart and an outside bar. Additionally there is a divergence on stochastics. On weekly chart its a failed 2U. Its seems overextended and stochastics is overbought.
Idea is to go short at low of Friday's candle ($119.90). This will trigger a 3-2D on daily and a 2U-2D on weekly. Target could be at least $115.

Is TSLA overbought and ready for a retracement?TSLA has run up over 100% this year in two separate waves. Some traders based on the
the magnitude of the current wave say it is overbought? But is it or are they just trying to
rationalize a short trade at what they think is the top? Are Jim Cramer and Kathie Wood wrong?
On the daily chart of TSLA, I have added a long term volume profile, an anchored VWAP
with lines for the mean and = /1 two standard deviations. I have drawn two zones of
horizontal resistance based on pivots in the past couple of years. Zero-lag MACD and RSI
indicators are added as well. I make the following points:
(1) Price is above the high volume area of the profile but not significantly so.
(2) Price is below the resistance zones and TSLA may have enough momentum to break through them without hesitation.
(3) Price has crossed over the mean anchored VWAP but has a long way to go before it ascends
to the second standard deviation where institutional traders may be prone to take short
positions ( overbought)
(4) The MACD indicator shows K/D lines in parallel and ascending above the histogram. With no lag to contend with a cross of the lines would be an early indication of an overbought condition.
Bearish divergence would suggest TSLA is overbought but there is none.
(5) The better RSI indicator shows the value rising from 40 to 70 in the current uptrend. A rise over 80 and then a drop to show bearish divergence would be an indication of an overbought condition. This has not occurred.
Based on all of this, I can easily conclude that TSLA is not overbought. Any traders who
say it is overbought may be simply trying to discourage further buying. I suppose that they might do so because they are in a short position that is now essentially self-liquidating.
If that is the case, their better approach might be to get rid of their position, buy to cover
and help TSLA move higher.
I will continue to try to add to my long position in TSLA when I see daily lows on
the 15 or less-minute time frame. From the overhead resistance, I can appreciate
there is still significant profit potential with TSLA especially since the resistance may
evaporate away letting TSLA bull run its way " blue sky".

Is this a new type of divergence? (widths of top looking structures seen in chart, but are they? could they be hiding their true identity and transgendering into bottoms right before your very eyes?
Using an MRI Scan on the RSI, we can see it actually might be a WEAKER TOP, why does it look so small in the RSI?
I think this might be a new type of divergence I discovered.
The red marker indicates what looks like a "top" in the chart, but actually looks possibly more like a bottom-looking-structure, in the RSI. You can back test this yourself, look for dumps in the past, and compare, I can bet the Bottoms in the RSI will appear to be getting more narrow, and the tops becoming much wider and more pronounced before a dump. Just IMO & as always, HAPPY TRADING! :)

EURCHF can ascend further! 🧐🧐!!!!!The EURCHF is in a Bullish phase by reaching a PRZ zone.
🌟 Bullish signals are:
- Support area
- Breaking suffering upwards
-Pivot R1 weekly and monthly
➡️ and the bullish signals of market momentum are:
- Daily Normal Divergence in MACD
- Daily strong candle
- RSI daily trend line break
⭐ Note if the PRZ is broken downwards with the strength of Bearish candles from bottom Of the PRZ zone , this analysis of ours will be failed.
USDJPY What will happen in the near future?
✅If this post was useful for you, like it ❤️ and if you think it is useful for your friends, be sure to send it to them.
_ _ _ _ _ _ _ _ _ _ _ _ _ _ _ _ _ _ _ _ _ _ _ _ _ _ _ _ _ _ _ _ _
🌍Thank you for seeing idea .
Have a nice day and Good luck.
