📈BTC analysis near US Retail Sales📉BINANCE:BTCUSDT
COINBASE:BTCUSD
Hey everyone, first take a look at my previous BTCUSDT & ETHUSDT analysis and positions.
Bitcoin may experience growth to 28K near this month's Retail Sales release.
The trend is still bearish and the price takes another step for further correction with each rise.
Next station for BTC is near 200EMA (25200-25400).
Don't forget to risk-free your position.
Please share ideas and leave a comment
let me know what's your idea.
CrazyS✌
Divergence

US100 - Can we catch some pips to the downside?Hi traders,
Sell on US100... Why?
1. Divergence on the 4 hour.
2. Strong fake out rejection on the 4 hour.
3. Big fakeout rejection to the upside on the 4 hour.
4. Broke the last low on the 1 hour.
US100 could possibly do a small stop hunt to the upside before dropping further down.
Let's anticipate!
What do you think of this analyses?
Let me know!
Have a nice trading day all!

SnP500From last few days SnP500 is been on enormous bullish run. Every time after providing pivot to inclining trendline it just flew away. After looking to past data will the instrument provide 3rd pivot to inclining trendline?

TRX Break Out Failed, Possibly Heading Under 3 cents in 2024One of the most important things in trading is forego your own wants and want what the market wants. When Glenn Neely and I first came up with the x-wave idea for BTC, I did not want to believe it was true and I continued to WANT my diametric pattern to be the end of the bear market, as it had been for the last few months. As time has gone on it gets harder to deny that what we have formed over the last few months is an x-wave, on both BTC and TRX and the vast majority of crypto assets, and that we are only a little past half way finished with this bear market that began in 2021.
The market is probably going to go to max pain from here. That means another 1-2 years of bear market and the global crypto market cap being slashed in half over that time.
This is based almost entirely on the wave forecast, which indicates the bull market over the last few months is an x-wave. The reason why this is now being considered as an x-wave instead of the beginning of a new bull run is because we did not see the required confirmatory price action following the bottom in January. We should have seen moves much bigger and faster than wave-b, what we had, especially on TRX, was a move which is far smaller and far slower than wave-b. This is not what the beginning of a new bull market looks like.
In particular on TRX it looks like it has formed a contracting triangle after wave-g, which is very weak and not at all how a bull market should begin, but it does form into a very nice looking x-wave. This is likely to be followed by another diametric which could take just as long as the previous one, and will probably be slightly shorter, taking TRX to under 3 cents. After this happens probably sometime in 2024 we will begin to see a move bringing TRX above 1 USD and probably much higher than that. Momentum is also bearish on multiple timeframes including the weekly and the monthly. Neely River Theory has also not given any buy signals on TRX yet and remains in bearish territory.
On top of that, the regulatory issues in the US, and the lack of new money coming from other parts of the world like China is a major headwind for the whole market. A Wells Notice received by Coinbase at the same time the SEC sued Justin Sun implies that Coinbase will soon be charged with operating an unlicensed securities exchange, and may have to pause and seriously wind down operations until the court case is finished. The exact timing of when this lawsuit will be filed is not clear, but one thing is almost certain is they will be sued eventually after receiving a well's notice, and the comments made by Brian Armstrong indicate they are coming after their core spot business model. This is being considered as a possible regulatory trigger for this protracted bear market, however there are many other possible events which could cause negative headwinds especially from a regulatory standpoint, like Ripple losing their lawsuit or seeing it drag on for another year or two, and further ugly developments in Justin Sun's suit or other developers being sued. The reason this is significant is because it will seriously hinder new money coming in from the US, and short of mainland China opening retail crypto exchanges it's hard to imagine anyway that new money is going to be coming into the market at the same pace as 2017 or 2013. The lawsuits against Ripple and Justin Sun are also very significant because they hinder big developer's ability to effectively market their cryptos to US-based persons, or even through social media platforms like Twitter which may have US citizens browsing on there, opening developers up to liability if they advertise on these platforms or within the US, again severely reducing the flow of new money into the market, which is required for any real bull market to emerge.
Whatever the eventual trigger is for this bear market, most important to this analysis is the Wave theory which indicates, based on the rule of reverse logic, that we are only near the middle of this bear market and this could drag on until next year. As much as I didn't want to believe this at first and I wanted to assume even if we do get a wave down it will be quick, that is most likely not what the market wants. Based on the best wave analysis possible, all signs point to this going to max pain, which is a very deep, protracted bear market that could drag on well into next year.
The attitudes of many traders I have seen, especially to bearish ideas, are an echo of the peak in November 2021 which I called almost perfectly. The regulatory headwinds are also an echo of the SEC's DeFi crackdown which began in late 2021. And the wave theory and technical indicators here are clear and convincing, just like in 2021. Over leveraged crypto firms like Microstrategy and some BTC miners that are at risk of collapse during a protracted bear market are an echo of Luna, 3AC, and FTX. There may still be some small upside left in wave-x, but short of a massive breakout which would need to go almost completely vertical and send us flying past the velocity of wave-b (which is very unlikely), then we are probably going to form a top here very soon and begin a major decent towards max pain, finally squeezing out these over leveraged crypto firms and creating a temporary fire sale of cryptos.

🔥 ONE Bullish Divergence: Local Bottom Set?Like most other tokens, ONE has been selling off for a couple of weeks now. With BTC appearing neutral, it's time to look at these weaker tokens for potential upside.
I'm waiting for ONE to break through the 0.01465 local resistance. Once above, we can make an entry from that resistance, targeting the most recent local top of 0.025, with a stop below the most recent lows.
This trade that we just constructed has a very respectable risk-reward of 12+, which is very good considering we take a wider stop. You could take partial profits around 0.017 and 0.02 if you prefer a more defensive setup.

GOLD-USD|POSSIBLE REVERSAL| SHORT SETUP|ONE HOURGOLD-USD is moving in BULLISH direction from last few hours. However, in this technical analysis, several indications are presented which suggests the possible reversal of this precious metal instrument.
Firstly, there is a presence of BEARISH divergence, instead the price is steadily RISING, the Relative Strength Index (RSI) has been showing a downward movement which indicates that the bullish momentum of GOLD-USD may be losing its momentum. Thus, this divergence between the price and the RSI suggests that the price may be overbought and due for a correction.
Secondly, there is a presence of DOUBLE TOP reversal pattern which also supports the idea of the reversal for GOLD-USD. This DOUBLE TOP Pattern was observed at one hour time frame analysis.
Based on above, it appears that the GOLD-USD pair may take the BEARISH movement from the ENTRY PRICE mentioned in the chart. Thus, it can be an opportunity for a SHORT TRADE if it breaks the ENTRY PRICE level.
The Risk to Reward Ratio is suggested 2% of the total portfolio.
Best of Luck..

🔥 APE Crazy Bullish Divergence: Best Trade Of The Summer!APE has been roughly selling off since the start of the year. This trade anticipates that the selling is over and that the bottom is in for the time being. The idea is that the massive bullish divergence on the price vs RSI will cause a huge uptick in bullish pressure, further reassured by a bullish long-term BTC and stock market.
When we place the stop below the current daily low of 2.99 and a target of 6.40 (the year to date high), we can create a trade with an insane risk-reward of almost 26. This can potentially be one of the best trades of the summer.
Based on your preference you can take partial profits around 3.50 and 4.60

LTCUSDT LTCUSDT seems to be in bullish trend but currently facing long term and medium term resistance in $93 region.
Will the instrument give respect to technical confluences and face rejection ?

AAPL Set To DropAAPL is set to drop based on multiple indicators on this hourly chart. Some key indicators to look at are: Divergence+ Sell signal. These signals are strong and have a high accuracy, so accurate the creator charges a subscription and as a retired options swing trader who does not currently use the indicator for personal use has made enough money off the script to pay for it the rest of my life. As a small trader ( <50k annual income and no starting investment funds ) has made tens of thousands of dollars with this script. I swear by their accuracy! The red cloud above the most recent candles is also bearish divergence, the outlined red is where the RSI is above 70 and the MACD also shows growing bearish divergence with plenty of room for the price to drop.

📊 3 Types Of DivergenceRSI (Relative Strength Index) is a commonly used technical indicator in trading that helps identify overbought and oversold conditions in the market. It measures the strength and speed of price movements and provides traders with valuable insights into potential trend reversals. When analyzing RSI, three types of divergences can be observed: regular, hidden, and exaggerated divergences.
📍Regular Divergence: Regular divergence occurs when the price and the RSI indicator move in opposite directions. There are two types of regular divergences: bullish and bearish.
📍Hidden Divergence: Hidden divergence refers to a situation where the price and the RSI move in the same direction, but the RSI signals a potential trend continuation rather than a reversal.
📍Exaggerated Divergence: Exaggerated divergence is a type of divergence where the RSI signal extends beyond the typical overbought or oversold levels. It suggests that the price is showing extreme momentum and could potentially experience a significant reversal.
In summary, regular, hidden, and exaggerated divergences in RSI analysis provide traders with valuable insights into potential trend reversals and continuations. By understanding these divergences, traders can make more informed decisions regarding their trading strategies and positions in the market.
👤 @AlgoBuddy
📅 Daily Ideas about market update, psychology & indicators
❤️ If you appreciate our work, please like, comment and follow ❤️

CHFJPY | This could go down!!!We can see a divergence as it matures. We can expect a correction in the trend and take short positions.


🔥 FET Bullish Divergence: Huge Upside PotentialFET was one of the major winners of the first few months of 2023, but has been severely lacking over the last months. However, after FET reached daily oversold levels on the RSI recently, it caught my attention.
At the moment I'm seeing a strong bullish divergence on the chart, which could be an indication of a reversal. I'm waiting for the price to close above the 0.266 levels, since it seems like a strong resistance. Once we're above there, we can look for long opportunities.
Risk-averse traders might want to take partial profits at 0.285 and 0.345, or even move the stop to break even at the very least.

ARBUSDTARBUSDT was trading in long term bearish trend and now finally breakout from falling trendline. Will it continue its bullish trajectory from this point?

Bullish divergence on the 1HGood divergence on CNC
With the falling market , metals will pump so I am hoping this is a good time

US30USD Showing Bears Running Out of MomentumMoving average oscillators showing a nice triangulated battle zone ahead for the Dow30
A major bull divergence support trend line is holding and nearing a push through the 0 value MA. Yet some minor bear divergence formed on the recent bull push that was rejected.
I'm neutral here. Will patiently wait for some confirmation
Set alerts on trend lines and let Tradingview work for you.

GBPUSDGBPUSD is trading in bearish parallel channel, and currently created a strong support near channel bottom with strong bullish divergence.
Will GBPUSD show some bullish momentum from this point?

Big divergence between $SPX & $CPERThis probably is not a good sign for the SP:SPX , as these assets are highly correlated (0.88) and normally AMEX:CPER leads the business cycle.
Also, the TVC:VIX is back above 20 and NASDAQ:TLT hasn't resume its downtrend.
Even the dollar AMEX:UUP is showing strength again.
I'm 87% in cash and also have tighten all my stops.
Let's wait and see if the SP:SPX holds or breaks down.

YGG bullish divergence You got divergence on the 4 H
You got the major support on a double bottom
With gaming increase in interest and once the SRSI reset we have to pump

2070 SPIMACO - Bullish Wedge BreakoutWedge Breakout + Double Bottom + Bullish Divergence
Target:
TP1: red area at 30
TP2: 200ma

#DXY #Dollar vs. Bitcoin Dollar gave a negative signal for our Crypto market with breaking the down trend out
Be careful .
this is weekly frame
observe the divergences

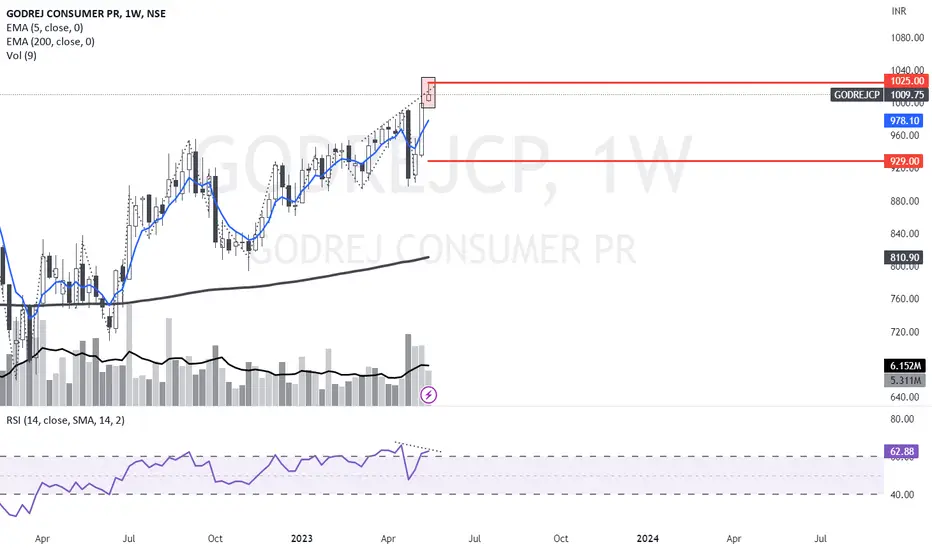
GODREJCP Weekly Bearish Divergence.Bearish RSI Divergence is evident on the chart. It would be a clearer indication if the RSI turns down making a lower high and price trades below the weekly low of 1001. If price trades below 1000 and if closes on the daily below that level, we could expect a target of 930.
CADJPY - Bearish ReversalCADJPY is in Bullish Trend for a long time.
After analyzing, it seems to go bearish after making the last HH. A divergence on RSI shows a reversal. If it breaks the previous HL, it will go bearish. Sell Stop at neckline.
