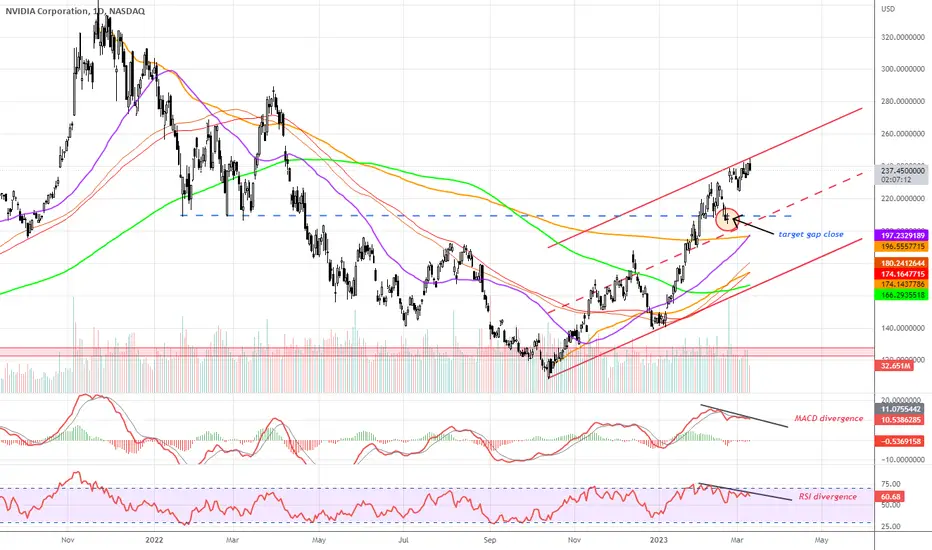
#NVDA looking toppish with some serious bearish divergenceNvidia starting to look toppish here with bearish divergence forming on both the MACD and RSI off the top off the parallel channel. Trying my luck here for a move to close the gap between $207 to $211.
Divergence
BTC TREND IS BEARISH IN 1 HR TFBINANCE:BTCUSDT IN 1 HR TF BTC shows bearish trend but Bullish Divergence shows in RSI.

Bearish Divergence on Weekly TimeframeThere is a very serious negative divergence already present in the weekly timeframe. If it works, a possible catastrophic decline seems inevitable. If we fall to the target levels, I do not think that the support levels at the technical target can hold the price.

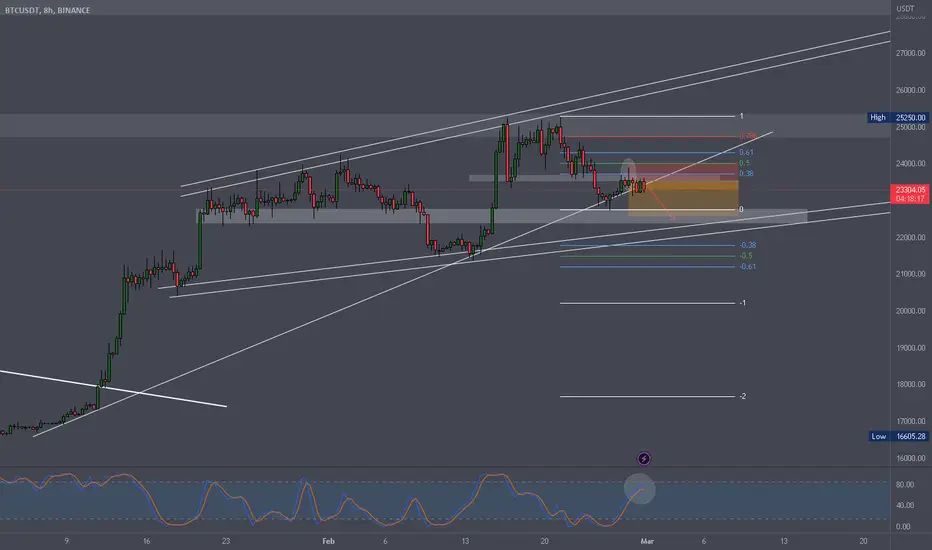
BTCUSDT - Wanna go hit the fence?We've seen an amazing push in BTC and in crypto in general but, I don't know, I can't believe that the bottom is in yet, looking at the actual situation.
It doesn't seem like the market is in risk-on mode quiet yet, so anyhow, I'm going for a small short on BTC, back to previous level @ 22500. Sorry I didn't show it before, I'm in since the wick we've had a couple of days ago on H8 as you can see with my position
But here is the situation with BTC, after a big push we're starting to see what looks like a double top, with a divergence on oscillators on higher timeframes. The price recently broke under 23500, which appears to be a strong level. It poked the 22750ish level, before to go and retest the 23500 area. I was then watching for price action to go short, aknowledging that we were at a trendline, and that price actually reacted to the 3rd touch of the trendline but, not much follow trough and, looking a the macro, I'm bearish BTC for now.
It's tight, I'm definitely babysitting this one untill it leaves my level, but, price action gave me enought reasons to enter this short term trade, so, I did.
Cheers everyone and as always, trade safe!!!
"Swing Trading COIN: Bearish Divergence and Golden Pocket Setup"Confirm bearish divergence on RSI: Wait for a clear bearish divergence on the daily RSI chart for COIN .
Watch for a break below the 50 EMA: Keep an eye on the price action and volume to confirm a break below the 50 EMA. Volume increasing as it breaks 53.66 could signal a stronger bearish move.
Enter short position: Once the break below the 50 EMA is confirmed, consider entering a short position at a price level slightly below the 50 EMA. Set a stop-loss order at 58.10 to minimize losses if the price moves against the trade.
Set take-profit level: Set a take-profit level at 44.62, but consider taking into account the whole golden pocket between 52.78 and 43.78. The golden pocket is a Fibonacci retracement level and could act as a significant support level.
Monitor the trade: Monitor the trade closely and consider moving the stop-loss order to a trailing 5% once the trade is 15%+ in profit. This can help protect profits in case of sell exhaustion. Also, consider oversold levels as the price approaches the profit target.
Note: This trade setup strategy is based solely on technical analysis and does not take into account any fundamental factors that may affect the price of COIN. It is important to conduct further research and analysis before making any trading decisions, and to only risk an amount you are comfortable with losing.

How to Trade With Relative Strength Index (RSI) Indicator
Hey traders,
Relative strength index is a classic technical indicator.
It is frequently applied to spot a market reversal.
RSI divergence is considered to be a quite reliable signal of a coming trend violation and change.
Though newbie traders think that the application of the divergence is quite complicated, in practice, you can easily identify it with the following tips:
💠First of all, let's start with the settings.
For the input, we will take 7/close.
For the levels, we will take 80/20.
Then about the preconditions:
1️⃣ Firstly, the market must trade in a trend ( bullish or bearish )
with a sequence of lower lows / lower highs ( bearish trend ) or higher highs / higher lows ( bullish trend ).
2️⃣ Secondly, RSI must reach the overbought/oversold condition (80/20 levels) with one of the higher highs/higher lows.
3️⃣ Thirdly, with a consequent market higher high / lower low, RSI must show the lower high / higher low instead.
➡️ Once all these conditions are met, you spotted RSI Divergence.
A strong counter-trend movement will be expected.
Also, I should say something about a time frame selection.
Personally, I prefer to apply it on a daily time frame, however, I know that scalpers apply divergence on intraday time frames as well.
❗️Remember, that it is preferable to trade the divergence in a combination with some price action pattern or some other reversal signal.
Let me know, traders, what do you want to learn in the next educational post?

Descending Triangle + Bullish Divergence = ConfluenceHi All,
On the 4hr chart we see a CMF bullish divergence which could be an indication that Aragon is preparing to break out from it's descending triangle and head back up to retest the previous highs.
There's a good Risk Reward ratio even with a conservative stop loss, I'd usually have this tighter but we're seeing big volatility at the moment.
Feel free to leave feedback on the idea
Blockbullder.

Bitcoin The Bearish JustificationSomething about patience that I dont have? It's possible I am reading the weekly discrepancy for the stochastic RSI wrong ? Even a move towards 25.3k again doesn't change much on a larger time frame. Divergence ? Patience?

GBPUSDIn this area, a corner pattern has formed with a valid divergence, which has the potential for price decline.
We are waiting to break this pattern.

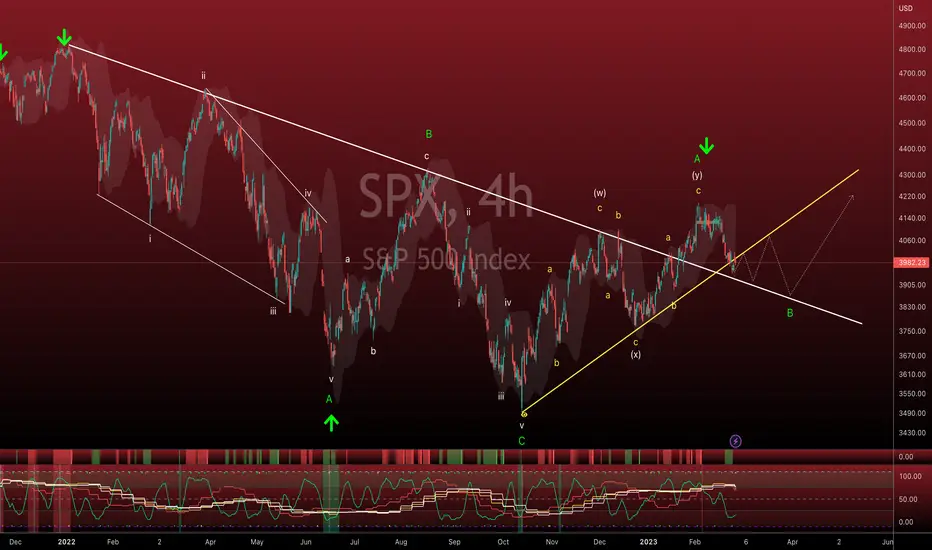
SPX - Just more sidewaysA couple days ago I suggested that SPX was going to just expand below the uptrend line and above the downtrend line. My expectations are continuing to flow accordingly.
The only thing that has me skeptical at this point is how oversold the 4h green wave is. But tae a look at the red, white and yellow wave. They're all curling down. The next rebound in that green wave is going to decide the next few weeks, in my opinion.
Still not focusing on EWT but more on the chart formation, the momentum indicator is oversold and the green wave on the wave master is oversold. If we continue moving sideways and even if we start expanding even a little bit like I have forecasted, it'll allow the green wave to reset a bit and get up into overbought and then we could see a bigger move down instead of up.
Yes, I know my main projection has this moving up, but if that green wave resets and the red/white/yellow waves are still overbought like they are now, we will almost certainly see an expansion type move to the downside.
Not going to get into options premiums and decay but more than likely anybody holding further dated options are going to watch their money slowly disappear as the price action continues to chop for the next few weeks.
Trade carefully and equity is king right now (both long and short style). You may be interested in bear ETFs for things like AAPL and TSLA. Careful with TSLA, though. She's a wildcard but I do believe if the market is going to expand down that AAPL has the best R/R.
Reversal on NZDUSD?The NZDUSD found the 0.6190 price area on Friday and as the price rebounded from the support level, this formed a Bullish Divergence (the price formed a lower low, while the MACD formed a higher low).
Looking at the 0.64 price area as a possible target level for the reversal.
With the RBNZ interest rate decision due in the week ahead, this could provide an additional driver to the reversal.

FILUSDT - SHORTFilecoin is one of the winners of this month. It had an impressive rally as soon as it broke MA233. In fact, not only was MA233 left behind but all moving averages. An impressive lesson offered by this pair: FILUSDT.
Currently, on this time-frame, we are approaching distribution.
Confluence, overbought + bearish divergence.
It's time for take profit and short.

dis blow off top? | daily bear div presentdisney with a potential blow off top here. last 3 times we've tapped overbought, it's led to significant sell offs.
been in over bought territory since the 23rd. now have a second daily bear div present. expecting a pull back to daily rsi eq. $100 seems reasonable, but long trigger should be the rsi eq tap.

ES1!: RALLIES & FALLS / UPDATE / POINT OF CONTROL: 4000 & 3950DESCRIPTION: In the chart above I have provided a MACRO analysis of ES1! a future INDEX on the daily timeframe.
POINTS:
1. Deviation of 250 points would justify placement of SUPPLY & DEMAND POCKETS.
2. Pennant Formation
3. Current CORRECTION FALL is roughly 5.55% falling short by nearly 5% when compared to other CORRECTION PHASES.
RSI: Since the inception of the current bear market price action has only held one time when RSI is at a PIVOT POINT and ready to enter OVERSOLD TERRITORY.
MACD: If MACD is pulled into OVERSOLD territory or anywhere past it's MEDIAN OF 0.00. This will be a strong indicator that price action will fail to hold onto its current channel of 4050 - 3800. And would essentially mean price action will retest past channel of 3800 - 3550.
POINT OF CONTROL: Price action must remain above LEVEL 1 SUPPORT of 4000 & LEVEL 2 SUPPORT of 3950.
SCENARIO #1: In a BULLISH scenario we would come to see price action bounce at 3950 then followed by a move toward 4150 before breaking pennant formation. (Not the safest bet since this scenario would VIOLATE RSI'S TREND FROM THE PAST YEAR)
SCENARIO #2: In a BEARISH scenario we come to see a break below 3950 that would leave to PRICE ACTION not seeing support until 3800. (This would fall in line with what current indicators are signaling)
FULL CHART LINK: www.tradingview.com
CME_MINI:ES1!

USDCHFThis situation has been examined in different dimensions:
1- Strong supply and demand levels that I identify with my own indicator and system.
2- The structure of recently formed waves
3- Current market momentum
4- The structure of classical and price patterns
In this idea, I identified the direction of the market in different ways and in the second step, I analyzed the potential of continuation or reversal. Usually, paying attention to the trend and strength of the trend can greatly increase the accuracy of the analysis.
In general, I tried to describe the continuation of the movement in the simplest possible way in the diagram.
⚠️ Disclaimer:
This is a personal opinion and you are responsible for any trading decisions.
if you liked this idea or if you have your own opinion about it, write in the comments. I will be glad ❤️️

Does divergence work?Candlesticks indicate the lack of sufficient strength for growth, therefore, according to the strength of the fall and the lower support area, and of course, the divergence, the probability of returning from that area is more likely.
If the line is broken, we can imagine the upward growth trend up to the specified limits
⚠️ This Analysis will be updated ...
👤 Banipal : @hosseinbakrani
📅 02.14.2023
⚠️(DYOR)
❤️ If you apperciate my work , Please like and comment , It Keeps me motivated to do better ❤️

META - falling wedge pattern (bullish)After a strong 28% gap post earnings on 2nd Feb, META has now given up about half its post-gap gain. However, its longer term bullish picture remains intact if we look at the following factors:
1. Stock is still trading above both its 20 and 200 day moving average (the latter of which is beginning to flatten out, a precursor to turning up)
2. A falling wedge pattern is forming (potentially bullish)
3. Bullish divergence forming between price and RSI (*see Note below)
A break out of this wedge could be an opportunity to long again if one has taken profit earlier or has gotten stopped out as stock went into this steep retracement. I would put initial stop loss slightly below the most recent pivot low (which will be the candle just prior to the wedge breakout).
However bear in the mind the stock's momentum could be slower for now until the next catalyst appear.
*Note that while a bullish divergence could materialize into a short term bounce lasting about 2 to 3 candles, it does not translate into a longer term trend change on it's own.
Disclaimer: Just my 2 cents and not a trade advice. Kindly do your own due diligence and trade according to your own risk tolerance and don't forget that money management is important! Take care and Good Luck!

USDCAD SELLI expect USDCAD to drop in the following days, because it is at the resistance zone of the M15 and M30 price channels respectively. Secondly, it overextended price in order to fulfill EW impulsive move evident through the divergence on TDI and Awesome oscillator. As such, the correction of that count is expected. My short term target is resistance zone that was broken during the upside move around 1.34778. If broken, I will expect price to drop further.


Bearish Divergence on Daily BTC Chart and SMA200/W ResistanceIf we look at the current situation, we are faced with an unexpected rise in the BTC table, considering both the USA inflation data, the global markets and the US Dollar Index.
We've come to the resistance zone of an already rising channel, as if that wasn't enough, there is a weekly period death cross presence. In addition, there was a serious negative mismatch between the price and the relative strength index in the daily timeframe.
Considering these data, it would not be surprising if the price tries the channel subband $18.5K from this point.


Read CaptionIt is an important level that we have to wait for the reaction
In case of failure, the analysis level will be updated
⚠️ This Analysis will be updated ...
👤 Banipal : @hosseinbakrani
📅 02.13.2023
⚠️(DYOR)
❤️ If you apperciate my work , Please like and comment , It Keeps me motivated to do better ❤️

BITCOIN showing some Bullish Divergence on the 3 HRBTC holding above $21500 (On the Edge! Just had a wik down to $21455!), looks to be some Bullish Divergence...
It shows Divergence all the way up to about the 12 HR (Tiny one) and the daily (Micro one) LOL!
Looking for a move tomorrow with the Inflation numbers.
Can we get some Valentines Day love to the upside? We'll see... <---
Lots of Negative talk all over News & social so it may start making a move in the opposite direction.
This is what happens when there is too much Hype for one direction IMO.
Good Luck Out There!
