Divergence Building Up 1HRThe hour is not over yet, but this is an early warning sign, keep an eye on divergence on 1hr/4hr timeframes. Divergences tend to lead to reversal more often if they are on higher TFs and near support or resistance zones. If the divergence works out, look out.
Don't forget your risk management!
If you like this idea then do support it with like and follow.
Also, share your views in the comment section.
Thank You!
Divergence

Going short on West Texas Crude OilThe commodity just broke its major support trend line, additionally the formation of lower high and divergence support an upcoming bearish rally.

$PEG ShortRejection of downsloping supply line
fakeout of former support with bearish engulfing candle
confirmed daily bearish divergence

BTC Bearish divergence and VWAP rejectionThis morning I drew this rising wedge and clear and long-lasting bearish divergence on my waves trend oscillator. I used a 30m time frame for better resolution, which also applies to the 4h chart. It was clear we had to break out today or tomorrow, so it happened while I was asleep. I would be so angry because I missed this dip if it wasn't for perfect VWAP rejection on the price bounce back. We can see here that price is struggling to go over bigger history volume action, shown on VRVP. And the hole on VRVP that I explained in my previous idea - remains. Smaller time frames will push the price as much as possible, but I believe we are looking at lower tops and bottoms from now on. 1D was overbought at a 100 level two days ago. 100!!!

Going Short on GBPAUDPound continues to lose its ground against Aussie as the bearish rally in the pair continues. Sellers should aim for buying on dips strategy as strong rejection from previous higher low, and a bearish divergence shows bears are still in control.

Dollar IndexOf course we know that hidden divergences are indications of trend continuation. So if we are at the right side of the probability, it is likely for DXY to continue the downtrend.
If so, then we are expecting to pass the level indicated in the picture. That being considered, we'll get a Breakout signal.
CAUTION: THIS IS THE TECHNICAL SIDE OF THE MATTER. ANY PROBABILITY SHALL BE BALANCED ACCORDING TO FUNDAMENTAL PARAMETERS.

ADAUSD - Upward move coming - 2023!It looks like Cardano it's going to start 2023 well.
On the 4-hour timeframe chart(left), Cardano's price is showing Regular Bullish Divergence. The Divergence is indicated by the Relative Strength Index and the Stochastics.
On the daily timeframe chart(right), Cardano's price is showing an Oversold condition. The Oversold conditions are indicated by the Bollinger Bands, Relative Strength Index, and Stochastics.
Both charts complement each other. The new innovative plans for 2023 are in line with these ideas as well.
Enter your long position only if/when the candle closes above the key level and confirms it as a support.
All further details are shown on the charts.
Good luck!

Bearish Divergence on SolUSDCOINBASE:SOLUSD
Bearish Divergence on 1H timeframe of COINBASE:SOLUSD suggests drop in price.
Further adding parallel channel enforces this idea; upper level prevails around 23.9-24.2, lower level around 22.6-22.4 is probable.

ES Futures Bear Div
RSI Bear Div + RSI-Stoch Bear Div in overbought zones, in line with ATH trendline, wouldn't be surprised to see a bull trap around 4070. Bulls will think ATH trendline is broke but just testing VWAP from ATH middle band.

5 Important Points About BTC.D🦍BTC.D or Bitcoin Dominance is one of the most important factors for investors to find out, if it is better to keep more Bitcoin in their bag or Altcoins. Don't forget, it's not all you need to make your decision but it's the important one!
To make a decision about BTC.D, I've checked multiple parameters on weekly time-frame chart, so we dive deep into them one by one. Let's hit it.
#1: Indicators (RSI and MACD) :
MACD is showing a bullish divergence on the chart, that means the bearish momentum is getting weaker. It doesn't mean we're going up, but it means if any bullish power happens we can easily go up because Bears are weak now.
Let's check RSI on the chart, the RSI is completely moving above a ascending trendline (Yellow line). Until we're above it, then BTC.D is good to go up. It looks like RSI is going to touch it's trendline again, if it does, I'll consider it as an important date to check my altcoins to swap with Bitcoin.
#2: Consolidation channel for 1.5 year :
This is a very strong and important channel for BTC.D because it has trapped BTC.D inside of it for more than 1.5 year, and many traders have used it to accumulate more BTC. How? Swap altcoins for Bitcoin in the bottom of the channel and the opposite in the top of the channel.
Now that we're very close to the bottom of the channel so we have to consider swapping again, from Altcoins to Bitcoin. But be careful, you have to check each of your altcoin's chart one by one before making any decision.
#3: Very strong support area (green area) :
At the bottom of our consolidation channel, you can see a green area that is the strongest support area in BTC.D history. Because almost every time BTC.D had reached this level, it has forced BTC.D to move upwards. The overlap of this support area with the bottom of consolidation channel makes me seriously consider to swap most of my altcoins (with capital/risk management) with Bitcoin. SO TAKE BTC.D AROUND 40% SO SERIOUSLY.
#4: BTC.D All Time Low :
It is possible to have a downward fake breakout to 35.4%, because this is BTC.D ATL (all time low). It has happened before, so I'm still bullish on BTC.D unless this area is strongly broken downward. Other than that I believe we're in the BTC.D floor or at least close to it. It means, I prefer Bitcoin to Altcoin for long run as this is a weekly time-frame.
#5: Comparing Bulls and Bears :
I compared last two waves in the consolidation channel, greens from bottom to top and reds from top to bottom. As you can see on the chart, it took 20 candles (week) for bulls to go from bottom to top and 13 candles for bears to cove top to bottom. It means, in last two waves bears we're definitely stronger than bulls and we didn't see enough momentum in bulls.
Although BTC.D is on the floor but my impression is that, BTC.D doesn't have enough momentum to break the channel upwards with one bullish wave. I think we need at least one strong correction in the middle of the road, before upward breakout. This will be my tough about breakout unless we see a super strong momentum when the bulls start pushing BTC.D.
I wanted to add something else about this breakout, no matter when it happens, the target of BTC.D will be something around our green area (58%). So that date, will be a good time to check the market to swap Bitcoin for Altcoins.
Well, this is my analysis on BTC.D, don't forget this is a weekly timeframe, so it is for long-term investors not short-term traders.
Feel free to add up your ideas about my analysis in comment section, I do like to discuss different ideas with you guys to educate ourselves and take the best out of the market.💖

Gold XAUUSDXAUUSD GOLD, Fibonacci Retracement, Zones, RSI, Divergence, Trendline
Just Sharing Idea of Future view,
All time high 2075.11 Retracement 38.6 and failed to break high level again Retracement of 50.0 1617.68
High Rsi trendline and bottom Rsi in Divergence
Future looks if rejects 1967 Level then back support of 61.8 level or up high to break 2075.11 level Top high Rsi in Divergence mode that Period, Rsi in overbought now
JUST IDEA SHARING THANK YOU

ALT Season about to start Well, USDT.D. has formed a massive divergence; there could be a last shakeout to eliminate the retail investors.
It's a very good opportunity to start buying into some of the altcoins.
I believe file, coin, dot, dash, and sushi are nearing or have already reached their bottoms.
After breaking out of this massive rising wedge, we will see a huge pump.
Today's dump was harsh, and there was a lot of fud about Binance. Binance isn't going anywhere, but I always suggest keeping only 20–30% of your holdings in the exchange so you can trade.
So be careful while buying and do not use bigger levers, as leverage is designed to take your profits through fake wicks. There isn't any better opportunity to buy on the spot than now.
Good luck, and hopefully next year we will see at least 2-3x in all major altcoins.
Also, there is so much fear in the market right now; that's an indication we are much closer to the bottom.

Ltc 15m longMaybe I'll start documenting my trades here for self accountability
Only trying to take divergent trades.
Bought at low, circle. 2nd entry at 3m divergent at low.
Take profit 1 at arrow

BIST 100 BULLISH DIVERGENCEI share my trade plan with respect to a bullish divergence has occurred on MACD indicator.

USDJPYAs a student of SMC trading, I've spotted a text book H&S on USDJPY pair on the Daily timeframe, before that market had already formed a divergence. It might be a change of trend for USDJPY
Do drop your thoughts down below, based on USDJPY

GBPUSDAs a student of SMC, I've just spotted GBPUSD might be having a reversal of trend on the Daily timeframe as it already formed an inverted H&S on a downtrend.There is liquidity before that, market might have just grab the liquidity and may reverse at anytime. There is also a divergence formed between Market Price and RSI.
Drop down what do you think of this idea of longing GBPUSD.

BTC Short is coming
4H/Daily Resistance level reach (17550-17350)
Best Risk Reward Ratio 1:4
MACD Divergence is form

Major SMT EURUSD / GBPUSDI would like to direct your attention to this. Please trade safe and be aware that turbulent times are upon us. Price can do as it pleases and this here (Depending on what DXY shows as its hand) may indicate EU is pushing highs to pair liquidity and GBPUSD short books are full.

AUD/USD SELLING ON STRONG BEARISH DIVERGENCEaccording to D1 chart forming some strong bearish divergence. also near to be sign HH on megaphone pattern.

Divergence + Minor SNR + OrderblockI spot a divergence on 5M outlook, which then price seem to reject as well giving to a possible orderblock entry and as well as a minor SNR level could be into play as well.
Although the SNR level is not so much clean but to stand more chance is the Divergence as the dominant Reason.
Cons are the price is overall bullish and has just returned from mitigating a price structure and might push more to the upside to mitigate the minor extreme orderblock as AUDCAD mostly does.

DIS - Long term support heldA look at the monthly chart revealed that DIS has establised a strong support between 79 - 84 since 2015. This zone has been tested several times (2015, 2016, 2020) and the last time being just recently in the last week of Dec2022.
A bullish divergence is seen on it's monthly chart, increasing the odds of a bounce lasting a couple of (monthly) candles. (bullish divergence usually predicts a short term reversal that may last 2-3 candles and does not necessarily predict a longer term trend change).
It's probably a good opportunity for long term investors to accumulate at current levels or at any near term dips (as long as it does not breach $79). Bear in mind that it could remain volatile as it has yet to clear above its 200 day moving average.
In the unlikely even of the stock breaking below the long term support of 79, then all bullish bets will be off.
Disclaimer: Just my 2 cents and not a trade advice. Kindly do your own due diligence and trade according to your own risk tolerance and don't forget that money management is important! Take care and Good Luck!

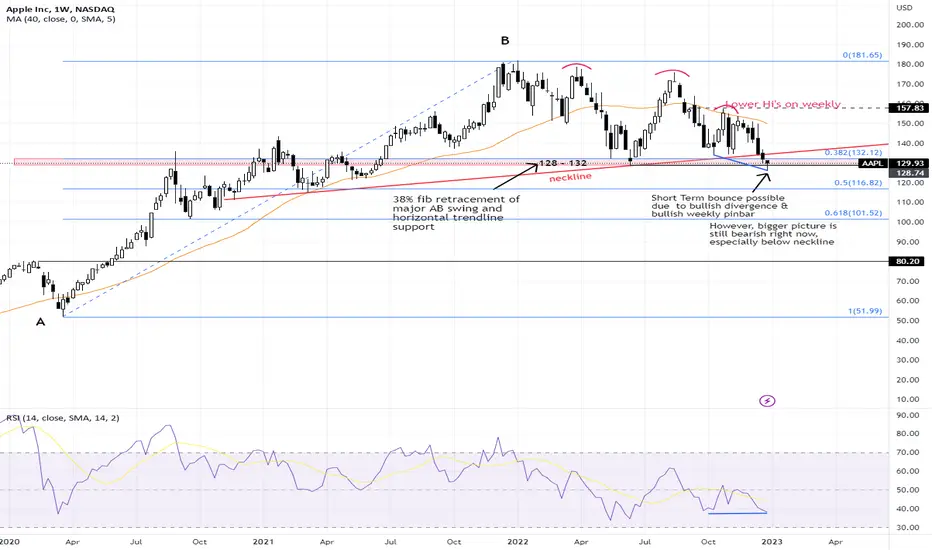
AAPL - Will support @ 128 hold?AAPL had been the most resilient among the FAANG stocks despite being in a volatile and toppish pattern for months. However it started to break below major neckline support @ 134 on 19th Dec and then an attempt to break the horizontal support @ 128.
It managed to close the month with a weekly bullish pin bar above 128 and a potential bullish divergance is also forming between price and RSI on the weekly chart. Hence a near term bounce could happen but any bounce right now is best viewed with a grain of salt until we can see change in the chart structure
Any close below 128 is potential for the bear trend to continue towards 110-115.
Disclaimer: Just my 2 cents and not a trade advice. Kindly do your own due diligence and trade according to your own risk tolerance and don't forget that money management is important! Take care and Good Luck!
Oil ready to run?Looks like $OXY is in the mix of a bullish divergence. So lets dig. Look at the lower low on the price it is sharp. It needs to rest the oscillator. Here is the thing, if we can hold above the 0 line on the MACD and start to open up we can see the ticker really run.
Bull Case we have a divergence forcing the gap up. I am looking that if there is a gap fill to take it back to the top with the ema as support. We will see what the market have. for continuation it need to blow pass $65. One of those are the entry.
Bear case first time above the ema since November with 2 candle open and close. This gap fill will be the beginning of the run back down. We are below the 0 line, there is nothing here to see but read. Break below $62 new lows will follow.
