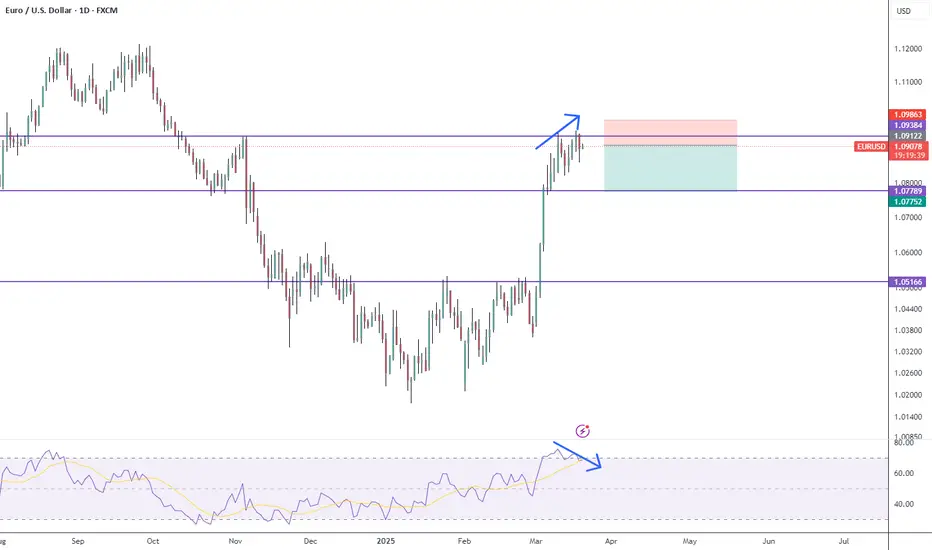
Divergence
Lucid Group Trip Down to Lower $3's Before Uplift?! - LCIDHere I have Lucid Group, Inc - LCID on the Weekly Chart!
First, Technical. We see Price rock bottoms to its Lowest @ $2.29 on April 22 2024 and just after the Negative Earnings and Revenue report on May 6th 2024, Price creates an Equal High @ $3.35 followed by a Violation of Structure giving us a Higher Low @ $2.48 finding Support in the $2.50 Area to then make a Higher High @ $4.32!
Turning this once looking Downtrend to an Uptrend.
Prices Higher Highs and Lows are now being halted at the $4.20 - $4.40 Range where I suspect Price will need to find more Support before it can continue on to what I believe will be its next Target being the Next Swing High @ $5.31!
*Divergence in the Highs of Price relative to the Highs on RSI show Bearish Signs
The Bullish Rally in Price on August 19th left open quite a Gap to Fill from $3.83 - $3.30 and If Price is willing to fill it, the $3.46 - $3.13 Area looks very Valuable being there's:
1) - Equal High @ $3.35 being Potential Support
2) - Golden Fibonacci Zone @ $3.34 (55.9%) - $3.22 (61.8%)
(Based from HL @ $2.48 to HH @ $4.43)
3) - RSI after Breaking EQH, starts Trading Above 50
4) BBTrend Printing Smaller, Dark, Red Bars
All leading to Bullish Markers!
Now, Fundamentals. Lucid Group announced that it is set to launch not only 3 new affordable EV's but that it also plans to unveil the Gravity SUV later in the year "highlighting the company's advanced technology and mileage range on electric vehicles." In competition with Tesla's long reign.
www.tradingview.com
The "Fastest Armored Car On The Planet" is sparking investor interest with Lucid Air Sapphire is giving serious challenges to Tesla!
www.tradingview.com
The past 2 Earnings & Revenue Reports have both been Disappointing for the company but the most recent Report on August 5th compared to May 6th tell a slightly different story ..
May - Revenue Estimate (173.544M) / Reported (172.2M) = -844.404k
Aug.- Revenue Estimate (190.303M) / Reported (200.6M) = +10.279M
*Next Earnings and Revenue - November 5th 2024
LCID will be worth keeping a watch on .. Stay Tuned!!
NQ Bullish with Signs of a Potential Reversal in Early OctoberThe Nasdaq 100 ( CME_MINI:NQ1! ) futures continue to exhibit a strong uptrend, driven by market optimism and supportive economic factors. As seen on the chart, the Bonsai trend indicator remains bullish, signaling the ongoing upward momentum. However, caution is warranted as we approach a critical resistance zone, where multiple technical and external factors suggest the potential for a pullback.
Key Technical Levels and Signals
Resistance at 20,600 : The price is nearing a significant resistance zone between 20,500 and 20,600, where previous highs have been met with seller pressure. The market may struggle to break through this zone in the short term, leading to possible consolidation or retracement.
Bearish Strength on Oscillators : The Bonsai OS is starting to signal an incoming bearish strength, where the oscillator fails to make new highs while the price continues to rise. This divergence suggests that the current bullish move may be losing momentum, increasing the probability of a reversal or correction in the near term.
Short-Term Retracement : A retracement to the 19,800-20,000 region would be healthy for the overall trend, providing potential buying opportunities for traders waiting for a dip. This level aligns with previous support zones and retracement levels, making it a logical area for price to stabilize before another move upward.
Geopolitical and Economic Factors Affecting NQ
U.S. Elections and Tax Policy : The upcoming U.S. election between Vice President Harris and former President Trump is creating uncertainty around future tax policies, particularly regarding capital gains and unrealized gains taxation. Investors may start adjusting their portfolios as we get closer to October, historically a volatile month for the markets.
Global Conflicts and Economic Risks : Rising tensions in Ukraine, the Middle East, and Taiwan add further geopolitical risk. Market participants are keeping a close eye on potential escalations, as these conflicts could shift sentiment toward a risk-off environment, impacting indices like the Nasdaq 100.
Fed Policy and Economic Data : The Federal Reserve's recent rate cut has temporarily buoyed the markets, but upcoming data releases—particularly around inflation and employment—could change the tone. Economic surprises in early October could lead to volatility, especially if the data fails to support the current bullish narrative.
Conclusion: Bullish But Cautious
The overall Bonsai indicator continues to signal an uptrend, and the market looks poised to push higher if it can break through the 20,600 resistance zone. However, the oscillator's bearish divergence and external political risks suggest a potential reversal or at least a short-term correction in the first week of October. Traders should monitor these signals closely and consider adjusting their positions accordingly. Keep an eye on the VIX as well, which has been known to spike during periods of heightened uncertainty, offering opportunities to hedge against increased volatility.
BTCUSDTIs BTCUSDT exhausting at resistance zone?
As the price is been on high bull run but now it seems like price is lacking bullish momentum after printing double top pattern at resistance level and bearish divergence suggesting the sell pressure is about to start.
If the bears took control , the 1st target could be 55000 followed 52000
What you guys think of it?
US30 POTENTIAL SELLTrade Idea: Sell on US30 15M CHART
Analysis:
I anticipate a decline in the US30 index within the next two hours. I plan to place sell stops around the 42,162 level. My priority targets are set for a 25-50 pip move, aiming for exits between 42,137 and 42,111 as we have lots of bullish imbalances within and below these levels. For an extended target, I’m eyeing the 42,060 level, which aligns with expectations of heavy divergence bearish pressure.
Risk Management:
Although I won't use a hard stop loss, I recommend a mental stop loss above 42,220, considering the liquidity above this level. This allows for some market breathing room while still managing risk effectively.
Keep an eye on market developments and adjust as necessary.
Not investment advice. Please protect your capital.
SOYBEANS - Are We Close to a Major Bottom? Cycles Say YES.Here is what I am currently watching for SOYBEANS.
-We need to be aware that there is a major bullish divergence setup (not trigger) developing on the quarterly & monthly charts. We need to pay close attention to this setup, because if triggered/confirmed, it implies a massive move up for Soybeans would be on the horizon.
-Interestingly, the Weekly chart has confirmed bullish divergence. The first target (1090) has not yet been hit, but in my opinion, it looks probable that Soybeans will hit that target (and possibly go as high as the second target (1179). This implies that I believe Soybeans is likely to rally at least 5% in the near future, and possibly rally as much as 10% from current price levels.
-I will be aggressive with taking profits on any short setups that present, due to the bullish weekly divergence that has triggered.
-Utilizing the Weekly MAC & Valuation methods, I note that this market is in an area where we can look for H6/Daily short trades. As mentioned in previous paragraph, I will utilize more aggressive targets.
-The cycles for Soybeans...wow, they are quite something. Decennial cycle suggests significant low being put in, APZ's suggest major low around October 4th, major 5 year cyclical low RIGHT NOW. Other temporary and permanent blended cycles suggest a major low right now. Composite of the 3 most similar years of price action also suggest a major low could happen soon, with a major rally to March 2025.
-A combination of the cycles and the major timeframe bullish divergences have me leaning somewhat towards calling a possible major bottom in the Soybeans market. I would prefer to see commercials COT positioning support this idea, which makes me think maybe we get another nice selloff into the August lows before the real bottom is in. But time will tell.
US30 POTENTIAL SELL Trade Idea: US30 Sell Position
Time Frame: 1 Hour Chart
Market: US30 (Dow Jones Industrial Average)
Trade Type: Sell
Bearish price action observed during the London session indicates potential for further downside movement. The price is anticipated to tap into the level at 42,079, presenting an optimal entry point for a sell.
Entry Point:
- Sell Limit: 42,079
Target Levels:
- Primary Target: 25-60 pips (around 42,055 - 42,031)
- Extended Target: 75-100 pips (around 42,003 - 41,977)
Stop Loss:
- Placement: Approximately 60 pips above entry (around 42,139). This will be a flexible stop loss, allowing for market fluctuations.
Risk Management:
- Ensure that position size aligns with your overall risk tolerance. Monitor the trade closely, especially near key support and resistance levels.
Additional Notes:
- Keep an eye on market news and economic releases that may impact volatility.
- Adjust targets and stop loss as necessary based on real-time price action.
Disclaimer: This is a trading idea and should not be considered financial advice. Always conduct your own analysis and trade responsibly.
META - Still Bullish, But Major Sell Signal LoomingHere is what I am watching on META.
-Like many of the other high flying stocks in the US, the Quarterly, Monthly & Weekly charts are flashing divergence sell setups. Bulls need not be too worried yet, as these divergence sell setups have not yet confirmed. However, the astute trader must be aware that these setups are looming, because if they confirm, they imply a minimum 15% move to the downside for Meta.
-We are bullish on any pullbacks into the 446 to 495 range (Monthly & Weekly MAC lows). These are considered Buying opportunities and valid areas to look for entry triggers on entry timeframes.
-Cycles suggest a cyclical high right around now, heading into a significant cyclical low in early to mid October (possibly into November). I'd like to see this cycle play out to have price trade down into the Monthly/Weekly MAC lows, where we will be ready to hunt entry triggers to the long side.
Amazon - Buying Pullbacks & Cyclical High Expected SoonHere is what I am watching on Amazon.
-We need to be aware that there is bearish divergence setting up on the quarterly, monthly & weekly charts. HOWEVER, this divergence is not yet confirmed, and is therefore not actionable trade intel at the present moment. We need to monitor these divergences, because if they confirm, they imply significant price moves in Amazon share price.
-MAC strategy for the Quarterly, Monthly & Weekly charts remain bullish. Any pullbacks into the bottom of the MAC are BUY opportunities. I do not blindly buy the bottom of the channels, but utilize lower timeframe entry techniques at these levels to trigger into a position. We are still BULLISH Amazon.
-Cycles suggest that Amazon could put in a cyclical high any time between now and October 10th, before putting in a major cyclical low at the end of October. I would like to see this play out to provide us with nice buy opportunities at the bottom of the MAC's.
Google - Looking For Sell Triggers Around 171This video provides an overview of the things that I am watching for Google right now.
-We need to monitor the quarterly, monthly & weekly divergences that are currently setup, but not yet confirmed. These are not actionable right now, but they definitely need our attention. If confirmed, they imply some very significant moves in this market.
-We can see that the Monthly is still bullish, and we had a monthly MAC entry confirm on the Daily on September 13th. This trade still has not hit its targets, with the first being 169.69 (what a great number). The second target being 180. I would not be surprised to see Google trade up to 169.69 sometime soon.
-The Weekly chart is confirmed bearish for the MAC strategy. What this means is that any rallies into the weekly MAC high are opportunities to sell on the H6 chart. I'll be looking for sell triggers if price trades into the 171 level (Weekly MAC high).
-Threw in some cycles, for fun.
Have a great week.
NVDA - Still Bullish, But Major Potential Sell Signal LoomingThis week in NVDA I am paying attention to the following:
-On the monthly timeframe, we see that there is a significant bearish divergence setup forming. This has not yet triggered, though, so the bulls can relax (for now). However, in 7 days when the Monthly candle closes, we need to pay close attention to the CCI divergence. If it confirms, it implies a MAJOR bearish correction for NVDA is on the horizon.
-But in the meantime, everything is all systems go for the bulls. If you trade based on the Monthly, any pullbacks into the $88 region (Monthly MAC low) would be satisfactory spots to look for Buy triggers on the Daily timeframe. The Williams Acc/Dis is positioned well above its 57 period MA, which means we should look to buy any pullbacks into the low of the MAC.
-Weekly analysis also implies all is good for the bulls. I will look for Buy triggers on the 6H chart if price pulls back into the $107 region (Weekly MAC low).
-For fun, I throw some cyclical analysis into the mix. We see that NVDA has a strong seasonal cycle for an upmove from early October into November.
Thank you for reading. Enjoy your week.
Apple - High & Intermediate Term AnalysisToday, we look at Apple utilizing a variety of techniques: Divergence, MAC & Cycles.
We need to keep an eye on the quarterly, monthly & weekly bearish divergences that are occurring. They have not yet triggered, so bulls don't have to worry (yet). But we must keep our eyes on these divergences, because if they trigger, they imply significant downside ahead for Apples share value.
We take a look at the MAC and see that there is a case to be made for some further upside this week, and based on todays state of the indicators, longs are favored on any pullbacks to the MAC on the Daily chart.
Cycles show a bit of a mixed bag of possibilities. I'm most interested in the Decennial pattern and the APZ's.
Let me know if you have any questions.
JPM - 10% to 20% Dip IncomingDISCLAIMER: This is not trade advice. This is for educational & entertainment purposes only to demonstrate how I am looking to be involved with this market. Trading involves significant risk, do your own due diligence.
A concerning sign for JPM bulls triggered today. We saw the DPO & CCI divergence confirmed. Price targets to the downside of this confirmation imply a 10% to 20% dip is coming for JPM.
See you down there.
20% to 40% Dip Coming for Microsoft?DISCLAIMER: This is not trade advice. This is for educational & entertainment purposes only to demonstrate how I am looking to be involved with this market. Trading involves significant risk, do your own due diligence.
A concerning sign for Microsoft bulls triggered a few weeks ago. We saw the DPO divergence confirmed. Price targets to the downside of this confirmation imply a 20% to 40% dip is coming for Microsoft.
Do you think Microsoft is heading for a dump?
I do.
See you down there.
US30 POTENTIAL SELL OPPORTUNITYSell Opportunity for US30 (1-Hour Chart)
Trade Setup:
We are looking to initiate a sell position on US30, targeting a strong bearish momentum observed around the 42076 level.
Entry Point:
Sell at or near 42076.
Target:
Aim for a profit target of 30-80 pips below the entry point.
**Stop Loss:**
Place a stop loss 65 pips above the entry to manage risk effectively.
Current market conditions indicate heavy bearish momentum, making this an opportune time to capitalize on potential downward movement. We will monitor the trade closely and secure profits if necessary to safeguard gains.
**Risk Management:**
Ensure position sizing aligns with your overall trading strategy to mitigate potential losses.
GBPCAD - Technical Analysis [Short Setup]🔹 GBPCAD Analysis on 1HR chart
- The current Trend BULLISH
- Bearish Divergence is Present
- No Reversal pattern
- If HL breaks, we will take short position
🔹 Trade Plan
- Entry Level = 1.78051
- Stop Loss = 1.78599
- TP1 = 1.775
- TP2 = 1.7696
🔹 Risk Management
- First TP is 1:1
- Second TP is 1:2
🔹 How to Take Trade?
- Only risk 2% of your portfolio
- Take 1% risk entry with 1:1 RR
- Take 1% risk entry with 1:2 RR
Like and subscribe to never miss a new idea! ✌🏼
Falling Wedge Sees Bullish Order Block! - EUHere I have EUR/USD on the 4Hr Chart!
EU Bears have been pulling price down forming what seems to be a Falling Wedge since the end of August but could the Double Bottom made by the Sell-Side Liquidity and New Swing Low be a sign that Price is loading up to make its Bullish Break?!
Now we see Price after being rejected from the Falling Resistance, descending to the Break of Structure @ 1.10548 and the Order Block responsible for sweeping Sell-Side Liquidity @ 1.10437 being the Entry Range for when Price comes down and Successfully tests the Order Block!
*This rejection also creates a Higher High or disruption in the Downtrend suggesting power transfer from Bears to Bulls.
Now another big tell is the Bullish Divergence between the RSI and Lows of Price testing the Falling Support!
Also the presence of Bears in the BBTrend seems to be dwindling with each Low created where you see the collection of Red Bars shrinking!
Fundamentally, USD has Retail Sales on Tuesday (Sept. 17th) and Federal Funds Rate / FOMC Meeting on Wednesday (Sept. 18th) with expectations for Rates to start being cut!
USDCAD - Technical Analysis [Long & Short Setup]🔹 USDCAD Analysis on 1HR chart
- The current Trend Seem neutral
- Bearish Divergence is Present
- No Reversal pattern
- Found Harmonics AB=CD Pattern
- Waiting for a Break of Structure for Confirmation Either at Point C or At Point B.
- If point C break we short.
- If point B break we long.
🔹 Trade Plan At Point C
- Entry Level = 1.35589
- Stop Loss = 1.36036
- TP1 = 1.35137
- TP2 = 1.34681
🔹 Trade Plan At Point B
- Entry Level = 1.36297
- Stop Loss = 1.35783
- TP1 = 1.36757
- TP2 = 1.37213
🔹 Risk Management
- First TP is 1:1
- Second TP is 1:2
🔹 How to Take Trade?
- Only risk 2% of your portfolio
- Take 1% risk entry with 1:1 RR
- Take 1% risk entry with 1:2 RR
Like and subscribe to never miss a new idea! ✌🏼
NZDUSD - Technical Analysis [Long Setup]🔹 NZDUSD Analysis on 1HR chart
- The current Trend is Bullish
- Bullish Divergence is Present
- No Reversal pattern
- Waiting for a Break of Structure for Confirmation
🔹 Trade Plan
- Entry Level = 0.61647
- Stop Loss = 0.61072
- TP1 = 0.62223
- TP2 = 0.62802
🔹 Risk Management
- First TP is 1:1
- Second TP is 1:2
🔹 How to Take Trade?
- Only risk 2% of your portfolio
- Take 1% risk entry with 1:1 RR
- Take 1% risk entry with 1:2 RR
Like and subscribe to never miss a new idea! ✌🏼
Harmonic Crab Variation + Bullish RSI Divergence - GUHere I have GBP/USD on the 30 Min Chart!
Price has found Support from the July Highs!
Upon reaching the Low @ 1.30493 I notice a couple things:
-Price is moving Lower, RSI is moving Higher = Bullish RSI Divergence
-Price has created what looks to be a variation of the Harmonic Crab Pattern (not exact values)
Harmonic Crab XACBD Values:
X-B ( .382 - .618 )
A-C ( .382 - .886 )
B-D ( 2.618 - 3.618 )
X-D 1.618
We continue to see price move higher and I believe we will see Higher Highs up to the 1.3130 - 1.3140 Area!
Fundamentals:
GBP has been positive in the analyst eyes this week with the Claimont Count Change with impressive numbers and Unemployment down from 4.2% to 4.1%!
-GBP will have GDP releasing Wednesday Sept. 11th with forecasts to be Positive!
USD not only has Rate Cuts starting next week but this week is heavily loaded with CPI & Core CPI Wednesday along with PPI, Core PPI & Unemployement Claims Thursday Sept. 12th!