Divergence Trading Explained For Beginners -DAX Pullback TradeTrading divergence in the Forex or Stock market can be an important tool. Learn how to identify divergences & practically apply them to your technical analysis to increase your edge & profits in the financial markets.
In this video you'll learn
What is a bullish and bearish divergence
How to use divergence to spot potential reversals in the market
How to use volume to identify key levels of reversals
How to measure out a "Kill Zone"
What are tweezer tops & tweezer bottoms & why they are important
How to use the Fibonacci retracement tool
How to use the Relative Strength Index (RSI Indicator)
Your Trading Coach - Akil
Divergence

BTC ANALYSIS (update)🔮 #BTC Analysis 💰💰
As we saw that there was a very bullish move in #BTC. Now we expect a correction in #BTC. Also there is a bearish divergence in RSI. We will see a correction first after that we it will again continue to rise.
🔖 Current Price: $95950
⁉️ What to do?
- We have marked some crucial levels in the chart. We can trade according to the chart and make some profits in #BTC. Keep your eyes on the chart, observe trading volume and stay accustom to market moves.🚀💸
#BTC #Cryptocurrency #Correction #DYOR

GOLD 1H Bearish Divergence Analysis:
Price Action (Top Section of Chart)
The price is making higher highs (shown with the upper trendline).
Relative Strength Index (RSI) (Bottom Section of Chart)
The RSI is making lower highs (shown with the downward trendline).
This is a bearish divergence, meaning that while the price is rising, the RSI is weakening, indicating that momentum is fading. This often suggests a potential reversal or pullback in price.
Confirmation:
The price has already started reacting to this divergence, showing some rejection from the highs.
The RSI dropping below 50 is an additional bearish signal.
If the price falls below support (around 2,864.95 EMA and 2,834.22 horizontal support), the bearish move could accelerate.

Long Idea On EthereumBased on my propietary indicator tools,i see a good opportunity to go long on ETH1!, seasonality gives us a clear long bias and on the POIV we can see a divergence.

Understanding RSI In TradingThis article takes a deep dive into the Relative Strength Index (RSI), a powerful tool for traders at any level. We’ll break down how RSI works, how to interpret it, and how to use it effectively in your trading strategies. Plus, we’ll touch on the math behind it. Whether you’re a seasoned pro or just getting started, this guide will give you the insights you need to make RSI a valuable part of your trading toolkit.
Understanding Oscillators in Trading
An oscillator is a technical indicator that moves between two extremes, usually ranging from 0 to 100. Traders use oscillators to spot overbought and oversold conditions in the market. An overbought signal suggests that excessive buying has driven prices too high and may not be sustainable, while an oversold signal indicates the opposite—excessive selling that could lead to a potential rebound. By tracking these price oscillations, traders can anticipate trend reversals and make more informed decisions.
Key Functions of Oscillators:
Momentum Analysis: Oscillators gauge the speed and strength of price movements, offering insights into an asset’s momentum.
Volatility Detection: They help identify periods of high or low volatility, enabling traders to adjust their strategies accordingly.
Trend Confirmation: When combined with other technical indicators, oscillators can validate or reveal emerging trends in the market.
Introduction to the RSI Indicator
The Relative Strength Index (RSI) is a momentum-based technical indicator used to assess the strength of recent price movements and identify overbought or oversold conditions in an asset. It helps traders spot potential trend reversals by oscillating between 0 and 100. An RSI above 70 suggests the asset may be overbought, while a reading below 30 indicates it may be oversold.
By the end of this, you'll be an RSI expert!
Interpreting RSI Readings
RSI values above 70 suggest that an asset is overbought, meaning it has likely experienced a sharp price increase and may be due for a correction. On the other hand, RSI values below 30 indicate that the asset is oversold, implying a steep price drop and the possibility of a rebound.
However, it's important to remember that RSI isn't foolproof and can occasionally give false signals. To increase accuracy, it's best to use RSI in combination with other technical indicators and fundamental analysis.
Overbought: An RSI reading above 70 signals that the asset may be overbought and due for a correction. This could present a potential selling opportunity, but traders should be cautious, as false signals can occur.
Oversold: An RSI reading below 30 indicates that the asset may be oversold and due for a rebound. This can signal a potential buying opportunity, but again, traders should be cautious of possible false signals.
Divergence: Divergence happens when the RSI moves in the opposite direction of the price. For instance, if the price makes new highs while the RSI forms lower highs, this could point to a potential trend reversal.
Support and Resistance: The RSI can also help identify support and resistance levels. If the RSI consistently bounces off the 30 level, it may indicate a support level. Conversely, if the RSI repeatedly fails to break through the 70 level, this could signal a resistance level.
RSI and Divergence
Divergence happens when the RSI moves in the opposite direction of the asset's price, often signaling a potential trend reversal. For example, if the price is hitting new highs but the RSI forms lower highs, it could indicate a bearish divergence, suggesting a possible sell signal.
A common example of bearish divergence is when the price of an asset makes higher highs, but the RSI forms lower highs. This suggests weakening buying momentum, even as the price continues to rise. It can be a sign that the uptrend may be losing steam, with a reversal to the downside potentially on the horizon.
On the other hand, bullish divergence occurs when the price is making lower lows, but the RSI is making higher lows. This indicates that selling pressure is subsiding, and the asset may be primed for a rebound to the upside. Traders can use this pattern to time their entries for long positions.
RSI divergence can help traders identify overbought or oversold conditions, enabling them to make more effective decisions about entry and exit points. However, divergence should always be used alongside other technical and fundamental analysis for confirmation before acting on the signal.
Calculating the RSI Indicator
Calculating the RSI is straightforward once you break it down. The goal is to determine the average gains and losses over a set period, typically 14 days. This helps assess the strength of price movements and identify overbought or oversold conditions. While the math may sound complex, understanding the formula is key to using the tool effectively.
The RSI formula is:
RSI = 100 - (100 / (1 + (Average Gains / Average Losses)))
This calculation provides valuable insights into the relative strength of an asset’s price movements.
Factors Affecting the RSI Calculation
The RSI calculation can be influenced by several factors, with the length of the time period being the most significant. A shorter period (e.g., 5 days) results in a more volatile RSI that responds quickly to price changes, while a longer period (e.g., 20 days) creates a smoother RSI, filtering out short-term fluctuations. The ideal time period depends on your trading style and the volatility of the market you're analyzing.
Why the RSI Indicator is Powerful
Identifies Overbought and Oversold Conditions: The RSI helps traders recognize when an asset is overbought or oversold, allowing them to time their entries and exits more effectively.
Detects Divergences: Divergences between the RSI and price can signal potential trend reversals, giving traders an early warning to adjust their positions accordingly.
Flexible and Customizable: Traders can adjust the RSI’s period to match their trading style and the specific market conditions, making it a highly versatile tool for technical analysis.
Widely Adopted and Well-Understood: The RSI is one of the most popular technical indicators, with a wealth of resources and analysis available to assist traders in interpreting its signals.
Practical Application in Real Life
Here are a few effective strategies where RSI can be combined with other technical indicators for a more comprehensive analysis:
Example 1: RSI + Support/Resistance + Moving Averages
Scenario:
You are analyzing a stock that has been in an uptrend, with the price currently approaching a key resistance level at $100. The 50-period moving average is also trending upwards, confirming the bullish trend.
The RSI is at 75, indicating an overbought condition.
As the price nears the resistance level, the RSI starts to flatten, suggesting the upward momentum might be weakening.
You wait for the price to fail to break above the $100 resistance level and the RSI to drop below 70, signaling a potential reversal. This provides a clearer sell signal, as both the price and RSI align with the idea that a correction could be coming.
Why this works:
By using both RSI and moving averages with support and resistance, you have a solid confirmation of the potential reversal, as it combines trend analysis with overbought conditions.
Example 2: RSI + SFP (Swing Failure Pattern) + Price Action
Scenario:
You’re monitoring a currency pair that recently made a new low, breaking through a previous swing low at 1.1500. However, the price quickly reverses and fails to sustain the breakdown, bouncing back above the previous low, forming an SFP.
At the same time, the RSI is below 30, but it starts to turn upward, forming a bullish divergence (higher lows on the RSI while the price makes lower lows).
This divergence and the SFP setup suggest that the selling pressure is decreasing, and a potential reversal to the upside could be imminent.
Why this works:
The Swing Failure Pattern highlights the false breakdown, and the RSI divergence confirms that momentum is shifting. This combination increases the likelihood of a successful trade when entering on the potential reversal.
Key Takeways
The RSI is an essential tool for traders looking to spot overbought or oversold conditions and potential trend reversals. By mastering how to interpret RSI readings and incorporating them into your strategies, you can improve your decision-making and potentially boost your trading results. For a more balanced approach, always use RSI alongside other technical indicators and fundamental analysis.

Indusind Bank Bottoms Reversal confirmed in seeing a good upside Can see 10 % upside and if sustain above 1100 then we can see new rally.
This post is just my perception and for study purpose only.
I am not a SEBI registered analyst. As stock market has risk of loosing money.
Please invest your hard earned money carefully.
I will not be responsible for any loss in the stock market.

GBPUSD Long PositionWe have Smt on GU
And we’re in the Distribution Move
Then the price activate the buy Program Right Now !
So target The Previous Day High 💸

Continuation to Previous Week LowExhausted buyers may be absorbed as we complete the ADR for the week at 1.03420
This is as long as the descending divergence rom the high of day is maintained after the liquidity grab at London Open off our POC on our 'P' Market Profile

Bearish divergenceBearish divergence between December 2024 and February 2025. Watching. No positions.

WTI | Selloff Back to $68 w/USD/JPY CorrelationSince the last call on Oil we successfully hit the $77 target.
This next move is now looking to head back to $68 support based on the pivot moves within the current Descending Triangle pattern.
This is also another opportunity to take a back-to-back swing on FX:USDJPY
We got divergence on the forex pair acting like the 'price' and 'oil' acting like the indication
(Convergence/Divergence)
Oil moves first on the down move and usdjpy will follow through after it makes one more leg up.

btc breakout happening as we speak, double div up to 108kbtc chart - double 4h div into breakout, i think is good chance for blaster

S&P500 & US30 Active DivergenceDivergence does not always have to be observed through the lens of a lagging indicator. Closes do provide powerful signals as to when a move is likely to reverse direction. They also allow us to enter with a smaller risk.
Lets first compare the previous swing lows marked out on both charts (dotted orange horizontal line) on the 20th Dec 2024. Zoom in on the white arrows! What do you see with the closes?
Now focus in on the S/R zone in purple. Notice that the block width is created from the highest high and the highest low of the same swing. These are very important inflection points from which to compare closes when observing divergence between both instruments.
Now observe the yellow arrows!! What do you see with the closes when comparing the S/R zone in purple?
Now look at the yellow UPWARD diagonal median line of both purple pitchforks . have they both touched the same median line? Yes or No? perhaps another line confirming divergence?
As an additional confirmation the market has touched the upper line of both light blue DOWNWARD pitchforks on both instruments with the current candle
Lets see if we get the reversal.
Cheers

EUR/USD Trade Plan Summary - Reversal
Entry: Place a Buy Stop at 1.04355, confirming a breakout from the falling wedge.
Stop Loss: Set at 1.01702, below the recent lower low to limit risk.
Take Profit: Target TP1 at 1.06993 and optionally TP2 at 1.09253 for extended gains.
Confirmation: Wait for a daily candle close above the wedge before activating the trade.
Risk Management: Risk 1-2% of capital and adjust position size based on the entry-to-SL distance.

The last bullish chance of MYRO in short term!Price has created a divergence on the 4-hour time frame which can raise the price to the middle of the wedge in the short term.
Give me some energy !!
✨We spend hours finding potential opportunities and writing useful ideas, we would be happy if you support us.
Best regards CobraVanguard.💚
_ _ _ _ __ _ _ _ _ _ _ _ _ _ _ _ _ _ _ _ _ _ _ _ _ _ _ _ _ _ _ _
✅Thank you, and for more ideas, hit ❤️Like❤️ and 🌟Follow🌟!
⚠️Things can change...
The markets are always changing and even with all these signals, the market changes tend to be strong and fast!!

potential div h4 eth, long from 3210an idea i've had for eth, aggresive dump and fud at the bottom, potential div forming which has given me confluence for my blind market long

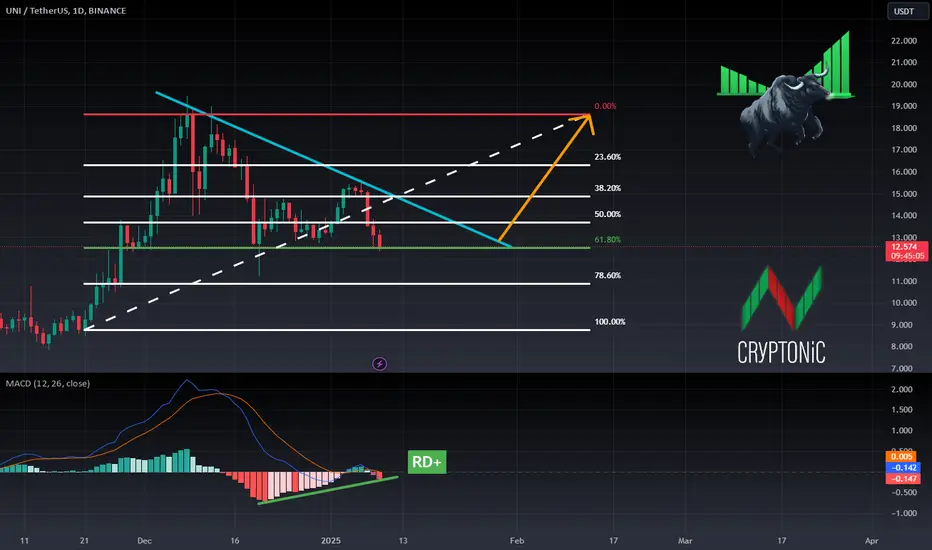
Why I think UNI can be bullish despite the bearish pattern!BINANCE:UNIUSDT
UNI is in a bearish pattern(Descending triangle!) but I think the price will increase cause I see some bullish stuff going on:
1-Bullish divergence on MACD
2-0.618 (61.8%) of the Fibonacci retracement shows a positive reaction for UNI so this might be a turning back point for it!
⚠️ Disclaimer:
This is not financial advice. Always manage your risks and trade responsibly.
👉 Follow me for daily updates,
💬 Comment and like to share your thoughts,
📌 And check the link in my bio for even more resources!
Let’s navigate the markets together—join the journey today! 💹✨
FARTCOIN Analysis - What Shall we Expect !!!The price has formed a wedge, and if the wedge breakout is confirmed with the daily candle closing, it can be said that the price will be bearish towards the 0.618 Fibonacci line. After that, if good volume enters, it can be said that the price may be bullish; otherwise, the price can be bearish down to 50 cents.
Give me some energy !!
✨We spend hours finding potential opportunities and writing useful ideas, we would be happy if you support us.
Best regards CobraVanguard.💚
_ _ _ _ __ _ _ _ _ _ _ _ _ _ _ _ _ _ _ _ _ _ _ _ _ _ _ _ _ _ _ _
✅Thank you, and for more ideas, hit ❤️Like❤️ and 🌟Follow🌟!
⚠️Things can change...
The markets are always changing and even with all these signals, the market changes tend to be strong and fast!!

NEAR can ascend further!The price has faced a volume shortage after breaking the ascending triangle, which is well indicated by the divergence and volume. Technically, in the first scenario, the price can drop to the support line of the triangle and then reach the 0.618 line, or it may fall below the support line of the triangle and reach the 0.382 Fibonacci line, causing traders to get liquidated as usual, and then price rise up.
Give me some energy !!
✨We spend hours finding potential opportunities and writing useful ideas, we would be happy if you support us.
Best regards CobraVanguard.💚
_ _ _ _ __ _ _ _ _ _ _ _ _ _ _ _ _ _ _ _ _ _ _ _ _ _ _ _ _ _ _ _
✅Thank you, and for more ideas, hit ❤️Like❤️ and 🌟Follow🌟!
⚠️Things can change...
The markets are always changing and even with all these signals, the market changes tend to be strong and fast!!

VIRTUAL IS BEARISH !!!!The price is in a wedge, and if it breaks the wedge, it can drop to the 0.618 Fibonacci line. Also, the bearish divergence in the RSI strengthens this signal.
Give me some energy !!
✨We spend hours finding potential opportunities and writing useful ideas, we would be happy if you support us.
Best regards CobraVanguard.💚
_ _ _ _ __ _ _ _ _ _ _ _ _ _ _ _ _ _ _ _ _ _ _ _ _ _ _ _ _ _ _ _
✅Thank you, and for more ideas, hit ❤️Like❤️ and 🌟Follow🌟!
⚠️Things can change...
The markets are always changing and even with all these signals, the market changes tend to be strong and fast!!

Decoding Reversals: Technical Analysis of ONGC: Educational postEDUCATIONAL POST
Technical Analysis of ONGC Stock
This post is for educational purposes only and should not be considered as investment advice.
In this post, we'll analyze the ONGC stock chart using technical indicators.
Key Points:
1. Bullish Divergence: Price and MACD are diverging, indicating a potential reversal.
2. Bullish Divergence: Price and RSI are also diverging, supporting the reversal idea.
3. Resistance Breakout: The stock has broken through a key resistance level with strong volume.
4. MACD Turns Positive: MACD has turned positive after the breakout, confirming the reversal.
5. Elliott Wave Counts: Wave counts suggest a potential reversal.
What to Expect:
Based on these indicators, we can see a potential reversal in ONGC's stock price. It may retrace to Fibonacci levels (50-61.8%) before continuing upward.
Conclusion:
This post is meant to illustrate how technical indicators can be used to analyze a stock chart. Please do your own research and consult with a financial advisor before making any investment decisions.
I am not Sebi registered analyst.
My studies are for educational purpose only.
Please Consult your financial advisor before trading or investing.
I am not responsible for any kinds of your profits and your losses.
Most investors treat trading as a hobby because they have a full-time job doing something else.
However, If you treat trading like a business, it will pay you like a business.
If you treat like a hobby, hobbies don't pay, they cost you...!
Hope this post is helpful to community
Thanks
RK💕
Disclaimer and Risk Warning.
The analysis and discussion provided on in.tradingview.com is intended for educational purposes only and should not be relied upon for trading decisions. RK_Charts is not an investment adviser and the information provided here should not be taken as professional investment advice. Before buying or selling any investments, securities, or precious metals, it is recommended that you conduct your own due diligence. RK_Charts does not share in your profits and will not take responsibility for any losses you may incur. So Please Consult your financial advisor before trading or investing.

Not enough lows amid friction dense marketsRate of return is still bullish but rate of friction is bearish. This lead to stronger bearish market to normalize returns.

Catch Big Reversals Like a Pro Using the GOLDEN RSIHow to Catch Market Tops and Bottoms Using the GOLDEN RSI Indicator
Trading market reversals can feel like a daunting task. But what if you had a secret weapon to help you identify tops, bottoms, and potential reversals with ease? Enter the GOLDEN RSI Indicator—a custom-built tool designed to revolutionize your trading strategy. In this tutorial, I’ll show you how to leverage this powerful indicator to spot reversal trades like a seasoned pro.
What is the GOLDEN RSI Indicator?
The GOLDEN RSI builds on the traditional RSI (Relative Strength Index) by adding optimized zones and visual signals that highlight potential bullish and bearish reversals. Unlike the standard RSI, which requires subjective interpretation, this indicator provides precise entry and exit signals by visually marking key market conditions.
How to Use the GOLDEN RSI to Catch Market Reversals?
Understand the Key Zones:
Overbought Zone (Above 80): Signals a potential market top or reversal from bullish to bearish.
Oversold Zone (Below 20): Indicates a potential market bottom or reversal from bearish to bullish.
Neutral Zone (60-40): Consolidation phase where trends are less decisive.
Spotting Bullish Reversals
When the RSI dips into the oversold zone (below 20) and begins to reverse upward, the GOLDEN RSI will highlight a Bull signal. This suggests a potential upward move, ideal for long trades.
Pro Tip: Look for confirmation with price action, such as a bullish candlestick pattern or a break of resistance.
Spotting Bearish Reversals
When the RSI climbs into the overbought zone (above 80) and starts to turn down, the GOLDEN RSI will mark a Bear signal. This indicates a potential downward move, perfect for short trades.
Pro Tip: Combine with chart patterns like double tops or bearish engulfing candles to strengthen your confidence in the trade.
The Hidden Power of Divergences
Bullish Divergence: Price makes lower lows while the RSI makes higher lows. This signals potential bullish momentum.
Bearish Divergence: Price makes higher highs while the RSI makes lower highs. This signals potential bearish momentum.
The GOLDEN RSI visualizes divergences clearly, so you can spot them effortlessly.
Use Risk Management Tools
Set stop-loss levels below recent swing lows (for bullish trades) or above recent swing highs (for bearish trades).
Use risk-reward ratios of at least 1:2 to maximize your profit potential.
Real Trade Example Using GOLDEN RSI
In the SPX 15-minute chart above, the GOLDEN RSI accurately identified:
A Bearish Reversal near the market top, as the RSI entered overbought territory and started to fall.
A Bullish Reversal as the RSI dipped into the oversold zone and recovered upward.
These signals allowed for precise entry points, minimizing risk and maximizing rewards.
Why the GOLDEN RSI is a Game-Changer
Unlike generic RSI tools, the GOLDEN RSI is designed with traders in mind. It eliminates the guesswork by providing visual cues for market reversals. Whether you’re trading stocks, indices, or crypto, this indicator is a must-have in your toolkit.
How to Get the GOLDEN RSI Indicator?
Want to try it for yourself? Head over to TradingView and add the GOLDEN RSI Indicator to your chart. Use it alongside your favorite price action strategies to take your trading to the next level.
Conclusion
Reversals can make or break a trader’s portfolio. By mastering the GOLDEN RSI, you can confidently spot market tops, bottoms, and reversals with precision. Start using this custom indicator today and watch your trading results improve dramatically!
Don’t forget to like, share, and follow me on TradingView for more tutorials like this one. Let’s catch those reversals together!

#AVAX #AVALANCHE 2025 TARGETSBased on what we see on the three-year chart of AVAX, the uptrends of this currency are also created on parallel trends. The last time this trend level was touched was on November 3, 2024, and we are currently observing a hidden divergence on the MACD indicator. Therefore, we can expect the next uptrend for AVAX to begin soon. The price targets are:
1- 60$
2- 84$
3- 123$
4- 205$
STOPLOSS: 29$
