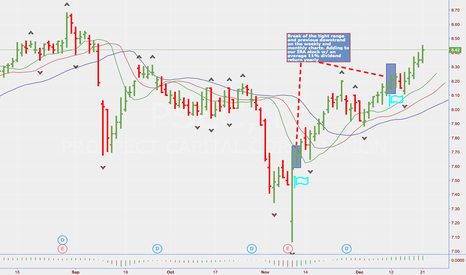
URA LONG - Buy the dipsMaybe u have allready heared the good news for Uranium.
Cameco CCJ has shut down its largest mine. This accounts to 10% of global Production. Together with another cut from other companies this totals 15%!!
France was going to stop relying on nuclear power. It came back on that promise and will continue to build nuclear power facilities.
Asia has a massive buildup in nuclear power plants. Japan will soon re-open its nuclear power plants.
This is great for Supply/demand plays.
Technically this looks great aswell. After a prolonged bear market in Uranium, things are changing.
It broke its long term downward trend on 9 November.
Pulbacks should be welcomed and are buying opportunities.
Key resitence are 16 and 19.24. I used Fibonacci to calculate possible resistence levels.
Not to forget URA gives a DIVIDEND off 6 - 7%!!!!!
Dividend
Sugar - TradeI love Sugar.... I love the Dividends.
RSI had a good run, benefited from low energy costs.
I am taking profit to keep cash on the side-line for the inevitable mrkt correction.
I will re-enter below 5.65 if the fundamentals stay solid.
On Balance Volume is weakening, this could be an indicator that investors are switching to cash or trading to high flying stocks.
Ichimoku 3/5 bear
23-Nov-17 6.23 Bear Chikou Span Cross Strong
" " Bear Kijun Sen Cross Neutral
" " Bear Kumo Breakout
21-Nov-17 6.50 Bull Senkou Span Cross Neutral
" " Bull Tenkan/Kijun Cross Weak
CNSL strong divi buyChart is fairly self explanatory, heavily oversold bear run that has completed 3 waves to the downside. Sports a stellar 8.5% divi as of close today. Conviction buy
CCLP on the recovery? Overall after some brief analysis on this stock I feel that this stock could move upwards. Their dividends are currently at 0.19 cents per shares which gives you a return of about 3.68% which insist half bad. I'd like to see net income go into the black this next quarter. I guess we'll just have to wait and see.
Thanks!
Position before next BreakOut **Dividend**Fundamentally HSBC is confident that their internal investment of process amelioration was a success which wil make the company a lot more efficient with regards to future challanges coming due to the automation revolution.
Investors seem to believe and started buying the stock back. HSBC was always paying a nice dividend and so are they this year.
Conservative investors may wait until trend confirmation a new breakout. More aggressive may buy 1/2 now, TP on the BO. Buy back into 1/2 at BO level and buy another half in the support.
Strategy:
Better than 50/50 chance on capital gain for mid-term
Dividend payment
Potential Options hedges to increase your income on this opportunity
BPL - dividend stock paying 8% yearlyone long term dividend payer stocks is BPL, which pays 8% yearly as dividend increasing dividends yearly for 6% for 20 years now
48% long term debt, fair value is 65$ trading at 63.50$ at the moment
TROW - dividend champion with 3,2% payout increasing 15% yearlyTROW is another company that pays currently 3,2% dividend per share, increasing their dividends yearly for 15% in the last 20 years.
fair value: 75$ currently trading at 71$
1% long term debt (!), 15% increas of dividend in the last 20 years
Analyse stocks by looking at DIVIDEND GROWTH and DIVIDEND/PRICE Analyse stocks by looking at 3 MONTH time frame looking at Dividend Payouts and Dividend/Price Ratio.
For example: A stock that raises its dividends for many years now yearly by more than 10% and has currently a 4,2% dividend/price ratio (meaning you get 4,2% dividends per every USD you pay) is a good buy, since it is very cheap historically and will probably increase dividends in the next years, meaning you can double your money by dividends in approx. 10 years (additionaly adding the rise of stock value).
Use this indicator in stocks and 3 MONTHS timeframe (if your use stocks with 1 or 12 dividend payments per year, please switch to 1/12 month time frame).
SSI Long: Low floater with high short interestSSI
Very low active float due to high tute ownership (0.1% of 30,560,280 = 30,560)
High short interest - 21.6% (6,600,489 @ 13 days to cover)
TTM P/E of 9.17 vs. industry average of 21.04
7.98% dividend yield, ex-div 2/26/2016
No one on StockTwits cares about it... yet
LONG GME WITH BIG UPSIDE TARGETS!Long term trade (unless we get a big quick move). Breakout high target $33!!!
ENTRY: $25
FIRST TARGET: $27
SECOND TARGET: $30
FINAL TARGET: $33
TARGETS MAY BE ADJUSTED WITH CHANGING MARKET CONDITIONS***
Not to mention an approximately 6% dividend yield if you have to wait
WMT: Picture perfect long setupWMT is offering a very nice entry, after forming a new weekly mode, which implies the strong uptrend is seeing reaccumulation at higher levels.
I'm looking to enter longs at market, at the open, ideally on retrace to the mid point of the green triangle on chart.
Stops should be below 67.40, for example at 66.51, or using 3 times the daily ATR.
Yield is very nice and I think the stock is due for a 11%+ rally still.
Good luck if taking this trade.
If interested in my trading signals, or in personal tuition, contact me privately. I'm offering a considerable discount on a packaged course which includes access to my private trading signals list for a year.
Cheers,
Ivan Labrie.


