Robert Half | RHI | Long at $37.58Robert Half NYSE:RHI is a company that provides talent solutions and business consulting services in the US and internationally. It's a cyclical stock. Currently, the price has entered my "crash" simple moving average zone ($37-$33) and has historical bounced from this area. This doesn't mean the "major crash" area won't be reached ($26-$21 or below), but the company has been around since 1948 and survived many hurdles along the way.
Earnings are forecast to grow 8% annually and it has a 6.3% dividend. P/E = 21x and financially healthy (low debt-to-equity: .2x, low bankruptcy risk/Altmans Z Score: 5; and enough cash to pay current bills/quick ratio: 1.6).
Regardless of bottom predictions, I think there is a high chance the stock may reach $33 before a slight bounce. If the market flips for a bit, that "major crash" area ($20s) may be hit.
So, a starter position for NYSE:RHI has been created at $37.58 with additional entries near $33 and $25-$26.
Targets into 2028:
$46.00 (+22.4%)
$53.00 (+41.0%)
Dividends

BA: Boeing down on better than expected results! 30-07-2025Yesterday we get Boeing earnings report which came better than expected, but the stock down more than 4% as the company is not expected to make positive profit or free cashflow before 2026. No dividends currently paid, so there is nothing attractive to me now.
Disclaimer: This content is NOT a financial advise, it is for educational purpose only.

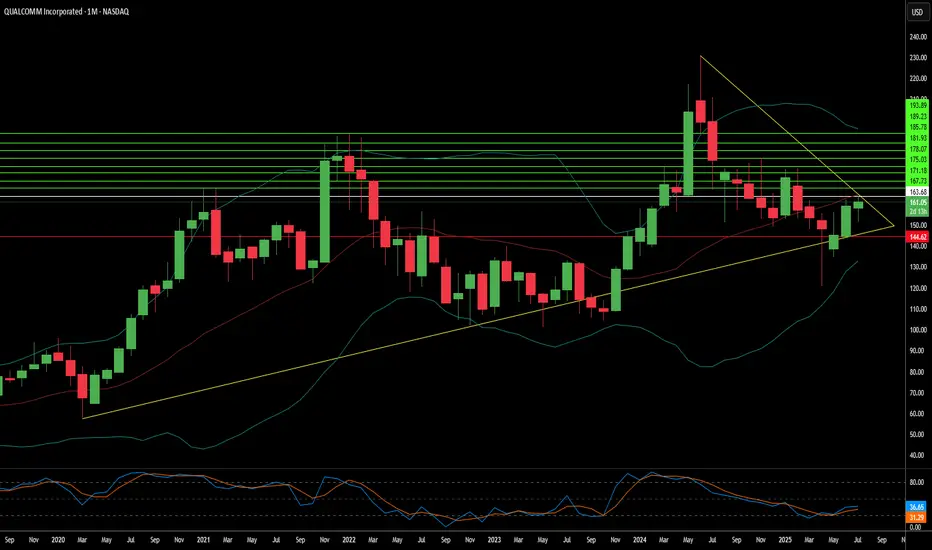
Qualcomm: Beyond the Smartphone Storm?Qualcomm (NASDAQ:QCOM) navigates a dynamic landscape, demonstrating resilience despite smartphone market headwinds and geopolitical complexities. Bernstein SocGen Group recently reaffirmed its "Outperform" rating, setting a \$185.00 price target. This confidence stems from Qualcomm's robust financials, including a 16% revenue growth over the last year and strong liquidity. While concerns persist regarding potential Section 232 tariffs and Apple's diminishing contribution, the company's strategic diversification into high-growth "adjacency" markets like automotive and IoT promises significant value. Qualcomm currently trades at a substantial discount compared to the S&P 500 and the Philadelphia Semiconductor Index (SOX), signaling an attractive entry point for discerning investors.
Qualcomm's technological prowess underpins its long-term growth narrative, extending far beyond its core wireless chipmaking. The company aggressively pushes **on-device AI**, leveraging its Qualcomm AI Engine to enable power-efficient, private, and low-latency AI applications across various devices. Its Snapdragon platforms power advanced features in smartphones, PCs, and the burgeoning **automotive sector** with the Snapdragon Digital Chassis. Further expanding its reach, Qualcomm's recent acquisition of Alphawave IP Group PLC targets the data center market, enhancing its AI capabilities and high-speed connectivity solutions. These strategic moves position Qualcomm at the forefront of the **high-tech revolution**, capitalizing on the pervasive demand for intelligent and connected experiences.
The company's extensive **patent portfolio**, encompassing over 160,000 patents, forms a critical competitive moat. Qualcomm's lucrative Standard Essential Patent (SEP) licensing program generates substantial revenue and solidifies its influence across global wireless standards, from 3G to 5G and beyond. This intellectual property leadership, combined with a calculated pivot away from its historical reliance on a single major customer like Apple, empowers Qualcomm to pursue new revenue streams. By aiming for a 50/50 split between mobile and non-mobile revenues by 2029, Qualcomm strategically mitigates market risks and secures its position as a diversified technology powerhouse. This assertive expansion, alongside its commitment to dividends, underscores a confident long-term outlook for the semiconductor giant.
Bitcoin Cycles Signal Major Move — BIT500 on What Comes NextBitcoin’s historical price action is known for its cyclical behavior — driven not only by supply dynamics like halving events, but also by global macroeconomic forces. This week, leading crypto macro analyst TechDev released a widely discussed model projecting that Bitcoin may be entering a new explosive phase, closely linked to a shift in monetary policy, global liquidity cycles, and risk asset rotation.
At BIT500, we see this as more than a theory — it’s a playbook. Understanding macro-driven crypto cycles gives institutional and high-net-worth investors a clear advantage. And, when used properly, it can become the foundation for consistent alpha generation in the digital asset space.
TechDev’s Model: Liquidity as the True Driver
According to TechDev, Bitcoin’s major uptrends are synchronized with global liquidity expansions. In particular, the model links Bitcoin price surges with:
Falling real interest rates,
Expanding global M2 money supply,
Weakening U.S. dollar (DXY decline).
This pattern played out in 2016–2017 and again in 2020–2021. As global central banks prepare to shift toward more accommodative policies — especially amid slowing GDP growth and rising debt burdens — similar conditions may be taking shape for late 2025 and into 2026.
BIT500 analysts agree: the macro landscape is increasingly favorable for risk-on positioning, especially in hard assets like Bitcoin.
On-Chain Indicators Confirm the Thesis
Supporting the macro thesis is a growing set of on-chain signals. Our internal models — as well as public indicators like Dormancy Flow, MVRV ratio, and Realized Cap metrics — show long-term holders are accumulating, while short-term holder activity has flattened.
The decline in exchange reserves, increased self-custody trends, and decreased miner selling pressure all align with prior pre-bull market phases. This combination of tightening supply and macro liquidity can act as fuel for the next leg up — one that could catch passive investors off-guard.
How BIT500 Capitalizes on Bitcoin Cycles
At BIT500, we convert insights into execution. Our team applies cycle-based, quantitative strategies to capture asymmetric upside while managing downside risk.
Here’s how we turn macro analysis into market performance:
Phased Capital Deployment
We deploy capital in staggered allocations, entering during compression phases and scaling in as trend confirmation emerges — minimizing exposure during volatility and maximizing return during expansions.
Volatility Harvesting
We implement delta-neutral and volatility-arbitrage strategies across Bitcoin derivatives markets, generating income in all phases of the cycle — especially when price is range-bound.
Multi-Asset Rotation Models
Based on cyclical rotation, we dynamically adjust exposure between Bitcoin, Ethereum, and select altcoins. These models are tested to outperform static portfolios across halving-based and macro cycles.
Custom Risk Monitoring Systems
BIT500 clients benefit from our proprietary Cycle Risk Dashboard, which sends alerts when market structure shifts — enabling proactive rebalancing rather than reactive trading.
Conclusion
Bitcoin’s next major price movement is likely to be shaped not just by crypto-native factors, but by broader shifts in global liquidity, interest rates, and investor sentiment. TechDev’s research confirms what BIT500 has long modeled — that understanding economic cycles is key to anticipating large-scale Bitcoin breakouts.
For investors seeking not just exposure but performance, the coming months represent a rare window of opportunity. At BIT500, we don’t just track cycles — we build strategies to monetize them with discipline and precision.
DOW: Dow Inc. cut its dividends in half !High dividends no longer !
I was waiting the stock to reach the support level to benefit from the 10% high dividends yield... but the company cuts its dividends yield from 10% to 5%, so it is no longer valid to me.
Disclaimer: This content is NOT a financial advise, it is for educational purpose only.

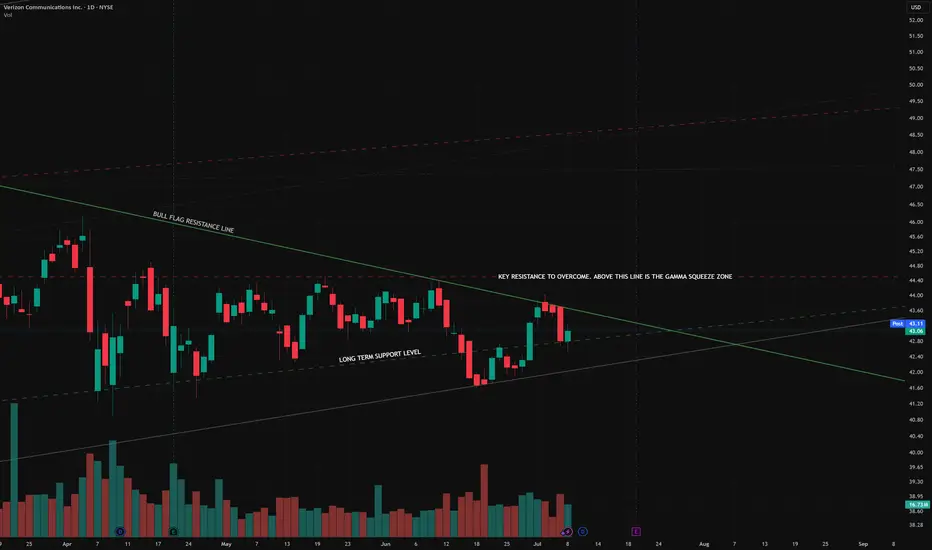
VZ: Verizon Earnings tomorrowwith 6% dividend yield and stock price at support level on the lower channel band, this draw attention to the earnings report tomorrow pre-market hours. Focused on future outlook as well.
If all good, I will buy VZ.
Disclaimer: This content is NOT a financial advise, it is for educational purpose only.

PEP: PepsiCo Earnings resultsIts looks like PEP is a buy now. Just want to double check on future sales growth as it is stable for a while. Lower stock price made the dividend very attractive since PEP is a defensive stock.
Disclaimer: This content is NOT a financial advise, it is for educational purpose only.

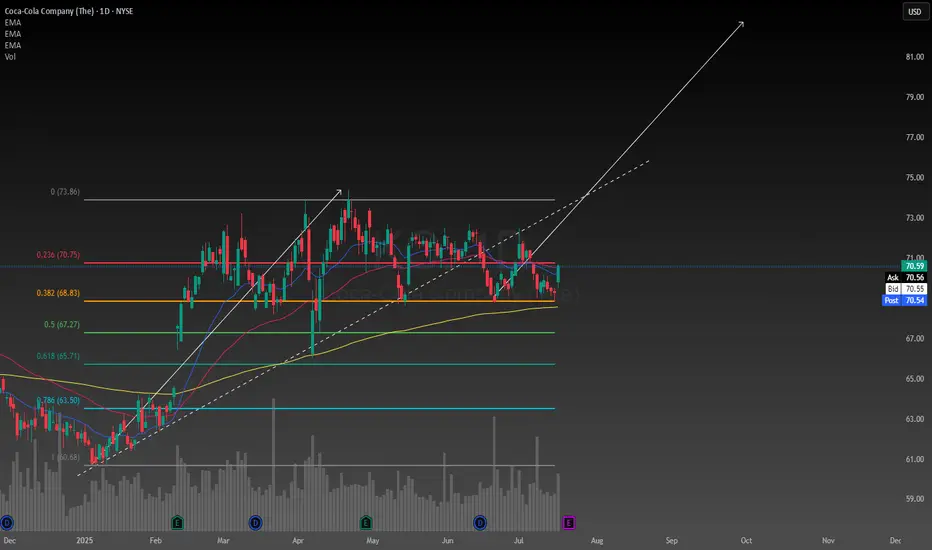
Coca Cola to protect my portfolio and help it growOne of the most important things we must try to determine as investors is what company is the best at what they do in their field. In my opinion Coca Cola is and has always been the number one soft drink manufacturer, always finding new yet subtle ways to stay ahead of their competition.
The reason I have allocated a decent amount of my portfolio to Coca Cola is a combination between their reliable track record of creating value, and paying dividends. People love junk food so it gives me high conviction to hold the stock long term. The company also demonstrates consistent, and reliable methods of generating organic revenue, and constantly finding new ways to cut costs and improve their profit margins.
Despite what some other critics may claim about the stock being over valued, the intrinsic value of the stock happens to be $77 with a range between $48-$180. According to technical analysis it is over valued. I have too much respect for Coca Cola to trust technical analysis in my decision to hold the stock, I am rely solely on fundamentals. According to my perspective on the company it is in fact undervalued.
Another positive catalyst I have noticed was when President Trump said he thinks Coca Cola should be made with cane sugar in the US, I think that would be a great idea, not only would it be healthier the soda would also taste better. Coca Cola looks like its going to stay ahead of the game for the foreseeable future.
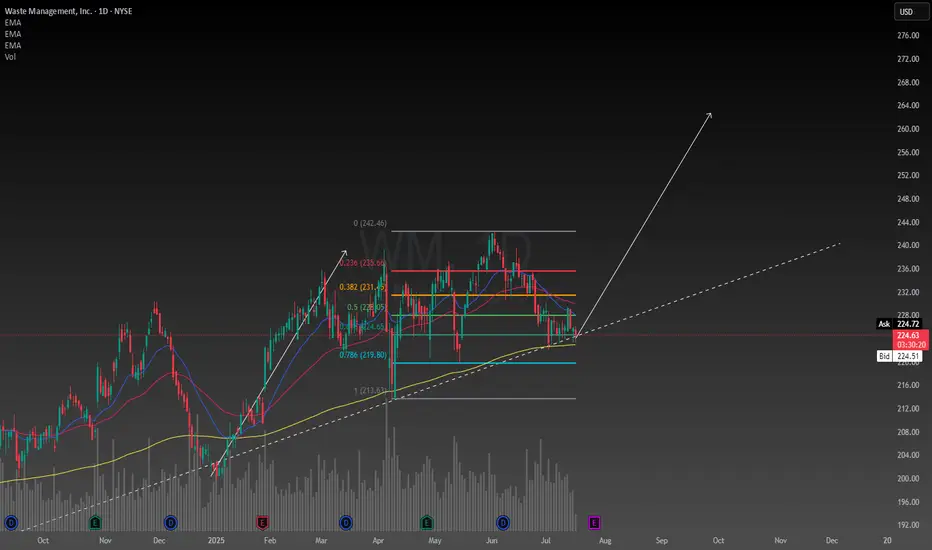
Waste Management confluencesFirst of all fundamentally the company is basically essential to our survival so I have no reason to believe they will go out of business any time soon. Earnings report soon should bring about some volatility. I was foolish enough to buy the top a couple months ago and deciding today I will add the the position because I like this price. Even though I bought the top, it was still below the intrinsic value at the time so it was a reasonable decision.
With my simple trendline and rudimentary use of a Fibonacci I am able to set a price target of $260 depicted by my drawing of a potential new leg up. This is backed up by the absolutely fundamental usage of a calculation of the intrinsic value, which by my calculation is $280, and has a range between $170-$640 however these numbers may need to be adjusted after the earnings report. The value is now well below the intrinsic value so I am seeing this stock as a really good deal now.
Despite any uncertainty in the economy Waste Management has seemed to outperform during these times so it is in my portfolio defensively. This stock is strong when it needs to be, which is why I like it.
ConAgra Brands | CAG | Long at $19.38ConAgra Brands NYSE:CAG , maker of Marie Callender's, Healthy Choice, Birds Eye, Orville Redenbacher's, Slim Jim, and many more, has seen a continuous drop in share price since the rise of interest rates, inflation, and tariffs. The stock is currently trading near its book value of $18.71 and has a dividend yield of 6.9%. Debt-to-equity is reasonable (0.9x), but the company does have a Quick Ratio of 0.2x (short-term liquidity issues) and a Altman's Z Score (bankruptcy risk) of 1.7, which should ideally be 3+. Like almost every large-scale food company, earnings growth is relatively low, but 2025 is anticipated to be its worst performing year - which explains the price.
While the stock is not likely to generate triple-digit returns in the near-term, NYSE:CAG is a strong company with a nice dividend and some growth ahead. I foresee such stocks getting new life with drops interest rates. However, a dip near $17 (into my "crash" simple moving average area) or even slightly lower is possible - which may likely result in another stock entry.
Thus, at $19.38, NYSE:CAG is in a personal buy-zone with future entries planed near $17 or below.
Targets into 2028
$22.00 (+$13.5%)
$25.00 (+29.0%)

Where is Verizon headed next?Some quick points about the slight dip Verizon experienced over the past 5 trading days. Did bears step in and reject higher prices for VZ? Is the potential for a rally over?
In my opinion. No. But why you ask?
This stock trades relatively inverse to 10 year treasury yields. The 4 down days recently coincided exactly with 4 green days for 10 year yields. This is because if treasury prices fall, and thus yields go up, it makes Verizon theoretically less appealing because though you will generate less yield from treasuries, they are backed by the US government.
So in order for Verizon's yield to be more competitive with treasuries, naturally the price declines. When treasury yields drop, VZ can naturally rise, because the dividend can decline relative to price, and it's still appealing. This wasn't investors souring on Verizon, or the bears rejecting a rally, it was investors worrying about US debt repayment, and demanding higher interest payments from the government.
So why did yields spike for 4 days? The Big Beautiful Bill. Basically if the government borrows a bunch of money, and investors think that maybe there is a risk that they won't be able to pay them back, they demand a higher yield (treasury prices fall, and yields go up).
But if you ask me, that yield spike may already be over. The market tends to over-react to big news like this, and there are a few things happening right now that favor VZ going higher, I will list them below :
10 year yields have been trending down for months, they spiked, but only touched the top of the downtrend channel before retreating. They look poised to continue the downtrend for the second half of the week. Remember, the trend is your friend. Until yields break this channel convincingly and create an uptrend, you can assume they will continue downwards.
When tech stocks fall, yields tend to fall even faster, because investors seek the safety of treasuries to preserve capital and wait out the dip, which pushes bond prices up, and drives yields down (good for high dividend stocks like VZ).
Most tech stocks, and the QQQ ETF are looking very overbought. Earnings season is coming, but it looks like all of that action has already been priced in. There are bearish divergences appearing all over the place in tech stock RSI charts, I personally started closing out some positions already.
I'm still bullish on tech into the end of the year, but right now there is a lot of risk chasing the big names higher IMO. This is the longest stretch of days in 3 years without a 5-10% correction, which is already a red flag in itself. I won't be surprised to see some of the big names start to pull back as early as tomorrow, some of them have already begun to pull back. At least a minor correction looks highly probable, a deeper correction within the next few weeks.
10 Year Bond futures bounced and started climbing today (albeit, just a little, but in the right direction).
The market seems to be forgetting that US Treasury Sec. Scott Bessent's former job was literally selling US debt (driving yields down). He has made a career out of pushing yields down, and has stated it's his major goal with this administration. And like Elon said "if you are betting against the bond market, I think you are on the wrong side of that bet." (in short, this is a bullish theme for dividend stocks which are sensitive to yield fluctuations).
All in all, my thesis from previous posts remains. VZ is going higher, so long as 10 year yields don't rocket to all-time highs and stay there forever, and there is no apocalyptic earnings report, I see no reason why it won't.
$PEP Bullish Swing Setup – Oversold & Ready to Rebound ?PepsiCo ( NASDAQ:PEP ) is sitting at a major long-term support after a deep pullback — this could be a strong opportunity for a risk-defined bounce. Here's what the chart is signaling:
🔹 Entry Zone: Price is currently near $128 — a historically significant level that acted as resistance in the past and now aligns with a potential support flip.
🔹 Oversold & Stretched: After a consistent downtrend, NASDAQ:PEP is looking oversold. A bounce is likely as sellers exhaust and dip buyers return at this key level.
🔹 Reversal Structure Building: Early signs of a bottoming pattern are emerging, with potential higher lows forming. If the current structure holds, we could see a climb toward the next resistance zones.
🎯 Targets:
TP1: $154 – minor resistance and previous consolidation zone.
TP2: $197 – major resistance and range high, aligning with earlier highs.
🛡️ Stop Loss: Below $102 — invalidates the support thesis and breaks structure.
💡 Why Price May Rise:
PEP is a defensive name with strong fundamentals, often benefiting during uncertain macro cycles.
Valuation is now more attractive after the sell-off.
The setup offers a high reward-to-risk ratio, especially if broader markets stabilize.
⚖️ Setup Summary:
Entry: ~$128
SL: $102
TP1: $154
TP2: $197
📌 Watching for confirmation with volume or bullish candle structure over the next few sessions.
🚫 Not financial advice — just a technical outlook based on structure and probability.

XRP Price Finds Some Relief — But Headwinds Remain,Says ArtavionAfter slipping below $0.50 last week, XRP has rebounded modestly, now trading above $0.52. While this short-term recovery provides relief for holders, fundamental and structural challenges still limit the token’s upside potential, according to analysts at Artavion.
The recent bounce appears largely technical. Support held near $0.48, and with Bitcoin regaining strength above $66,000, sentiment across altcoins briefly improved. XRP’s Relative Strength Index (RSI) has moved out of oversold territory, suggesting some room for additional upside — but resistance between $0.56 and $0.60 remains firm. Low trading volume suggests the rally lacks conviction.
A major ongoing concern remains XRP’s legal battle with the U.S. Securities and Exchange Commission (SEC). Although Ripple Labs scored partial wins, the case is unresolved. Until a final judgment or settlement is reached, institutional investors will likely remain cautious, and U.S.-based platforms will continue restricting XRP exposure.
🗨️ “The legal cloud hasn’t lifted — and that limits capital inflows,” says a regulatory analyst at Artavion.
From a network perspective, XRP Ledger remains functional and Ripple’s payment infrastructure is active, particularly in select cross-border corridors. However, XRP still lacks integration with key crypto sectors like DeFi, NFTs, and gaming, which restricts organic demand and developer activity.
Externally, macro conditions are neutral to negative for altcoins. The Federal Reserve’s rate outlook and rising bond yields continue to pressure speculative assets. Stablecoin inflows into XRP trading pairs have slowed — another signal of fading short-term appetite.
Outlook
At Artavion, we believe XRP is currently locked in a range-bound pattern. A breakout above $0.60 is unlikely without:
Full legal clarity in the U.S.;
Stronger altcoin sentiment market-wide;
Renewed ecosystem development and integrations.
🗨️ “XRP isn’t broken — it’s waiting,” says the Artavion market desk. “But without a catalyst, it stays reactive — not directional.”

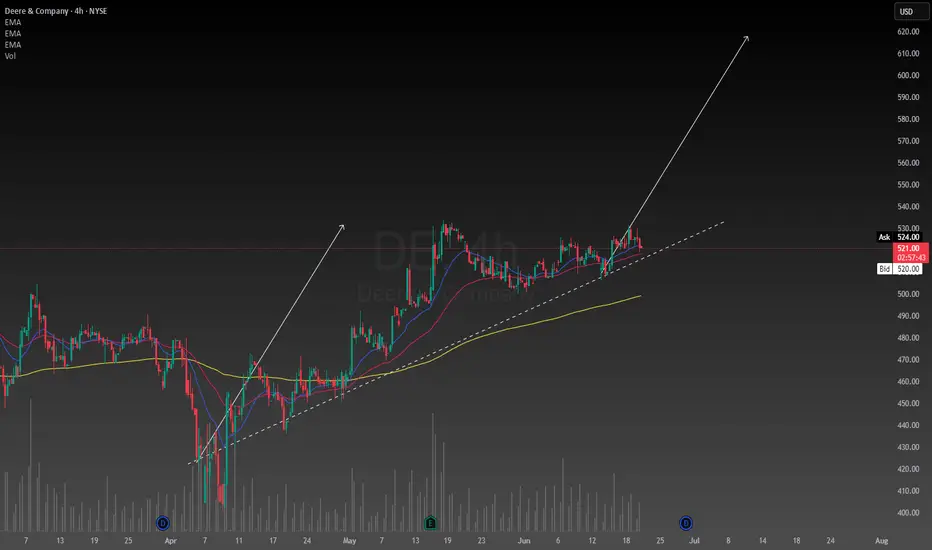
John Deere position trade setupI have been wanting an excuse to add this to my portfolio for a while now. Primarily because Bill Gates has it in his portfolio. I like to try and copy the most successful investors like Warren Buffett, Cathy Wood, Bill Gates, etc... I paid the market price today for a position with a cost average of $525. The intrinsic value of the stock is between $250 - $1050 so its not ideal to be in at $525 but I am not playing the voting game, I prefer the weighing game. I want to see how the position affects the other things I have in my portfolio and hopefully improve the performance with this stock in there. Maybe I will buy more if I can find a reason to add to the position in case it starts losing money because dividends are being paid out soon. I have drawn a simple technical analysis predicting a two legged pullback pattern.
Greer Free Cash Flow Yield (FCF%) — Long-Term Value Signal✅ Title
Greer Free Cash Flow Yield (FCF%) — Long-Term Value Signal
📝 Description
The Greer Free Cash Flow Yield indicator is part of the Greer Financial Toolkit, designed to help long-term investors identify fundamentally strong and potentially undervalued companies.
📊 What It Does
Calculates Free Cash Flow Per Share (FY) from official financial reports
Divides by the current stock price to produce Free Cash Flow Yield %
Tracks a static average across all available financial years
Color-codes the yield line:
🟩 Green when above average (stronger value signal)
🟥 Red when below average (weaker value signal)
💼 Why It Matters
FCF Yield is a powerful metric that reveals how efficiently a company turns revenue into usable cash. This can be a better long-term value indicator than earnings yield or P/E ratios, especially in capital-intensive industries.
✅ Best used in combination with:
📘 Greer Value (fundamental growth score)
🟢 Greer BuyZone (technical buy zone detection)
🔍 Designed for:
Fundamental investors
Value screeners
Dividend and FCF-focused strategies
📌 This tool is for informational and educational use only. Always do your own research before investing.

Canadian Natural resources is undervaluedUsing my simple method of technical analysis and fundamental calculation of the intrinsic value of a stock for which the range of intrinsic value of CNQ is between $35-$55. Assuming oil can make a reversal at this pivotal time in history for the world the stock looks very cheap. It also pays good dividends soon which was a bonus I bought some at $31 dollars for the market price. It looks like a great addition to make a nicely diversified portfolio.

Simple Coca Cola daily chart analysisCoca Cola, my favorite defensive stock seems to be at a price decision in time. I have found a single trend line that looks reasonable. There seems to be a lot of congestion in price over the last few days this leads me to believe a breakout is coming soon. 25% of my portfolio is Coca Cola, it pays great dividends and I love the history of the company. It is a solid choice for these economically uncertain times, I think they do soda better than anyone else I been drinking Coca Cola as long as I can remember its still my favorite.
I believe its possible to see a retracement down to cheaper prices but I also don't believe in waiting for such occurrences to happen so I have already been accumulating for the last few weeks. The range of the intrinsic value of Coca Cola is between $50 - $180. My prediction for the price is that it will go up over the next 12 months. Thank you for reading my article and best wishes, cheers.

Waste Management price predictionFundamentally WM stock is proven to be resistant to recession. I have a position on the stock as a hedge against uncertainty it makes up about 15% of my portfolio as of this writing. I am looking to buy more at lower prices since I bought at a premium a couple weeks ago. I will try and hold indefinitely as the other growth stocks I have chosen continue to grow I don't expect much from this boring stock but it makes me feel better to have it in my portfolio than it does not to. The range of the intrinsic value is between $170 - $620.

Nike (NKE) Long Term Buy - Pennant SetupNKE -33.46% 1Y
Analysts price target = 73.05 (suggests ~16.3% upside)
EPS expected to bottom in Q4 '25
P/E ~35% lower than historical
P/S ~42% lower than historical
Dividend yield 2.57%
Buy Zone = 58-60
Target 1 Area = 70-72

Why I Use Covered Calls: Monthly Income, StrategyDescription:
In this video, I break down why I use covered calls as part of my long-term investing strategy—especially inside tax-advantaged accounts like Roth IRAs. Whether you're looking to generate steady monthly income, reduce downside risk, or are open to selling your stocks at a premium, covered calls can be a powerful tool.
🧠 What You'll Learn:
Why covered calls are ideal for long-term holders who want extra income
The basic requirements (100 shares, option approval, etc.)
Why volatile stocks yield better premiums than dividend stocks
My personal method: targeting 0.20 delta strike prices on a monthly timeframe
Risks like being assigned and limiting your upside
💡 Key Takeaway:
If you’re not using a tax-advantaged account, your capital gains are taxable—so consider strategies like this inside an IRA.
📌 Coming Soon:
In a future video, I’ll dive into the Wheel Strategy and selling puts to generate income from cash reserves.

Czech Republic: A Dividend HeavenThe Prague Stock Exchange (PSE) PSECZ:PX is characterized by a concentration of mature, dividend-paying companies, particularly in sectors such as energy, banking, and heavy industry. Unlike growth-focused exchanges in the U.S. or Asia, the Czech market offers relatively few stocks with high reinvestment or expansion trajectories.
Preference for Payouts
Over the past two decades, Czech listed companies have consistently distributed a significant share of profits as dividends. This reflects both limited reinvestment opportunities in a relatively saturated domestic market and a shareholder preference for cash returns. For example, CEZ and Komercni banka have maintained payout ratios above 70% in most years.
Structural Support & Tax environment
The Czech Republic provides a structurally supportive environment for dividend-oriented investors. One key advantage is the tax framework. Czech residents are exempt from capital gains tax if they hold an investment for more than three years. This strongly favors long-term investing.
For non-residents, a 15% withholding tax on dividends applies—unless the investor resides in a country outside the EU/EEA that does not have a tax treaty or tax information exchange agreement with the Czech Republic.
Key Dividend-Paying Companies
CEZ (CEZ) PSECZ:CEZ
Industry: Energy (Electricity generation and distribution)
Dividend History (Gross per Share) / Dividend Yield (%)
2020: CZK 34 10.1%
2021: CZK 52 5.8%
2022: CZK 48 18.83%
2023: CZK 145 5.43%
2024: CZK 52 5.9%
Dividend Growth:
2020 to 2021: +52.9%
2021 to 2022: -7.7%
2022 to 2023: +202%
2023 to 2024: -64.1%
Komercni banka (KOMB) PSECZ:KOMB
Industry: Banking and financial services
Dividend History (Gross per Share) / Dividend Yield (%)
2020: CZK 23.9 3.63%
2021: CZK 99.3 10.62%
2022: CZK 60.42 9.22%
2023: CZK 82.7 11.41%
2024: CZK 91.3 10.76%
Dividend Growth:
2020 to 2021: +315.6%
2021 to 2022: -39.2%
2022 to 2023: +36.9%
2023 to 2024: +10.4%
Moneta Money Bank (MONET) PSECZ:MONET
Industry: Banking and financial services
Dividend History (Gross per Share) / Dividend Yield (%)
2020: CZK 0 (dividend suspended)
2021: CZK 3 10.67%
2022: CZK 7 10.53%
2023: CZK 8 12.82%
2024: CZK 9 8.08%
Dividend Growth:
2020 to 2021: N/A
2021 to 2022: +133.3%
2022 to 2023: +14.3%
2023 to 2024: +12.5%

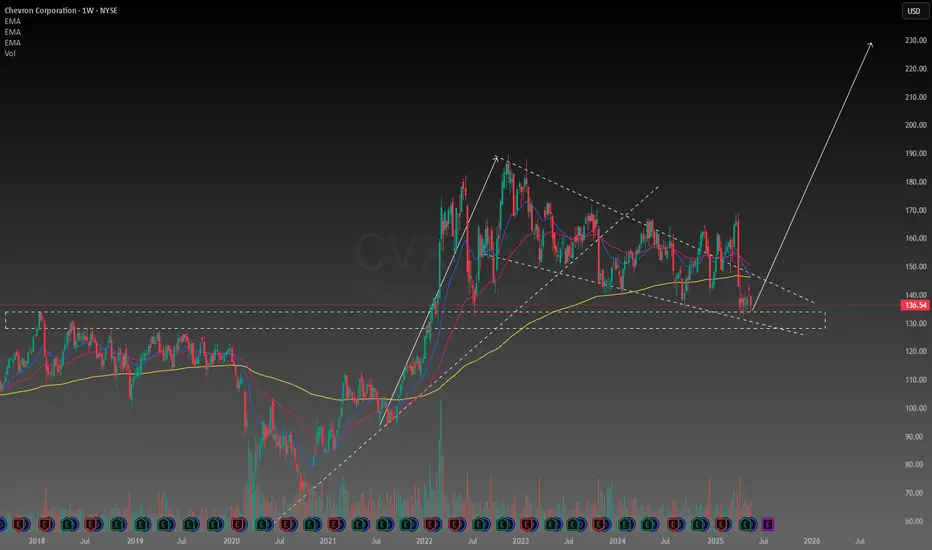
Chevron wedge bull flagChevron stock is well below its intrinsic value, I found a decent setup based on technical analysis for my entry, because of the attractive dividend payouts I will buy and hold CVX for awhile and see what happens.
Bitcoin Income: STRK vs IBIT – Dividends, Covered CallsThis video provides a performance breakdown between two Bitcoin-related financial instruments—STRK (Strike) and IBIT—through the lens of passive income generation. I compare traditional buy-and-hold strategies with more active income tactics such as covered calls. Key insights include:
STRK provided the best return YTD (26%) and yielded approximately 1.54% in passive dividends, requiring minimal effort—just buy, hold, and collect.
IBIT, while slightly trailing in growth (13%), is optimized for a covered call strategy, offering an impressive 6% income yield through active options trading.
The analysis highlights the trade-off between simplicity and engagement—STRK is more passive-friendly, while IBIT offers higher yields for those willing to manage options.
This is ideal for tech-savvy investors exploring Bitcoin ETFs and derivative income strategies, weighing convenience versus return potential.
