Divislabshort
DIVISLAB 1W TIMEFRAME PROJECTIONDIVISLAB 1W TIMEFRAME PROJECTION
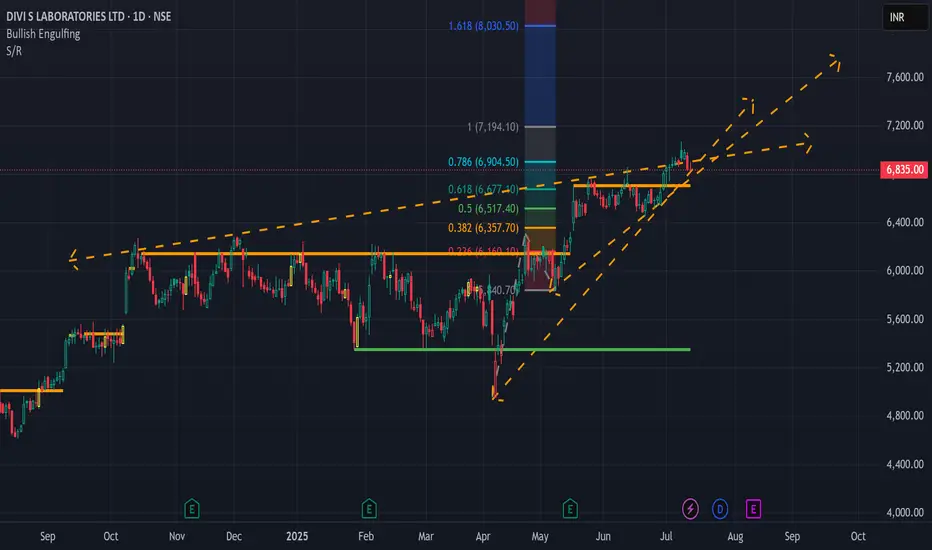
Current Trend is Bullish but as per Elliott wave theory it might have ABC correction which can reject from 1.618 or its extended 1-2-3-4-5 wave Structure.

DIVISLAB--Head & Shoulders pattern??Head and shoulders pattern is identified in this stock.
price is now near to Neckline.
on bottom we have a strong support lies at 3400 levels,
if price breaks neckline we have a support lies at 3400.
keep in long side from support levels,
if neckline failed to push the price downside we have a continuation from this support levels.

DIVISLAB - Elliott Wave CountDIVISLAB - Elliott Wave Count
It appears that Divislab is in wave C and to reach to or below 3400 in the coming days. Then we can see a good impulse wave towards 4000 and beyond. Please note that we have placed our stop loss at the level of 3250. This means that if the price drops below this point, we will exit the long position.
Please note that this information is for educational purposes only, and it is crucial to trade with caution.
NSE:DIVISLAB NSE:DIVISLAB1! BSE:DIVISLAB

DIVISLAB--Near to its Resistance zone??Showing strong bullish pressure...
this may be the end of bullishness or initiation of large quantity on buy side...
keep on buy side until the resistance zone...
if breaks will get more points.

DIVISLAB Analysistrendline is broken and retested price is moving up....
now price exactly at its previous supply zone....
we have to look if its break or not....
we have a strong support in the range as demand zone...
In daily time frame still not at reached the supply zone...but in weekly it reached...
we have a trendline support as well in daily time frame...please be on the buyside...
if suddenly price falls below the trendline also don't go for sell, small demand will again push it upside...

Big fall seen on divislab chart Divislab continue create and range and given range break down similarly that same range created which show any time that go down and sharp down

Divis Laboratories Ltd Technical Analysis Indian Stocks Market Divis Laboratories Ltd Technical Analysis Indian Stocks Market
Divis Laboratories is engaged in the manufacture of Active Pharmaceutical ingredients (APIs), Intermediates and Nutraceutical ingredients with predominance in exports. In addition to generic business, the company, through its Custom synthesis business, supports innovator pharma companies for their patented products business right from gram scale requirements for clinical trials to launch as well as late life cycle management.
