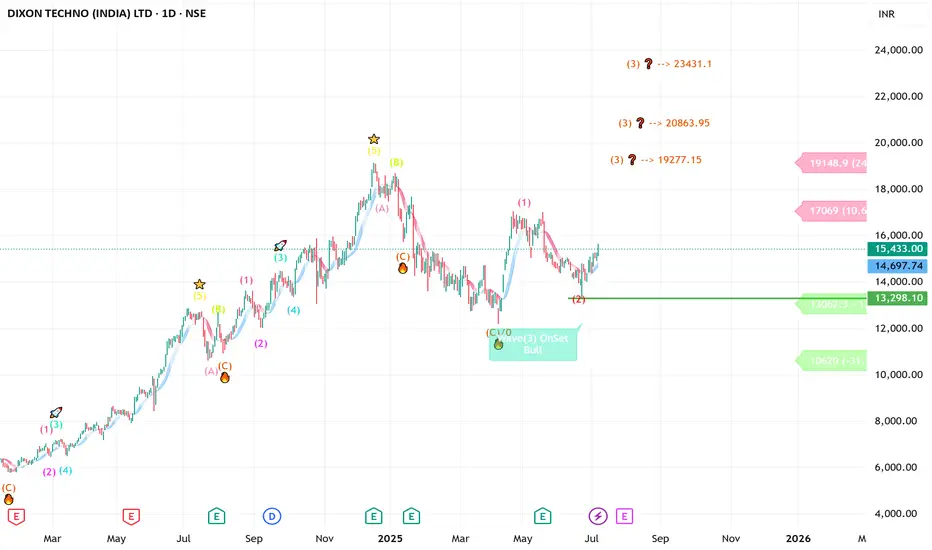
DIXON -----Daily counts Fresh Implus start anytime -UpsideDIXON -----Daily counts indicate Excellent bullish wave structure.
Both appear to be optimistic and this stock invalidation number wave 2 low
target short / long term are already shared as per charts
correction wave leg seems completed
Investing in declines is a smart move for short/ long-term players.
Buy in DIPS recommended
Long-term investors prepare for strong returns over the next two to five years.
one of best counter
Every graphic used to comprehend & LEARN & understand the theory of Elliot waves, Harmonic waves, Gann Theory, and Time theory
Every chart is for educational purposes.
We have no accountability for your profit or loss.
Dixontech
Red Alert in DixonPls check the structure of the market in regard to Dixon Tech.
I feel its going to break badly.
No buy/sell recommendation its just an opinion.
Regards

Dixon's Bearish Breakdown – All Targets Smashed!DIXON Stock Technical Analysis:
In the 15-minute timeframe, Dixon saw a short trade entry at ₹15,199.60, with prices moving decisively lower, hitting all the predefined targets.
Key Levels:
Entry: ₹15,199.60
Stop Loss (SL): ₹15,349.80
Target 1 (TP1): ₹15,013.95
Target 2 (TP2): ₹14,713.50
Target 3 (TP3): ₹14,413.10
Target 4 (TP4): ₹14,227.45
Observations:
The price plunged after a clear rejection below the Risological dotted trendline, confirming the downtrend.
Dixon met all short targets as it continued its bearish trajectory.
This short trade capitalized on a strong breakdown, with all targets being successfully hit. Traders should remain cautious as the bearish momentum might be slowing down, offering potential reversal signals ahead.

Dixon Daily Trade: 350% Massive Growth SecuredWe entered a long position on Dixon at 3253.30, and the trade has seen a remarkable growth of 358.54% over 511 days. With all targets up to TP4 (5619.40) successfully achieved, the trailing stop is currently at 11,790 to protect and safeguard our profits. This trailing stop will ensure that gains are locked in if the price pulls back to this level.
Target Points Achieved:
TP 1: 3686.05
TP 2: 4386.35
TP 3: 5086.65
TP 4: 5619.40
Trailing Stop: 11,790
Stop Loss (SL): 2903.15
We’ll continue to hold the position as the price trends upward, while the trailing stop secures our profits.
This massive positional trade demonstrates the strength of the Risological swing trading indicator.
Another killer trade caught!

Dixon Technologies Share Price Movements with Wave TheorySynopsis of Dixon Technologies Share Price Movements with Wave Theory Correlation
The share price of Dixon Technologies has demonstrated significant fluctuations and growth over the past few years, aligning with the principles of Elliott Wave Theory. This theory suggests that market prices move in predictable wave patterns, typically consisting of five major waves followed by three corrective waves.
Miner Waves Analysis
Wave 1: Date: February 2020, Price: ₹919.45
Description : This initial upward movement marks the beginning of the bullish trend.
Wave 2: Date: March 2020, Price: ₹678.25
Description : A correction phase that follows the first wave, typically retracing a portion of Wave 1's gains.
Wave 3: Date: March 2021, Price: ₹4267.25
Description : Often the strongest and longest wave in the Elliott Wave sequence, Wave 3 represents a significant upward move.
Wave 4: Date: August 2021, Price: ₹4046.25
Description : Another corrective phase, Wave 4, generally retraces less than Wave 2. The target for Wave 4 typically aims to correct 38.2% to 50% of Wave 3, which aligns with the observed price movement.
Wave 5: Date: October 2021, Price: ₹5112.05
Description : The final wave in the primary bullish trend, Wave 5, usually completes the uptrend before a larger corrective phase begins.
Intermediate Waves Analysis
Intermediate Wave (1): Date: October 2021, Price: ₹5112.05
Description : This wave mirrors the final leg of the miner waves, marking the beginning of a new, larger wave cycle.
Intermediate Wave (2): Date: January 2023, Price: ₹2553
Description: A substantial correction that aligns with the typical Wave 2 pattern, correcting a significant portion of Wave (1).
Intermediate Wave (3): Date: July 2024, Price: ₹12879
Description : Following the principles of Elliott Wave Theory, Wave (3) in the intermediate cycle is expected to be the most powerful, reflecting a strong upward movement.
Intermediate Wave (4) Target: Target Price: ₹8900-₹9000
Description : Based on Elliott Wave Theory, Intermediate Wave (4) is projected to correct approximately 38.2% of Wave (3), targeting a price range of ₹8900-₹9000.
Conclusion
The share price movements of Dixon Technologies from February 2020 to July 2024 align well with Elliott Wave Theory. The price started at ₹919.45 and went through a series of upward and corrective waves, reflecting typical wave patterns. The miner waves demonstrated an initial uptrend followed by corrections, culminating in a peak at ₹5112.05. Subsequently, the intermediate waves exhibited a similar pattern, with a substantial correction followed by a strong upward wave, reaching ₹12879 in July 2024. The target for Intermediate Wave (4) is projected to be in the range of ₹8900-₹9000, based on a 38.2% retracement of Wave (3). This analysis confirms the applicability of wave theory to Dixon Technologies' share price movements, indicating predictable patterns in market behavior.
Disclaimer
It's important to note that investing in shares involves risks, and past performance is not indicative of future results. The information provided here is based on technical analysis and Elliott Wave Theory, which are tools used to analyze market trends but do not guarantee future outcomes. Investors should conduct their own research or consult with a financial advisor before making investment decisions.

DIXONthis stock breakout ATH level and retest that level TGT will be 1:4 Risk reward
and this is just for Educational purpose only

DIXON TECHNOLOGIES LEVELSHi, Here i am sharing you upcoming support and resistance of NSE:DIXON .
This is my personal analysis, only to learn stock market behavior. Thanks.

Dixon Tech is near BreakoutDixon Technologies is near Breakout with a good volume,
has made support and Resistance trendline
Buy Above 5630 and 1st target is 6000

DIXON TECHNOLOGY Elliott Wave AnalysisDIXON TECHNOLOGY
Dixon Technology Impulsive Movement: Dixon Technology has started an "impulsive movement upside," indicating that the stock's price has been rising in a strong and decisive manner.
Bottoming Out Near 2553: The stock reached a low point near 2553 on January 30, 2023. This low is referred to as the "bottoming out" point.
Intermediate Wave (2) : The low at 2553 is labeled as an "intermediate wave (2)," which suggests that it is part of a larger wave pattern. In Elliott Wave Theory, waves are labeled numerically and represent different degrees of price movement.
Leading Diagonal and Completed Waves: The stock's upward movement from the low at 2553 is described as starting with a leading diagonal in the internal wave 1. This is a specific pattern in Elliott Wave Theory. The stock has completed waves (i), (ii), (iii), and (iv), and is currently in the process of forming the (v) wave.
5th Wave: The analysis suggests that the stock is currently in the 5th wave, which is expected to consist of sub-waves labeled i, ii, iii, iv, and v. It is observed that waves i, ii, and iii of the (v) wave have already been completed.
Future Movement: Stock will continue its upward movement and complete waves iv and v of the 5th wave. It suggests that the target price for the stock's upward movement is 5138. However, before reaching this target, the stock may retrace back down to around 4504.
Disclaimer: The information provided is based on the interpretation of Elliott Wave Theory as described in the text. This analysis is for informational and educational purposes only and should not be considered as financial advice or a recommendation to buy, sell, or invest in any financial instrument, including stocks or securities. Market movements are influenced by a complex interplay of factors, and predictions based on technical analysis may not always accurately forecast future price movements. Trading and investing in financial markets carry risks, and it's important to conduct thorough research, consult with qualified financial professionals, and consider your own risk tolerance and investment goals before making any trading or investment decisions. The author and OpenAI do not assume any responsibility for financial decisions made based on the information provided in this response.

DIXON - Bullish Swing ReversalNSE: DIXON is closing with a bullish swing reversal candle supported with volumes.
Today's volumes and candlestick formation indicates strong demand and stock should move to previous swing highs in the coming days.
The stock has been moving along the horizontal support for the past few days which is indicating demand.
One can look for a 8% to 12% gain on deployed capital in this swing trade.
The view is to be discarded in the event of the stock breaking previous swing low.
#NSEindia #Trading #StockMarketindia #Tradingview #SwingTrade

Dixon Technology 1HRAccording to the DIXON Technology chart, it appears that the 5 waves of the 1 upside have been fully completed. Both the (a) and (b) waves have concluded in a downward direction, while the (c) wave is currently continuing its downward progression. There is hope that it will find support near the 61.8% retracement level, approximately at 2766, and subsequently proceed towards the 3rd wave.
Anticipated movement from the 2766 level indicates an expected rise to approximately 3667.
Regards
Pls like if you liked this analysis.


Dixon TechnologiesPrice under extreme consolidation. Waiting for RSI to cross 60 to initiate Long. This is for education idea and not a trading advice. Consult your financial advisor to take a position.

{ DIXON } : {ONE LAST BUY FOR THE TREND!!! 1:5}
Price has confirmed an Uptrnd by violating a Potential Supply formed in 4H chart, then formed this Fresh Demand Zone.
Which defines the Reward to Risk Ratio of 5:1, till Price reaches the Fresh Quarterly Supply, Price shoould STRONGLY DECLINE after the Target of BUY Trade is achieved.
CHEERRRRRSSSSS!!!!! ENJOY THE RIDE !!!

Dixon Tech - Technical bounceDixon Tech - Technical bounce -
Showing technical bounce. Once can wait for 0.5 / 0.6 retracement level for shorting
or
break of recent low 2900 approx.
Stock is in bearish zone.
PS : This is not a recommendation or advisory. Please consult your financial advisor before taking position.

DIXON Buy Idea 22.01.2023NSE:DIXON is trading at demand price. My idea is to take entry at level of 3501 with stop loss of 3400 (-100 Points risk). My expected up side target will be 3760.00
Note: This is my personal analysis, only for learning. Thanks.

DIXON TECHNOLOGIESDIXON TECHNOLOGIES
DIXON TECHNOLOGIES is forming a good pattern, there is a good accumulation happening at current levels.
DIXON TECHNOLOGIES is Symmetrical chart pattern breakout wait for entry about of confirmation candle.
This channel is for only educational purpose. Any Profit/loss, I am not responsible.
Sector: Electronic Technology
Industry: Electronic Production Equipment

Dixon Technologies: Soon to breakout!Dixon Technologies is a strong candidate for a potential breakout. Keep it on your radar. #dixon #breakoutstocks #bullish

Dixon Technologies - Keep an Eye 📊 Script: DIXON (DIXON TECHNOLOGIES (INDIA) LIMITED)
📊 Nifty50 Stock: NO
📊 Sectoral Index: NIFTY 500, NIFTY INDIA CONSUMPTION, NIFTY MIDCAP
📊 Sector: Consumer Durables
📊 Industry: Consumer Electronics
Key highlights: 💡⚡
📈 Script is trading at upper band of Bollinger Bands (BB) and giving breakout of it.
📈 Crossover in MACD .
📈 Already Crossover in Double Moving Averages.
📈 Volume is increasing along with price.
📈 Script is moving towards resistance level which is around 4659 if script is breaking its resistance level it may go up.
📈 Current RSI is around 77.
📈 One can go for Swing Trade for around 120 points.
⏱️ C.M.P 📑💰- 4540
🟢 Target 🎯🏆 - 4659
⚠️ Important: Always maintain your Risk & Reward Ratio.
✅Like and follow to never miss a new idea!✅
Disclaimer: I am not SEBI Registered Advisor. My posts are purely for training and educational purposes.
Eat🍜 Sleep😴 TradingView📈 Repeat 🔁
Happy learning with trading. Cheers!🥂

Dixon in symmetrical triangleFrom 19th October the stock has been consolidating in a symmetrical triangle pattern.
It is near its support.
Wait for the confirmation before entering inro the stock.
Nearly 3 months of consolidation has been there.
Once the stock price leaves the consolidation phase it can give a good moment either side.

DIXON Daily Time Frame AnalysisDIXON Daily Time Frame Analysis
SO given a good breakout with a good volume
- If it continues it rally we can see 5500-5800-6000 within next few sessions
- But may consolidate it is good as long as it is above 5000
-Green Candle are Resistance
-Yellow are support
Let's see where it goes
*Just m views not an investment advice*

Dixon TechDixon Tech
CMP - 4380 good support
Can enter at current levels 4380
1st Target - 4480
2nd Target - 4717
Positive: Above 50 MA
RSI - 59 Good
Daily MACD - uptrend
Alert: if it drops then we might see a fall till 3964
My suggestion - Enter at CMP or buy on dips

