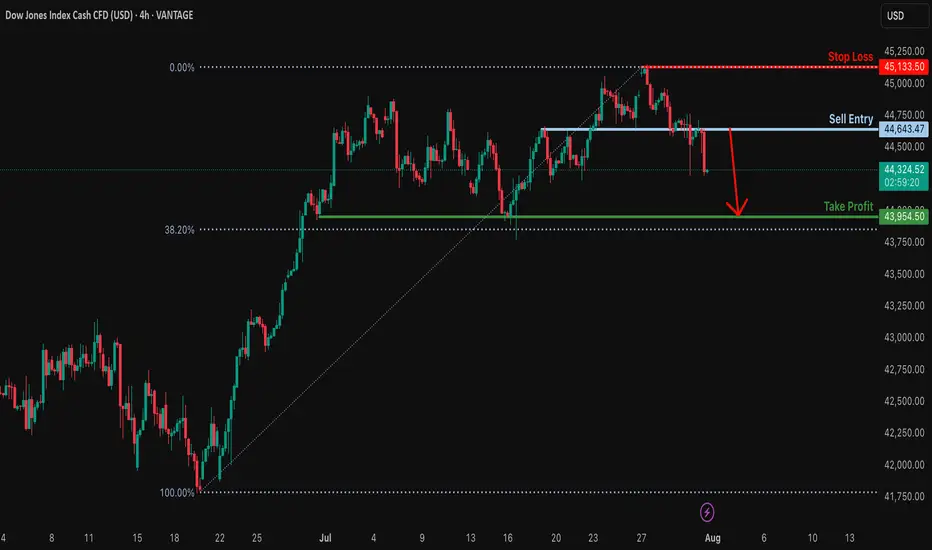
Potential bearish drop?Dow Jones (DJ30) has reacted off the resistance level which is an overlap resitance and could drop from this levle ot our takeprofit.
Entry: 44,643.47
Why we like it:
There is an overlap resistance levle.
Stop loss: 45,133.50
Why we like it:
There is a swing high resistance.
Take profit: 43,954.50
Why we like it:
There is a multi swing low support.
Enjoying your TradingView experience? Review us!
Please be advised that the information presented on TradingView is provided to Vantage (‘Vantage Global Limited’, ‘we’) by a third-party provider (‘Everest Fortune Group’). Please be reminded that you are solely responsible for the trading decisions on your account. There is a very high degree of risk involved in trading. Any information and/or content is intended entirely for research, educational and informational purposes only and does not constitute investment or consultation advice or investment strategy. The information is not tailored to the investment needs of any specific person and therefore does not involve a consideration of any of the investment objectives, financial situation or needs of any viewer that may receive it. Kindly also note that past performance is not a reliable indicator of future results. Actual results may differ materially from those anticipated in forward-looking or past performance statements. We assume no liability as to the accuracy or completeness of any of the information and/or content provided herein and the Company cannot be held responsible for any omission, mistake nor for any loss or damage including without limitation to any loss of profit which may arise from reliance on any information supplied by Everest Fortune Group.
Dj30
Bullish momentum to extend?DJ30 is falling towards the support level which is a pullback support and could bounce from this level to our take profit.
Entry: 42,853.55
Why we like it:
There is a pullback support level.
Stop loss: 41,577.28
Why we like it:
There is a pullback support level.
Take profit: 45,132.60
Why we like it:
There is a pullback resistance that lines up with the 61.8% Fibonacci projection.
Enjoying your TradingView experience? Review us!
Please be advised that the information presented on TradingView is provided to Vantage (‘Vantage Global Limited’, ‘we’) by a third-party provider (‘Everest Fortune Group’). Please be reminded that you are solely responsible for the trading decisions on your account. There is a very high degree of risk involved in trading. Any information and/or content is intended entirely for research, educational and informational purposes only and does not constitute investment or consultation advice or investment strategy. The information is not tailored to the investment needs of any specific person and therefore does not involve a consideration of any of the investment objectives, financial situation or needs of any viewer that may receive it. Kindly also note that past performance is not a reliable indicator of future results. Actual results may differ materially from those anticipated in forward-looking or past performance statements. We assume no liability as to the accuracy or completeness of any of the information and/or content provided herein and the Company cannot be held responsible for any omission, mistake nor for any loss or damage including without limitation to any loss of profit which may arise from reliance on any information supplied by Everest Fortune Group.

Dow Jones Gains on Rate Cut Hopes and Ceasefire Relief US30 OVERVIEW
Wall Street Rises on Fed Rate Cut Hopes and Geopolitical De-escalation
The Dow Jones (US30) remains under bullish pressure, supported by rising expectations of a Federal Reserve rate cut later this year and a ceasefire agreement between Iran and Israel, which has eased market tensions.
TECHNICAL OUTLOOK – US30
The price maintains a bullish bias as long as it trades above the pivot level at 42,810, with upside potential toward the key resistance at 43,210.
A short-term bearish correction is possible toward 42,810 or even 42,670, but the broader structure remains bullish above these levels.
Resistance Levels: 43,060 → 43,210 → 43,350
Support Levels: 42,670 → 42,420 → 42,160
A sustained break below 42,670 could signal deeper correction, while a clear move above 43,210 would confirm continued bullish momentum.

Bullish continuation?Dow Jones (DJ30) is falling towards the support level which is an overlap support and could bounce from this level to our take profit.
Entry: 42,431.21
Why we like it:
There is an overlap support level.
Stop loss: 41,768.34
Why we like it:
There is a pullback support level.
Take profit: 43,934.49
Why we like it:
There is a pullback resistance level
Enjoying your TradingView experience? Review us!
Please be advised that the information presented on TradingView is provided to Vantage (‘Vantage Global Limited’, ‘we’) by a third-party provider (‘Everest Fortune Group’). Please be reminded that you are solely responsible for the trading decisions on your account. There is a very high degree of risk involved in trading. Any information and/or content is intended entirely for research, educational and informational purposes only and does not constitute investment or consultation advice or investment strategy. The information is not tailored to the investment needs of any specific person and therefore does not involve a consideration of any of the investment objectives, financial situation or needs of any viewer that may receive it. Kindly also note that past performance is not a reliable indicator of future results. Actual results may differ materially from those anticipated in forward-looking or past performance statements. We assume no liability as to the accuracy or completeness of any of the information and/or content provided herein and the Company cannot be held responsible for any omission, mistake nor for any loss or damage including without limitation to any loss of profit which may arise from reliance on any information supplied by Everest Fortune Group.

US30/DJI "Dow Jones" Index CFD Market Heist Plan (Day or Swing)🌟Hi! Hola! Ola! Bonjour! Hallo! Marhaba!🌟
Dear Money Makers & Robbers, 🤑💰✈️
Based on 🔥Thief Trading style technical and fundamental analysis🔥, here is our master plan to heist the US30/DJI "Dow Jones" Index CFD Market. Please adhere to the strategy I've outlined in the chart, which emphasizes short entry. Our aim is the high-risk Yellow MA Zone. Risky level, oversold market, consolidation, trend reversal, trap at the level where traders and bullish robbers are stronger. 🏆💸"Take profit and treat yourself, traders. You deserve it!💪🏆🎉
Entry 📈 : "The vault is wide open! Swipe the Bearish loot at any price - the heist is on!
however I advise to Place sell limit orders within a 15 or 30 minute timeframe most nearest or swing, low or high level for Pullback Entries.
Stop Loss 🛑:
📌Thief SL placed at the nearest/swing High or Low level Using the 1D timeframe (41000) Day/Swing trade basis.
📌SL is based on your risk of the trade, lot size and how many multiple orders you have to take.
Target 🎯: 35000 (or) Escape Before the Target
💰💵💸US30/DJI "Dow Jones" Index CFD Market Heist Plan (Swing/Day Trade) is currently experiencing a Bearish trend.., driven by several key factors.👇👇👇
📰🗞️Get & Read the Fundamental, Macro, COT Report, Geopolitical and News Analysis, Sentimental Outlook, Intermarket Analysis, Index-Specific Analysis, Future trend targets with Overall outlook score... go ahead to check 👉👉👉🔗🔗
⚠️Trading Alert : News Releases and Position Management 📰 🗞️ 🚫🚏
As a reminder, news releases can have a significant impact on market prices and volatility. To minimize potential losses and protect your running positions,
we recommend the following:
Avoid taking new trades during news releases
Use trailing stop-loss orders to protect your running positions and lock in profits
💖Supporting our robbery plan 💥Hit the Boost Button💥 will enable us to effortlessly make and steal money 💰💵. Boost the strength of our robbery team. Every day in this market make money with ease by using the Thief Trading Style.🏆💪🤝❤️🎉🚀
I'll see you soon with another heist plan, so stay tuned 🤑🐱👤🤗🤩

Potential bearish drop?DJ30 is reacting off the support level which is an overlap support and could drop from this level to our take profit.
Entry: 39,332.63
Why we like it:
There is an overlap support level.
Stop loss: 40,743.45
Why we like it:
There is an overlap resistance level.
Take profit: 37,047.85
Why we like it:
There is a pullback support level that is slightly below the 61.8% Fibonacci projection.
Enjoying your TradingView experience? Review us!
Please be advised that the information presented on TradingView is provided to Vantage (‘Vantage Global Limited’, ‘we’) by a third-party provider (‘Everest Fortune Group’). Please be reminded that you are solely responsible for the trading decisions on your account. There is a very high degree of risk involved in trading. Any information and/or content is intended entirely for research, educational and informational purposes only and does not constitute investment or consultation advice or investment strategy. The information is not tailored to the investment needs of any specific person and therefore does not involve a consideration of any of the investment objectives, financial situation or needs of any viewer that may receive it. Kindly also note that past performance is not a reliable indicator of future results. Actual results may differ materially from those anticipated in forward-looking or past performance statements. We assume no liability as to the accuracy or completeness of any of the information and/or content provided herein and the Company cannot be held responsible for any omission, mistake nor for any loss or damage including without limitation to any loss of profit which may arise from reliance on any information supplied by Everest Fortune Group.

Falling towards 61.8% Fibonacci support?DJ30 is falling towards the support level which is a pullback support that lines up with the 61.8% Fibonacci retracement and could bounce from this level to our take profit.
Entry: 37,602.11
Why we like it:
There is a pullback support level that lines up with the 61.8% Fibonacci retracement.
Stop loss: 36,538.75
Why we like it:
There is a pullback support level.
Take profit: 39,559.66
Why we like it:
There is a pullback resistance level that lines up with the 50% Fibonacci retracement.
Enjoying your TradingView experience? Review us!
Please be advised that the information presented on TradingView is provided to Vantage (‘Vantage Global Limited’, ‘we’) by a third-party provider (‘Everest Fortune Group’). Please be reminded that you are solely responsible for the trading decisions on your account. There is a very high degree of risk involved in trading. Any information and/or content is intended entirely for research, educational and informational purposes only and does not constitute investment or consultation advice or investment strategy. The information is not tailored to the investment needs of any specific person and therefore does not involve a consideration of any of the investment objectives, financial situation or needs of any viewer that may receive it. Kindly also note that past performance is not a reliable indicator of future results. Actual results may differ materially from those anticipated in forward-looking or past performance statements. We assume no liability as to the accuracy or completeness of any of the information and/or content provided herein and the Company cannot be held responsible for any omission, mistake nor for any loss or damage including without limitation to any loss of profit which may arise from reliance on any information supplied by Everest Fortune Group.

Sharp reversal in US marketsAmid market volatility and uncertainty, US stock indices experienced a sharp decline last week. The Dow Jones Index (#DJI30) fell by 3.5%, the S&P 500 (#SP500) dropped by 4.1%, and the Nasdaq-100 (#NQ100) lost 5.5%.
Investors reacted nervously to new economic data, including rising inflation and expectations of interest rate hikes, leading to a sell-off in stocks and a decline in key indices. The drop was particularly significant in the technology and consumer sectors, where companies like Apple and Tesla lost around 6-7% of their value.
However, starting March 13, 2025, the indices began to recover: #DJI30 gained 2.3%, #SP500 rose by 2.5%, and #NQ100 increased by 3.1%.
The recent rebound in US stock indices has been driven by several factors that restored investor confidence. Let’s take a closer look at the main reasons:
• Improvement in unemployment data: Labor market statistics played a crucial role in the market recovery. The US unemployment rate fell to 3.4% in February 2025, marking a record low in recent decades. This indicates strong employment levels and economic resilience, boosting investor optimism and supporting stock market growth.
• Stabilization of inflation and interest rate expectations: Although inflation in the US remains high, recent data showed a slowdown in its growth. Reduced inflationary pressure gave investors hope that the Federal Reserve (Fed) might slow down the pace of interest rate hikes. This was perceived as a sign of potential economic stabilization, positively impacting stock indices.
• Growth in consumer spending: One of the key drivers of the recent market recovery has been the increase in consumer spending. In Q1 2025, consumer demand in the US showed strong performance, serving as an essential indicator of economic activity. Increased spending on goods and services supports business stability and enhances corporate revenues, which, in turn, stimulates stock growth.
• Absence of new geopolitical risks: In recent weeks, there have been no major geopolitical crises or new threats on the international stage. This helped financial markets stabilize, as investors could focus on economic data and corporate earnings reports, contributing to stock index growth.
• Positive corporate earnings reports:
• #Microsoft (MSFT): Microsoft shares rose by 4.2% after reporting strong quarterly results, driven by growth in cloud services and software revenue.
• #Google (GOOGL): Alphabet’s stock increased by 3.7% due to higher advertising revenue and improved forecasts for upcoming quarters.
• #Apple (AAPL): Apple shares climbed 2.9%, supported by strong sales of new products and rising revenue from services.
• #Tesla (TSLA): Tesla stock surged 5.6%, fueled by strong electric vehicle sales growth and optimistic profit projections for the next quarter.
These companies demonstrated significant growth on the back of improved financial performance, strengthening investor confidence and aiding the stock market’s recovery amid volatility.
So despite last week’s market downturn, the current situation in the US stock market signals a potential recovery and a more positive trend in the coming weeks.

Short position on the Dow Jones indexI think this is the best situation for Dow Jones, After the break of the daily trend, the price returns to the previous ceiling and the inability to break the floor, strong bearish candles, in my opinion, indicate a decline.

Dow Jones: Neutrality Strengthens Around 44,000 PointsThe Dow Jones Industrial Average has fluctuated within a 1% range over the past few trading sessions, encountering a neutral barrier near the 44,000-point zone.
For now, investors remain cautious as uncertainty grows amid trade and diplomatic tensions from the White House with multiple countries. This prolonged uncertainty has reinforced a neutral bias in recent price movements.
Persistent Neutrality
Currently, the Dow Jones remains trapped in a sideways range, with:
45,000 resistance at the upper boundary.
42,300 support at the lower boundary.
The price remains in the middle of this range, reinforcing the market’s indecision. As long as price action stays within this zone, the neutral structure may extend further in the coming sessions.
MACD Indicator
MACD movements confirm the current neutral market outlook. Both the MACD line and signal line remain oscillating near the 0 neutral zone.
The histogram also remains close to 0, indicating low momentum. As long as these conditions persist, price neutrality is likely to continue in the coming sessions.
Key Levels to Watch:
45,000 – Key Resistance:
Upper boundary of the sideways range.
A breakout above this level could mark new highs, potentially reviving the long-term uptrend that has been stagnant in recent weeks.
43,000 – Neutral Zone:
Converges with the 50-period and 100-period moving averages.
Also aligns with the 38.2% Fibonacci retracement level.
The most important short-term barrier that could limit any short-term bullish attempt.
If price fails to reclaim this level, bearish momentum could grow.
42,000 – Critical Support:
Lower boundary of the sideways channel. A break below this level could create a stronger bearish bias, potentially threatening the long-term uptrend that has been in place since last year.
By Julian Pineda, CFA – Market Analyst

Where is the Indices going and Bitcoin? This is my opinion of what I think will happen in March after February sell off. I have bullish bias for both indices and Bitcoin as long as 80K Level stays intact in case of BTC.
Also RSI and Volume divergence can be seen for extra confirmation
Disclaimer: Not a financial advice. Do your own analysis

"US30/DJ30" Indices CFD Market Bearish Heist Plan🌟Hi! Hola! Ola! Bonjour! Hallo!🌟
Dear Money Makers & Robbers, 🤑 💰🐱👤🐱🏍
Based on 🔥Thief Trading style technical and fundamental analysis🔥, here is our master plan to heist the "US30/DJ30" Indices CFD Market. Please adhere to the strategy I've outlined in the chart, which emphasizes short entry. Our aim is the high-risk Green Zone. Risky level, oversold market, consolidation, trend reversal, trap at the level where traders and bullish thieves are getting stronger. 🏆💸Book Profits Be wealthy and safe trade.💪🏆🎉
Entry 📈 : "The heist is on! Wait for the breakout (44,000.0) then make your move - Bearish profits await!"
however I advise placing Sell Stop Orders below the breakout MA or Place Sell limit orders within a 15 or 30 minute timeframe. Entry from the most recent or closest low or high level should be in retest.
Stop Loss 🛑: Thief SL placed at 44,600.0 (swing Trade Basis) Using the 4H period, the recent / swing high or low level.
SL is based on your risk of the trade, lot size and how many multiple orders you have to take.
Target 🎯: 43,000.0 (or) Escape Before the Target
🧲Scalpers, take note 👀 : only scalp on the Short side. If you have a lot of money, you can go straight away; if not, you can join swing traders and carry out the robbery plan. Use trailing SL to safeguard your money 💰.
📰🗞️Fundamental, Macro, COT, Sentimental Outlook:
"US30/DJ30" Indices CFD Market is currently experiencing a Bearish trend., driven by several key factors.
⚪Fundamental Analysis
The US30 index is influenced by the overall performance of the US economy, including GDP growth rate, inflation, and interest rates. Currently, the US economy is experiencing a moderate growth rate, with a slight increase in inflation.
🔴Macroeconomic Analysis
The Federal Reserve has maintained a hawkish stance, with interest rates expected to remain high in the short term. This has led to a strengthening of the US dollar, which may impact the US30 index.
🟢COT Data Analysis
The Commitments of Traders (COT) report shows that commercial traders are net short, while non-commercial traders are net long. This indicates a potential trend reversal.
🟡Sentimental Analysis
Market sentiment is slightly bearish, with 55% of traders holding short positions.
🟤Positioning Data Analysis
Institutional traders are holding short positions, while corporate traders are holding long positions. Banks are maintaining a bearish stance.
🔵Market Sentiment
- Institutional Traders: 60% bearish, 40% bullish
- Hedge Funds: 70% bearish, 30% bullish
- Retail Traders: 55% bullish, 45% bearish
🟣Overall Outlook
The US30 index is expected to remain volatile in the short term, with a slight bearish bias due to the hawkish stance of the Federal Reserve. However, the index's movement will largely depend on the overall performance of the US economy and global economic trends.
⚠️Trading Alert : News Releases and Position Management 📰 🗞️ 🚫🚏
As a reminder, news releases can have a significant impact on market prices and volatility. To minimize potential losses and protect your running positions,
we recommend the following:
Avoid taking new trades during news releases
Use trailing stop-loss orders to protect your running positions and lock in profits
📌Please note that this is a general analysis and not personalized investment advice. It's essential to consider your own risk tolerance and market analysis before making any investment decisions.
📌Keep in mind that these factors can change rapidly, and it's essential to stay up-to-date with market developments and adjust your analysis accordingly.
💖Supporting our robbery plan will enable us to effortlessly make and steal money 💰💵 Tell your friends, Colleagues and family to follow, like, and share. Boost the strength of our robbery team. Every day in this market make money with ease by using the Thief Trading Style.🏆💪🤝❤️🎉🚀
I'll see you soon with another heist plan, so stay tuned 🤑🐱👤🤗🤩

US30/DJ30 "Dow Jones Industrial Average" Indices Heist Plan🌟Hi! Hola! Ola! Bonjour! Hallo!🌟
Dear Money Makers & Robbers, 🤑 💰
Based on 🔥Thief Trading style technical and fundamental analysis🔥, here is our master plan to heist the US30 / DJ30 "Dow Jones Industrial Average" Indices market. Please adhere to the strategy I've outlined in the chart, which emphasizes long entry and short entry. 🏆💸Be wealthy and safe trade.💪🏆🎉
Entry 📈 :
"The loot's within reach! Wait for the breakout, then grab your share - whether you're a Bullish thief or a Bearish bandit!"
Buy entry above 44,660.0
Sell Entry below 43,800.0
Stop Loss 🛑:
Thief SL placed at 44,100.0 (swing Trade) for Bullish Trade
Thief SL placed at 44,100.0 (swing Trade) for Bearish Trade
Using the 2H period, the recent / nearest low or high level.
SL is based on your risk of the trade, lot size and how many multiple orders you have to take.
Target 🎯:
-Bullish Robbers TP 46,200.0 (or) Escape Before the Target
-Bearish Robbers TP 42,600.0 (or) Escape Before the Target
📰🗞️Fundamental, Macro, COT, Sentimental Outlook:
US30 / DJ30 "Dow Jones Industrial Average" Indices market is currently experiencing a Neutral trend (there is a higher chance for Bullish)., driven by several key factors.
🟣 Fundamental Analysis
- Earnings Growth: The Dow Jones 30 (DJ30) companies have reported strong earnings growth, with an average increase of 10% in the last quarter.
- Dividend Yield: The DJ30 has a dividend yield of 2.1%, which is relatively attractive compared to other asset classes.
- Valuation: The DJ30 is trading at a price-to-earnings (P/E) ratio of 18.5, which is slightly above its historical average.
⚪ Macro Analysis
- Interest Rates: The US Federal Reserve has kept interest rates steady, which is positive for equities.
- Inflation: Inflation remains under control, with the Consumer Price Index (CPI) increasing by 2.3% in the last year.
- GDP Growth: The US GDP growth rate is expected to slow down to 2.1% in 2023, which is still positive for equities.
🔴 Sentimental Analysis
- Trader Sentiment: 55% of traders are bullish on DJ30, while 30% are bearish and 15% are neutral.
- Investor Sentiment: The AAII Investor Sentiment Survey shows that 44.5% of investors are bullish, while 24.5% are bearish.
- Hedge Fund Sentiment: Hedge funds have increased their long positions in DJ30, with a net long exposure of 25%.
🟠 COT Analysis
- Non-Commercial Traders: Net long 35,019 contracts (Increase of 5,011 contracts from last week)
- Commercial Traders: Net short 25,011 contracts (Decrease of 2,011 contracts from last week)
- Leverage: Average leverage used by traders is 8:1
🟡 Institutional Traders
- Goldman Sachs: Net long 20,109 contracts (Increase of 3,011 contracts from last week)
- Morgan Stanley: Net long 15,011 contracts (Decrease of 1,011 contracts from last week)
- JPMorgan Chase: Net long 18,011 contracts (Increase of 2,011 contracts from last week)
🟢 Hedge Funds
- Bridgewater Associates: Net long 30,109 contracts (Increase of 5,011 contracts from last week)
- BlackRock: Net long 25,011 contracts (Decrease of 2,011 contracts from last week)
- Vanguard: Net long 20,011 contracts (Increase of 3,011 contracts from last week)
🟤 Overall Outlook
Based on the analysis, the DJ30 (US30) is expected to move in a bullish trend, with a 60% chance of an uptrend and a 30% chance of a downtrend. The remaining 10% chance is for a neutral trend.
⚠️Trading Alert : News Releases and Position Management 📰 🗞️ 🚫🚏
As a reminder, news releases can have a significant impact on market prices and volatility. To minimize potential losses and protect your running positions,
we recommend the following:
Avoid taking new trades during news releases
Use trailing stop-loss orders to protect your running positions and lock in profits
📌Please note that this is a general analysis and not personalized investment advice. It's essential to consider your own risk tolerance and market analysis before making any investment decisions.
📌Keep in mind that these factors can change rapidly, and it's essential to stay up-to-date with market developments and adjust your analysis accordingly.
💖Supporting our robbery plan will enable us to effortlessly make and steal money 💰💵 Tell your friends, Colleagues and family to follow, like, and share. Boost the strength of our robbery team. Every day in this market make money with ease by using the Thief Trading Style.🏆💪🤝❤️🎉🚀
I'll see you soon with another heist plan, so stay tuned 🤗

Potential bearish drop?DJ30 is rising towards the resistance level that is an overlap resistance and could drop from this level to our take profit.
Entry: 44,603.74
Why we like it:
There is an overlap resistance level.
Stop loss: 45,112.98
Why we like it:
There is a pullback resistance level.
Take profit: 43,871.19
Why we like it:
There is an overlap support level.
Enjoying your TradingView experience? Review us!
Please be advised that the information presented on TradingView is provided to Vantage (‘Vantage Global Limited’, ‘we’) by a third-party provider (‘Everest Fortune Group’). Please be reminded that you are solely responsible for the trading decisions on your account. There is a very high degree of risk involved in trading. Any information and/or content is intended entirely for research, educational and informational purposes only and does not constitute investment or consultation advice or investment strategy. The information is not tailored to the investment needs of any specific person and therefore does not involve a consideration of any of the investment objectives, financial situation or needs of any viewer that may receive it. Kindly also note that past performance is not a reliable indicator of future results. Actual results may differ materially from those anticipated in forward-looking or past performance statements. We assume no liability as to the accuracy or completeness of any of the information and/or content provided herein and the Company cannot be held responsible for any omission, mistake nor for any loss or damage including without limitation to any loss of profit which may arise from reliance on any information supplied by Everest Fortune Group.

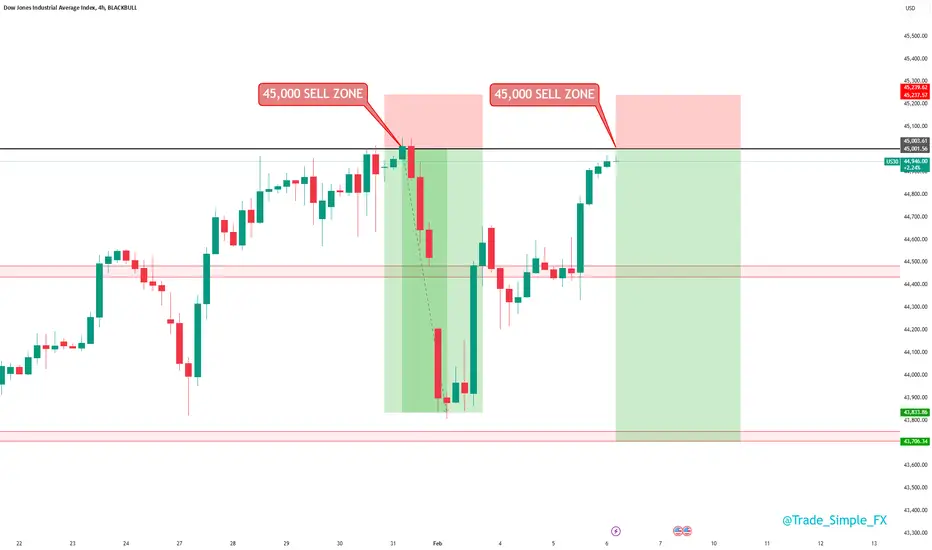
US30 H8 - Short SignalUS30 H8
We are yet again approaching that key psychological price level, 45,000 coming into play. We are very close currently, but alerts have been set. Last time this setup came into this 45,000 territory, we sold off an attractive 5R.
Looking to see if this setup can offer something similar again, we would love to see price trade closer to 44,000 this time round.
Potential bearish drop?DJ30 is reacting off the support level which is an overlap support that is slightly above the 50% Fibonacci retracement. A breakout of this level could lead the price to drop to our take profit.
Entry: 44,553.18
Why we like it:
There is an overlap support level that is slightly above the 50% Fibonacci retracement.
Stop loss: 45,112.98
Why we like it:
There is a pullback resistance level.
Take profit: 44,041.83
Why we like it:
There is a pullback support level.
Enjoying your TradingView experience? Review us!
Please be advised that the information presented on TradingView is provided to Vantage (‘Vantage Global Limited’, ‘we’) by a third-party provider (‘Everest Fortune Group’). Please be reminded that you are solely responsible for the trading decisions on your account. There is a very high degree of risk involved in trading. Any information and/or content is intended entirely for research, educational and informational purposes only and does not constitute investment or consultation advice or investment strategy. The information is not tailored to the investment needs of any specific person and therefore does not involve a consideration of any of the investment objectives, financial situation or needs of any viewer that may receive it. Kindly also note that past performance is not a reliable indicator of future results. Actual results may differ materially from those anticipated in forward-looking or past performance statements. We assume no liability as to the accuracy or completeness of any of the information and/or content provided herein and the Company cannot be held responsible for any omission, mistake nor for any loss or damage including without limitation to any loss of profit which may arise from reliance on any information supplied by Everest Fortune Group.

Dow Jones Trading IdeaBased on Simple Technical Analysis ( Trendline + Support & Resistance )
Risk Disclaimer:
Please be advised that I am not telling anyone how to spend or invest their money. Take all of my analysis as my own opinion, as entertainment, and at your own risk. I assume no responsibility or liability for any errors or omissions in the content of this page, and they are for educational purposes only. Any action you take on the information in this analysis is strictly at your own risk. There is a very high degree of risk involved in trading. Past results are not indicative of future returns. Good luck :-)

Bullish momentum to extend?DJ30 is falling towards the support level which is a pullback support that is slightly below the 23.6% Fibonacci retracement and could bounce from this level to our take profit.
Entry: 43,850.12
Why we like it:
There is a pullback support level that is slightly below the 23.6% Fibonacci retracement.
Stop loss: 43,383.26
Why we like it:
There is an overlap support level that is slightly below the 38.2% Fibonacci retracement.
Take profit: 44,606.77
Why we like it:
There is a pullback resistance level.
Enjoying your TradingView experience? Review us!
Please be advised that the information presented on TradingView is provided to Vantage (‘Vantage Global Limited’, ‘we’) by a third-party provider (‘Everest Fortune Group’). Please be reminded that you are solely responsible for the trading decisions on your account. There is a very high degree of risk involved in trading. Any information and/or content is intended entirely for research, educational and informational purposes only and does not constitute investment or consultation advice or investment strategy. The information is not tailored to the investment needs of any specific person and therefore does not involve a consideration of any of the investment objectives, financial situation or needs of any viewer that may receive it. Kindly also note that past performance is not a reliable indicator of future results. Actual results may differ materially from those anticipated in forward-looking or past performance statements. We assume no liability as to the accuracy or completeness of any of the information and/or content provided herein and the Company cannot be held responsible for any omission, mistake nor for any loss or damage including without limitation to any loss of profit which may arise from reliance on any information supplied by Everest Fortune Group.

US30/DJ30 "DOW JONES INDUSTRIAL AVERAGE" Bullish Heist Plan🌟Hi! Hola! Ola! Bonjour! Hallo!🌟
Dear Money Makers & Robbers, 🤑 💰
Based on 🔥Thief Trading style technical and fundamental analysis🔥, here is our master plan to heist the US30/DJ30 "DOW JONES INDUSTRIAL AVERAGE" Indices market. Please adhere to the strategy I've outlined in the chart, which emphasizes long entry. Our aim is the high-risk Red Zone. Risky level, overbought market, consolidation, trend reversal, trap at the level where traders and bearish robbers are stronger. Be wealthy and safe trade.💪🏆🎉
Entry 📈 : You can enter a Bull trade at any point,
however I advise placing Buy limit orders within a 15 or 30 minute timeframe. Entry from the most recent or closest low or high level should be in retest.
Stop Loss 🛑: Using the 3h period, the recent / nearest low or high level.
Goal 🎯: 44600.0 (or) escape Before the Target.
Scalpers, take note 👀 : only scalp on the Long side. If you have a lot of money, you can go straight away; if not, you can join swing traders and carry out the robbery plan. Use trailing SL to safeguard your money 💰.
Warning⚠️ : Our heist strategy is incompatible with Fundamental Analysis news 📰 🗞️. We'll wreck our plan by smashing the Stop Loss 🚫🚏. Avoid entering the market right after the news release.
Fundamental Outlook 📰🗞️
The US30/DJ30, also known as the Dow Jones Industrial Average (DJIA), is a stock market index that represents the 30 largest and most widely traded companies in the US. The index is a widely followed benchmark for the overall health of the US stock market.
CURRENT MARKET SENTIMENT:
The current market sentiment for the US30/DJ30 is bullish, with the index trading near its all-time highs. The US economy is strong, with low unemployment and steady GDP growth. However, there are concerns about the impact of trade tensions and rising interest rates on the economy.
UPCOMING NEWS:
US GDP Growth Rate: The US GDP growth rate for the second quarter is expected to be released on Friday, with expectations of a 2.0% growth rate.
US Non-Farm Payrolls: The US non-farm payrolls for July are expected to be released on Friday, with expectations of 180,000 new jobs added.
US Unemployment Rate: The US unemployment rate for July is expected to be released on Friday, with expectations of a 3.6% unemployment rate.
Federal Reserve Interest Rate Decision: The Federal Reserve is expected to announce its interest rate decision on Wednesday, with expectations of a 25 basis point rate cut.
Strong US Economy:
Low unemployment rate
Steady GDP growth
Increase in consumer spending
Improvement in business confidence
Monetary Policy:
Federal Reserve adopts a dovish tone
Interest rates are cut or remain low
Increase in money supply
Stimulative monetary policy
Fiscal Policy:
Government implements expansionary fiscal policies
Increase in government spending
Tax cuts or reductions
Infrastructure investments
Earnings Growth:
Strong corporate earnings growth
Increase in revenue and profitability
Positive guidance from companies
Beat of analyst estimates
Valuations:
Attractive valuations compared to historical averages
Low price-to-earnings ratio
High dividend yield
Undervalued stocks
Technical Indicators:
MACD line crosses above the signal line
RSI (14) falls below 30 and then rises back above it
50-period Moving Average (MA) crosses above the 200-period MA
Price closes above the 50-period MA
Bullish chart patterns, such as a head and shoulders or a inverse head and shoulders
Sentiment Analysis:
Bullish sentiment among traders and investors
Increase in long positions
Decrease in short positions
Put-call ratio falls below 1.0
Please note that this is a general analysis and not personalized investment advice. It's essential to consider your own risk tolerance and market analysis before making any investment decisions.
Take advantage of the target and get away 🎯 Swing Traders Please reserve the half amount of money and watch for the next dynamic level or order block breakout. Once it is resolved, we can go on to the next new target in our heist plan.
Keep in mind that these factors can change rapidly, and it's essential to stay up-to-date with market developments and adjust your analysis accordingly.
💖Supporting our robbery plan will enable us to effortlessly make and steal money 💰💵 Tell your friends, Colleagues and family to follow, like, and share. Boost the strength of our robbery team. Every day in this market make money with ease by using the Thief Trading Style.🏆💪🤝❤️🎉🚀
I'll see you soon with another heist plan, so stay tuned 🫂

Bearish drop off pullback resistance?DJ30 is rising towards the resistance level which is a pullback resistance that aligns with the 50% Fibonacci retracement and could drop from this level to our take profit.
Entry: 42,400.11
Why we like it:
There is a pullback resistance level that aligns with the 50% Fibonacci retracement.
Stop loss: 42,712.31
Why we like it:
There is a pullback resistance level that is slightly above the 61.8% Fibonacci retracement.
Take profit: 41,786.49
Why we like it:
There is a pullback support level.
Enjoying your TradingView experience? Review us!
Please be advised that the information presented on TradingView is provided to Vantage (‘Vantage Global Limited’, ‘we’) by a third-party provider (‘Everest Fortune Group’). Please be reminded that you are solely responsible for the trading decisions on your account. There is a very high degree of risk involved in trading. Any information and/or content is intended entirely for research, educational and informational purposes only and does not constitute investment or consultation advice or investment strategy. The information is not tailored to the investment needs of any specific person and therefore does not involve a consideration of any of the investment objectives, financial situation or needs of any viewer that may receive it. Kindly also note that past performance is not a reliable indicator of future results. Actual results may differ materially from those anticipated in forward-looking or past performance statements. We assume no liability as to the accuracy or completeness of any of the information and/or content provided herein and the Company cannot be held responsible for any omission, mistake nor for any loss or damage including without limitation to any loss of profit which may arise from reliance on any information supplied by Everest Fortune Group.

Midnight for the Next Two Months $DJ30The last time this happened was in 2024 September to November. Market picked up and snagged orders.
Midnight will tell.
Market can fall a minimum of 5% from the orange line if it goes under the deep dark blue and try to stabilize from there.
There is a lot going on though...
...inauguration, the Yellen bond market, the Fed waiting for a higher yield on debt, the budget deficit, and whatever else catastrophe-wise can rear it's ugly head between now (January 2025 to March 2025.
Prepare & take care.
#DebtCycle

DJ30 Short 15 Min Chart SMA+ Trend line + On weekly BBDow30 short after getting clear Resistance from the SMA+ Trend line + On the weekly BB

[b]#US30 | Dow Jones[/b] Long opportunityThis is an in depth analysis of #US30 | Dow Jones based on data presented on the H4 timeframe, we can expect a little resistance from the selling pressure, but the ultimate push to the upside seems to be more prominent.
