DJ30 up trend intact - pull back in processUS30 Index up trend intact though pull back in progress, Entry setup for long may be completed by overlap session of US/London opening
Dj30


RSI (Relative Strength Index)RSI = Relative Strength Index
Is fluctuates between 0 and 100
• A momentum Oscillator
• Increasing RSI when: Average gains are greater than average losses = Bullish
• Decreasing RSI when: Average gains are less than average losses = Bearish
How to use:
1. Trend recognition: trading in the direction of the trend
1.1 Above 50: Uptrend
1.2 Below 50: Downtrend
2 Overbought and oversold entry signals.
2.1 In an uptrend look for oversold areas and open a long trade after the pullback above 30.
2.2 In a downtrend look for overbought areas and open a short trade after the pullback below 70.

US30 Target hit on this one.... 💥🚀Entry details are shown on the chart.
We're only looking for TP3.
Trade history can be seen below this trade idea too for full transparency.
------------------------------------------
I try and share as many ideas as I can as and when I have time. My trades are automated so I am not sat in front of a screen daily.
Jumping on random trade ideas 'willy-nilly' on Trading View trying to find that one trade that you can retire from is not a sustainable way to trade. You might get lucky, but it will always end one way.
------------------------------------------
Please hit the 👍 LIKE button if you like my ideas🙏
Also follow my profile, then you will receive a notification whenever I post a trading idea - so you don't miss them. 🙌
No one likes missing out, do they?
Also, see my 'related ideas' below to see more just like this.
Interested in access to my strategy so you can be in these trades the moment they're valid? Drop me a DM .
The stats for this pair are shown below too.
Thank you.
Darren

DJ30 - running blue 👍Entry details are shown on the chart.
------------------------------------------
I try and share as many ideas as I can as and when I have time. My trades are automated so I am not sat in front of a screen daily.
Jumping on random trade ideas 'willy-nilly' on Trading View trying to find that one trade that you can retire from is not a sustainable way to trade. You might get lucky, but it will always end one way.
------------------------------------------
Please hit the 👍 LIKE button if you like my ideas🙏
Also follow my profile, then you will receive a notification whenever I post a trading idea - so you don't miss them. 🙌
No one likes missing out do they.
Also, see my 'related ideas' below to see more just like this.
Interested in access to my strategy so you can be in these trades the moment they're valid? Drop me a DM .
The stats for this pair are shown below too.
Thank you.
Darren

DJ30 with a possible bull continuationI think there is a great chance for another bull push on US30... and there are a lot of solid reasons for that.
Some of the reasons are....
10m chart:
- bull continuation
- higher hiws
- higher lows (if it holds)
1H chart
- Donchain channel creating bullish push

US30 day trade longWe recently went short Silver (XAGUSD)... we dont see a GME on it... Infact we think the hedge funds might just pull a sneaky on everyone!
Anyway our shorts are locked. Moving on to US30 long.
We see lots of potential for a day trade profit on this one. We have a bullish continuation pattern indicating that we could see a strong push up.
BUT! When price comes to our 38.2% on the 4H chart (left) we are planning to go short... not 100% yet we will decide when price comes there and see whats up..

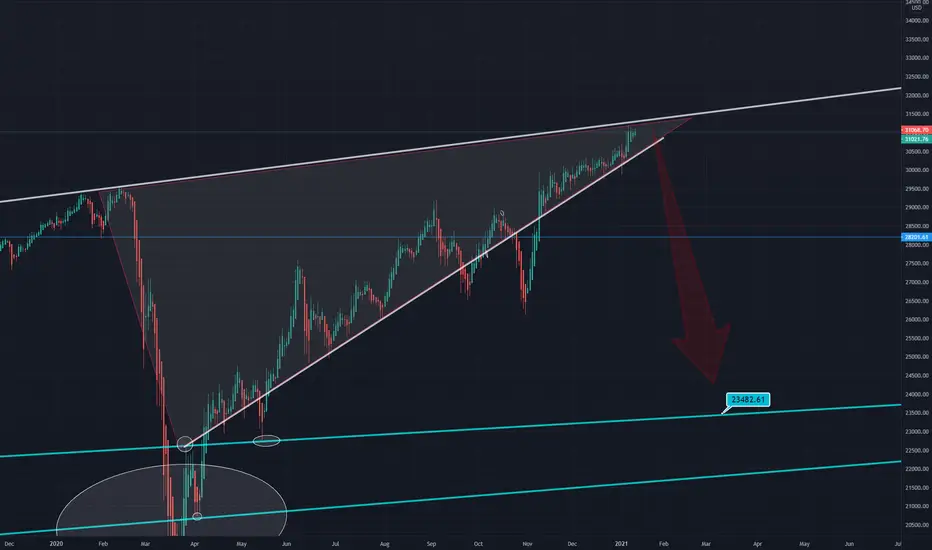
US30 A BIG DISCOUNT CYCLE Watch carefully all this chart of mine you will see that the stock market has been in a huge price drop,
all major indexes ( DJ30 , SPX500 , NASDAQ100 ) have the same direction, make your decision my friend , I left this market today .


Lockheed Martin - Great Buying Opportunity LMT is getting pressure downwards however I am bullish on the company and stock. I believe the stock is currently undervalued considering the Biden administrations policies and what it would mean for defence stocks. This price level has supported the stock price and I believe it will breakout upwards from the descending resistance line. Either way, considering the support line, it is a good reward for risk to buy the stock with a SL below the support zone.

DOW - Increased chances for a correctionOur updated charts.
Lot's of fundamental analysis in the background (CPI coming up)
Dow Jones Sell / Expecting a bearish push!We are short on the DJ30 we expect a bearish push to the down side and any spikes above, as long as the pattern for selling remains active, we will short.
We believe there is a good chance of indices continuing to go down today and this week perhaps.
All the reasons we are short are listed in the chart.

Dow - DJWe got a nice pop up which is standing on not so reliable grounds. Expecting drop back to 30900ish in later Ny session. London will close soon at a bit higer as it is at this moment. More consolidation between 31150 and 31200 before drop.


Rising wedge Rising Wedge
A rising wedge is formed when price consolidates between upward sloping support and resistance lines.
This indicates that higher lows are being formed faster than higher highs. This leads to a wedge-like formation, which is exactly where the chart pattern gets its name from!
With prices consolidating, we know that a big splash is coming, so we can expect a breakout to either the top or bottom.
If the rising wedge forms after an uptrend, it’s usually a bearish reversal pattern. On the other hand, if it forms during a downtrend, it could signal a continuation of the down move.
Either way, the important thing is that, when you spot this forex trading chart pattern, you’re ready with your entry orders!
That means there are more forex traders desperate to be short than be long!
Ref: babypips . com


Dow Jones UptrendOnce DJ30 raises to 28700 it may pullback a bit and then hit 29500 easily considering stimulus package deal is on its way

DJ30 SELL to 27308 or lowerThings not looking too good. Earnings reports (banks) this week and the DJ30 probably unable to keep itself at 'close-to-all time-highs'.
We prefer to SELL DJ30- Hedge by buying NASDAQ

DJ30 - Dow running +600 pips US30 - Buy is valid
The entry price, SL and multiple TPs are shown on the chart.
Our back testing and money management strategy itself is holding until a reverse signal to ride a big trend, but as you will not see the next signal - manage the trade as you wish should you decide to enter.
What is our strategy?
Our strategy is a trend following strategy, can be used on any instrument and time frame. However, we have hard coded specific parameters for when trading the H1 time frame, so we can back up over 4200 previous trades to confirm our edge from previous data. This gives us confidence in execution and belief in our trading strategy for the long term.
The strategy simply sits in your trading view, so you will see exactly what we see - the trade, entry price, SL and multiple TPs (although we hold until opposite trade as this is the most profitable longer term plan), lot size, etc.
This could be on your phone trading view app, or laptop of course.
The hard work is done, so we have zero chart work time, no analysis, no time front of the chart doing technical analysis - technical analysis is very subjective - you may see different things at different times - how do you have a rigid trading plan on a H&S shoulder pattern? Your daily routine, diet, sleep, exercise can affect what you 'see' and your decision making, this doesn't happen when a strategy is coded like this; what we do have is a mechanical trading strategy...
What does this mean?
It means, we are very clear on our entry and our exit and use strict risk management (this is built in - put in your account size, set your risk in % or fixed amount and it will tell you what lot size to trade!) so we have no ego with our position and we are comfortable with all outcomes - its simply just another trade. This free's our mindset from worry and anxiety as we take confidence from knowing our edge is there and also that we have used sensible risk management.
The strategy itself can be used as a live trading journal too - how cool is that? The strategy will confirm and support every open and closed position - so its quite easy to follow.
We just have to do what Percy does.
Please see our related ideas below for more information to explain what we do and how it can help you.

US30/DJ30 Weekly OutlookTechnical:
Daily ascending trendline
Weekly fib
4hr fib
4hr descending channel
Buy Entry:
Close above 78.6% weekly fib level
Close above 23.6% 4hr fib level
Close above 27,500 breaking LH/LL structure
Break of descending channel
Target - 4hr 61.8% Fib for around 600 points
Sell Entry:
Break of daily ascending trendline
Close back below both fib levels
Target - 4hr -23.6% fib for around 600 points
