DOW GOING TO 30K OR BACK TO 27K ?US30 price is in a wedge pattern but it's not yet enough conirmation to sell it. So,we will wait for more conformations. Please give a follow to get the updates on time :)
In H4, we will wait for an impulsive move to the downside and trade the pullback.
H4 :
Traders! if you like my ideas and do take the same trade, please write it in comment so we can manage the trade together.
_________________________________________________________________________________________________________________________________________
Disclaimer : The content on this analysis is subject to change at any time without notice, and is provided for the sole purpose of assisting traders to make independent investment decisions.
_________________________________________________________________________________________________________________________________________
Thank you for your support!
Dj30

DOW JONES NOT REVERSING YET: WEEKLYThe Dow Jones Industrial Average is still looking like a strong bull on the weekly timeframe. The candles have not yet formed a reversal pattern, there is still potential for the upside after breaking the previous top. On a weekly candle once a pin bar formation of a strong reversal Doji forms then we can talk about the potential downside. For now, the target is still the top of the channel at 28650-28700.
There is a potential for a slight retrace but price should not get much below 27300 on a long-term perspective. That will ensure structure holds well bullish. Each failure off the top of the channel was followed by a 6.60% retrace, for that to occur price has to move up to the top of the channel, IF there is a 6+% retrace, the channel and bull structure is broken and the move lower can price the Dow Jones into correction territory.

DOW SHORTPrice has reached TL resistance and I expect bears to come in and drive price back down.
1D: As you can see as price continues to make a new high, the indicator shows price making a flat; this may suggest bearish divergence.

The limit of DJI will be toAfter a decade of gold, the U.S. stock market will face another big bear market.
If the DJI does not continue to rise in the next six months, then macd will produce a top divergence, which will be the 6th top divergence in the history of the DJI, in the previous five times, three times more than -20%, two times stagflation, so don't look down on the pressure of top divergence. And I believe that this time, if a top divergence is formed, it could be a long bear market, with adjustments likely to take more than a year.
And for the Dow's target forecast, there are now two clear highs, 29600 and 34400, the target bits formed by the two golden divider lines, which, if superimposed on top divergence, could be the ultimate top of the Dow Jones index.
On the contrary, China's A-shares, after four years of bear market, in the securities market continued to "de-leverage", the risk has been reduced a lot, the market is now attracting numerous external capital inflows, including by Trump "screaming" the United States "pension pension" are eager to run into the market, indicating that A-shares are currently cost-effective, It's hard for anyone to refuse.
With China's economy facing its worst situation in 30 years, why do people value A-shares so much?
I think on the one hand is the world's second largest economy, its own vitality is tenacious, so that we all believe that China can avoid Japan and Germany's problems. Globally, is there a safer investment market than China after capital leaves the United States? I'm afraid the answer is no. In the case of economic downturn, light assets are actually very good investment targets, which in Japan after the "square agreement", has also been confirmed.
So it's important for me to remind you that it's time to focus on A-shares.
Strategy: gradually withdraw from the U.S. stock market, the investment target to China's A-share market, 5g is the infrastructure of the Internet of Things, is the cornerstone of China's science and technology decade, but also the first to benefit from the sector, and China's social transformation, manufacturing technology upgrading, asset securitization is the foundation, so the big financial sector also has a bull market foundation, In the future there will be Morgan Stanley in China, Apple and Google.


Historical Analysis of the DIAHistorical Analysis and Monthly Chart :
The DIA showing Strong Major Bull Trednd with serveral interaction with the Return Line (RL).
Note the Pick in Momentum since February 2016 (or B3), the next Major bottom made above the Major Trend Line (MUT), and therfore showing the failure of the Bears to take the price downward.
But, we dont see strong sign of buyers either.
The DIA is inside big Consolidation that lasted for almost 2 years (since Oct 17).
Weekly Chart :
The Resistance Area between 265.88 - 267.53 Established in Jan 2018, the second attempt to go above that level accured 1 year ago (Sep 2018) and the reaction was very violent and took the price to far down levels.
Since then the price hit the Resistance Area 3 Times :
1) April 2019 - the price got into resistance reaction and made New High Bottom.
2) June 2019 - the price go through the Resistance Area, Failed to continue, and made new higher bottom bellow that level.
3) September 2019 (these days) - the price close above the area last week, but with relatively low volume.
We need to keep an eye on the price this week and look for the power of the buyers, how far they can take the price up (if any).
Notice also the Volume Activity in the Consolidation Area - Pickup on down moves, and diminsh on the Rallies - weakness .
Daily Chart :
The Daily chart does not give us alot of new information.
But we can see the Trading Zone (sort of Rectangle), and the price movement above it.
The Minor picture is Bullish.
Conclusion :
Since B4, the overall picture looks positive.
But the Key for understanding the coming moves relly on the reaction to the Resistance Area, and the examination of the Bulls Power.
Any High Volume Bullish Activity above the Resistance Area, can take us again to the Return Line (RL).
If we will see Second Failure on the Resistance Zone,we need to examine the power of the Beats, and the next areas to look for are the bottom of the trading zone, and B4.1.
If the Bears will act Aggresivley and take the price bellow B4.1, the picture is very negative and the next level is the MUT.

Dow Jones - A good old rodeo never hurt anyone.Hi, today we are going to talk about Dow Jones and its current landscape.
At Dow Jones, we have a test from the broken Uptrend, so the Bears are going to build up positions in this zone with massive financial volume, creating intense downside pressure on the price. Since the breaking of this Uptrend, it's crucial for the maintenance of the bearish movement. Remember that the asset still moving sideways, for now. So this attempt to retake the Uptrend could be only random, just a Bull Trap.
Thank you for reading and leave your comments if you like.

US30 - Momentum stalling reversal?OANDA:US30USD
Trade Idea
DOW30 - Intraday - We look to Sell a break of 27325 (stop at 27425)
Price action resulted in a new all-time high at 27403. Momentum is stalling with the posting of new highs and indicates bearish divergence. Prices have reacted from 27400. The overnight rally has been sold into and there is scope for further bearish pressure going into this morning. With our medium term bias looking to buy dips and the short term bias indicating selling interest we are faced with mixed signals. This has resulted in mixed signals and we prefer to trade a break.
Our profit targets will be 27125 and 27000
Resistance: 27403 / 27475 / 27541
Support: 27336 / 27200 / 27125

Wait for a great short opportunity!Until now it looks like that US30 wants to retest the daily trendline and resistance zone, which aligns perfectly with the 0.236 Fib level.
So, just wait a bit and you have a great short opportunity on your hand. :)

Incredible oportunity on GER30 for todayWe have a simetrical triangle, the trend is upward, so watch for a top breakout.
Tomorrow, 23 may at 10:30 and 11:00 am we have red news, so keep an eye on it.

US30USD which way to go? let us know in the comments.Trend lines are in D1. Very strong resistance. Let us know what you think about US30USD

Situation DJI at end of 7.3.2019 SHORTAt end of trading day 7.3.2019 there is now really news to tell. We have
established now a new short downtrend channel
i have marked in purple to have a road for the next days.
There is also as you can see a trend resistance channel with
a deeper fall, i have marked with orange resistance line.
I think in 1 of these channels we will se DJI tomorrow
and than we check situation again.
There is a added resistance zone also marked in orange now at 25560 we have to check to see
a first sign of end of short.
(Whether DJI climbs above that)
But even IF, that only a sign, that NOT a new long signal.

Situation DJI 7.3. at 12:45 NYTNothing news here, Situation is still short.
Resistance at 25890 and also at 25720
are to brek for a new setup.
But the short trendine is also valid as resistance (marked in blue)

Situation DJI 1HR 5.3.2019 12:30 NYTIts exactly as described in the older publish from today morning
DJI comes to that the short trendline resistance (Orange color) and go south at the moment.
But that is to watch carefully. maybe we will have later today or tomorrow
a jump above this line.
If that will be the setup short will be going wrong.
But at the moent its still short.


DJI : Buy into the close...Watch as they buy
this market into
the close...
They will not go
into the weekend
on a sour note !

DJI : Fake , Phoney & False & FalseIt's Friday and they will
do ANYTHING to prop up
the DJI into the close !
Buying Bonds, manipulation
of every manner.
These markets are Fake !

Dow Futures Elliott Wave View: Reacting Higher From Blue BoxHello Traders,
Dow Futures short-term Elliott wave view suggests that the rally from 6/28/2018 low cycle to 25572 high on 7/27/2018 peak ended red wave 1. The internals of that rally higher took place as an impulse structure with sub-division of 5 waves structure in each leg higher. Down from there, the index corrected the 6/28/2018 cycle in 3 swings pullback & ended red wave 2 at 25086 low.
The internals of that pullback unfolded as Elliott wave Zigzag correction with the sub-division of 5-3-5 structure in black wave ((a)), ((b)), ((c)). Down from 7/27 peak, the decline to 25264 low ended black wave ((a)) in 5 waves structure. From there, the rally to 25486 high ended black wave ((b)) and the subsequent move lower to 25086 low ended black wave ((c)) of 2 in 5 waves structure. Red wave 2 ended within the 25174 – 25100 area, which is 100%-123.6% Fibonacci extension of ((a))-((b)), as indicated by the blue box.
Up from 25086, the index is reacting higher in 3 swings so far and longs from blue box area should be risk-free (stop loss at break even) already. The right side tag, combined with the blue box, help to identify the right trading strategy. Near-term, as far as dips remain above 25086 low, the right side of the market remains to the upside. Expect the Index to resume the next extension higher in red wave 3. We don’t like selling it.

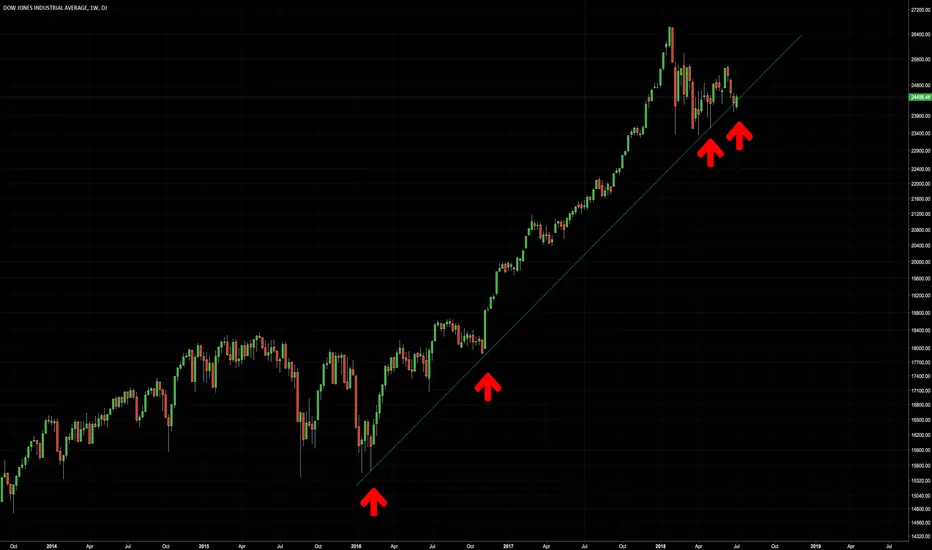
DJI - Next leg higherI think DJI is about to take the next leg higher. Same goes for SPX and NDX, although we could see some rotation out of tech.