DJ30 has a strong downside momentum, could it drop further?Price is rising towards a resistance level which is a pullback resistance level and could reverse from this level to our take profit.
Entry: 38759.67
Why we like it:
There is a pullback resistance level which aligns with the 61.8% Fibonacci retracement.
Stop loss: 39081.03
Why we like it:
There is an overlap resistance level.
Take profit: 38139.92
Why we like it:
There is an overlap support level.
Please be advised that the information presented on TradingView is provided to Vantage (‘Vantage Global Limited’, ‘we’) by a third-party provider (‘Everest Fortune Group’). Please be reminded that you are solely responsible for the trading decisions on your account. There is a very high degree of risk involved in trading. Any information and/or content is intended entirely for research, educational and informational purposes only and does not constitute investment or consultation advice or investment strategy. The information is not tailored to the investment needs of any specific person and therefore does not involve a consideration of any of the investment objectives, financial situation or needs of any viewer that may receive it. Kindly also note that past performance is not a reliable indicator of future results. Actual results may differ materially from those anticipated in forward-looking or past performance statements. We assume no liability as to the accuracy or completeness of any of the information and/or content provided herein and the Company cannot be held responsible for any omission, mistake nor for any loss or damage including without limitation to any loss of profit which may arise from reliance on any information supplied by Everest Fortune Group.
Why we like it:
There
Dj30

DJ30 has a strong downside momentum, could it drop further?Price is rising towards a resistance level which is a pullback resistance level which aligns with the 23.6% Fibonacci retracement and could reverse from tis level to our take profit
Entry: 38582.06
Why we like it:
There is a pullback resistance level which aligns with the 23.6% Fibonacci retracement
Stop loss: 39081.03
Why we like it:
There is an overlap resistance level
Take profit: 38139.92
Why we like it:
There is an overlap support level
Please be advised that the information presented on TradingView is provided to Vantage (‘Vantage Global Limited’, ‘we’) by a third-party provider (‘Everest Fortune Group’). Please be reminded that you are solely responsible for the trading decisions on your account. There is a very high degree of risk involved in trading. Any information and/or content is intended entirely for research, educational and informational purposes only and does not constitute investment or consultation advice or investment strategy. The information is not tailored to the investment needs of any specific person and therefore does not involve a consideration of any of the investment objectives, financial situation or needs of any viewer that may receive it. Kindly also note that past performance is not a reliable indicator of future results. Actual results may differ materially from those anticipated in forward-looking or past performance statements. We assume no liability as to the accuracy or completeness of any of the information and/or content provided herein and the Company cannot be held responsible for any omission, mistake nor for any loss or damage including without limitation to any loss of profit which may arise from reliance on any information supplied by Everest Fortune Group.

US30 DJ30 DOWJONES ROBBERY PLANHI Traders,
NFP Trade master plan to Heist US30 Market. my dear Looters U can enter after the NFP data there is high chance to go down side, Our target is Green Zone if it goes bearish side, Bullish side our target is Red Zone that is High risk Caution Pullback area, If There is any Bad news it make our heist very sad and if the news is favorable for us then we can continue our looting from there with help of trailing stop.
My dear Robbers please book some partial money it will manage our risk. Be safe and be careful.. Make money and take money.

US30/DJ30 Bearish Robbery Plan Short SideHELLO LOOTERS,
This is our master plan to Heist Bearish side of US30 Market. my dear looters U can enter at the pullback, Our target is Trap Zone. We can escape in the Target area. Guys If you loot some money please take it partial.

Dow Jones: Mixed Economic Data and Dollar DynamicsThe recent release of Initial Jobless Claims by the US Department of Labor has unveiled a slightly higher figure than anticipated. This unexpected uptick is seen as a consequence of the rise in Initial Jobless Claims for the week ending March 2nd, coupled with lower-than-expected Unit Labour Costs from the fourth quarter.
As market observers eagerly await the arrival of crucial labor market data on Friday, including the Unemployment Rate, Average Hourly Earnings, and NonFarm Payrolls for February, the trajectory of the US Dollar Index (DXY) hangs in the balance. These forthcoming data points are poised to dictate short-term movements in the DXY.
Moreover, the possibility of additional labor market data releases on Friday raises concerns of imminent rate cuts, which could exert further downward pressure on the Greenback.
On the technical front, the price has reached a critical Resistance level around 38,900, coinciding with the 61.8% Fibonacci retracement level. In response to this confluence, a selling position has been initiated, with the first take-profit target set at 38,500.
As investors navigate through the complexities of mixed economic signals and anticipate the impact of impending data releases, market sentiment towards the US Dollar remains uncertain. The outcome of Friday's labor market data will likely steer the direction of the Greenback in the immediate future, influencing trading strategies and investment decisions across global markets.

Indices and USd pairs analysisToday I will be analyzing indices and USD pairs. I expect some USD strength next week.
Disclaimer: This is just my analysis which of course can be wrong. So do your own analysis before investing or trading

NASDQ100 THE 2024 CRASH SHORT POSITION MEGAPHONE PATTERNNasdaq100 after a big up move. end big AB=CD+FIBO E LEVEL+ Bollinger Band+ Pivot
I choose to show the MegaPhone pattern in the photo but there are many other tools.
Fed wants to cut the rate this year, so I think he will do that only after a big down movement in the stock market.

Dow Jones H4 | Potential bullish breakoutDow Jones (DJ30) is rising towards a potential breakout level and momentum could potentially carry price towards our take-profit target.
Entry: 38,448.86
Why we like it:
There is a potential breakout level
Stop Loss: 38,048.50
Why we like it:
There is a pullback support that aligns with the 50.0% Fibonacci retracement level
Take Profit: 38,891.09
Why we like it:
There is a swing-high resistance level
Please be advised that the information presented on TradingView is provided to Vantage (‘Vantage Global Limited’, ‘we’) by a third-party provider (‘Everest Fortune Group’). Please be reminded that you are solely responsible for the trading decisions on your account. There is a very high degree of risk involved in trading. Any information and/or content is intended entirely for research, educational and informational purposes only and does not constitute investment or consultation advice or investment strategy. The information is not tailored to the investment needs of any specific person and therefore does not involve a consideration of any of the investment objectives, financial situation or needs of any viewer that may receive it. Kindly also note that past performance is not a reliable indicator of future results. Actual results may differ materially from those anticipated in forward-looking or past performance statements. We assume no liability as to the accuracy or completeness of any of the information and/or content provided herein and the Company cannot be held responsible for any omission, mistake nor for any loss or damage including without limitation to any loss of profit which may arise from reliance on any information supplied by Everest Fortune Group.

Dow Jones Trading IdeaBased on Simple Technical Analysis ( Trendline + Support & Resistance )
Risk Disclaimer:
Please be advised that I am not telling anyone how to spend or invest their money. Take all of my analysis as my own opinion, as entertainment, and at your own risk. I assume no responsibility or liability for any errors or omissions in the content of this page, and they are for educational purposes only. Any action you take on the information in these analysis is strictly at your own risk. There is a very high degree of risk involved in trading. Past results are not indicative of future returns. Good luck :-)

Dow Jones H4 | Falling to 38.2% Fibo supportDow Jones (DJ30) is falling towards a pullback support and could potentially bounce off this level to rise towards our take-profit target.
Entry: 38,159.35
Why we like it:
There is a pullback support that aligns with the 38.2% Fibonacci retracement level
Stop Loss: 37,769.85
Why we like it:
There is a pullback support that aligns with the 61.8% Fibonacci retracement level
Take Profit: 38,792.50
Why we like it:
There is a pullback resistance level
Please be advised that the information presented on TradingView is provided to Vantage (‘Vantage Global Limited’, ‘we’) by a third-party provider (‘Everest Fortune Group’). Please be reminded that you are solely responsible for the trading decisions on your account. There is a very high degree of risk involved in trading. Any information and/or content is intended entirely for research, educational and informational purposes only and does not constitute investment or consultation advice or investment strategy. The information is not tailored to the investment needs of any specific person and therefore does not involve a consideration of any of the investment objectives, financial situation or needs of any viewer that may receive it. Kindly also note that past performance is not a reliable indicator of future results. Actual results may differ materially from those anticipated in forward-looking or past performance statements. We assume no liability as to the accuracy or completeness of any of the information and/or content provided herein and the Company cannot be held responsible for any omission, mistake nor for any loss or damage including without limitation to any loss of profit which may arise from reliance on any information supplied by Everest Fortune Group.

DJ30 H4 | Potential bullish breakoutDJ30 is rising towards a pullback resistance and could potentially break above this level to rise towards our take-profit target.
Entry: 37,543.95
Why we like it:
There is a potential breakout level
Stop Loss: 37,163.35
Why we like it:
There is a pullback support level
Take Profit: 38,020.69
Why we like it:
There is a resistance that aligns with the 127.2% Fibonacci extension level
Please be advised that the information presented on TradingView is provided to Vantage (‘Vantage Global Limited’, ‘we’) by a third-party provider (‘Everest Fortune Group’). Please be reminded that you are solely responsible for the trading decisions on your account. There is a very high degree of risk involved in trading. Any information and/or content is intended entirely for research, educational and informational purposes only and does not constitute investment or consultation advice or investment strategy. The information is not tailored to the investment needs of any specific person and therefore does not involve a consideration of any of the investment objectives, financial situation or needs of any viewer that may receive it. Kindly also note that past performance is not a reliable indicator of future results. Actual results may differ materially from those anticipated in forward-looking or past performance statements. We assume no liability as to the accuracy or completeness of any of the information and/or content provided herein and the Company cannot be held responsible for any omission, mistake nor for any loss or damage including without limitation to any loss of profit which may arise from reliance on any information supplied by Everest Fortune Group.

US30 H1 - Short SignalUS30 H1
Lots of opportunity here on US30 over the last few days, we are really pushing that extreme resistance price and all time high of 37800. And then seeing some aggressive rejections, forming this healthy 300 point from from circa 37750 to 37450.
I still anticipate a bearish breakout. This would be really healthy and attractive for us, if we break 37,000, there are 1000’s of points up for grabs and some huge profit potential.

DJ30 H4 | Potential pullback before bullish bounceDJ30 could fall towards a pullback support and potentially bounce off this level to rise towards our take-profit target.
Entry: 37,665.45
Why we like it:
There is a pullback support level
Stop Loss: 37,247.85
Why we like it:
There is a pullback support level
Take Profit: 38,250.77
Why we like it:
There is a resistance that aligns with the 161.8% Fibonacci extension level
Please be advised that the information presented on TradingView is provided to Vantage (‘Vantage Global Limited’, ‘we’) by a third-party provider (‘Everest Fortune Group’). Please be reminded that you are solely responsible for the trading decisions on your account. There is a very high degree of risk involved in trading. Any information and/or content is intended entirely for research, educational and informational purposes only and does not constitute investment or consultation advice or investment strategy. The information is not tailored to the investment needs of any specific person and therefore does not involve a consideration of any of the investment objectives, financial situation or needs of any viewer that may receive it. Kindly also note that past performance is not a reliable indicator of future results. Actual results may differ materially from those anticipated in forward-looking or past performance statements. We assume no liability as to the accuracy or completeness of any of the information and/or content provided herein and the Company cannot be held responsible for any omission, mistake nor for any loss or damage including without limitation to any loss of profit which may arise from reliance on any information supplied by Everest Fortune Group.

Us30 0.63% rally incomingUS30 is about to complete yet another rally to take it up by 0.63% over 200 points. If you agree give me a like or a comment

US30 IMPORTANT DECISION Hello traders it looks like its make or break time for us30
the price is on a very sensitive zone A Major key level + a falling trendline.
however it looks to me that the buyers are still keeping strength on the market it is very likely and possible we can see a breakout and a further continuation to the upwards just like the nasdaq100
but the possibility of a rejection and down is still there.
id say its 65 percent probability it goes up and 35 percent it goes down.
the global direction is still unclear no confirmation was shown i will update you guys if i see anything.

US30 D1 - Short SignalUS30 D1
The US30 could undergo another substantial selloff, and we've begun to decisively resist the 34,150 price level, as previously anticipated.
Our response may not have been as swift as I'd prefer, but it's worth noting that we closed yesterday's D1 candle in the red, indicating a renewed bearish sentiment today. We remain optimistic about the possibility of seizing short trading opportunities in alignment with the ongoing trends on both the US30 and NAS100 indices.

US30 D1 - Short SignalUS30 D1
The downtrend remains evident. We find ourselves perched at a critical supply level, which has historically served as both a support and resistance area.
Notably, last week's move covered an impressive 1,700-point range. As highlighted in our recent IG video, we are keenly interested in exploring short positions, not only for potential corrective maneuvers but also in anticipation of a sustained continuation of the prevailing trend.

Dow Jones Trading IdeaBased on Simple Technical Analysis ( Trendline + Support & Resistance )
Risk Disclaimer:
Please be advised that I am not telling anyone how to spend or invest their money. Take all of my analysis as my own opinion, as entertainment, and at your own risk. I assume no responsibility or liability for any errors or omissions in the content of this page, and they are for educational purposes only. Any action you take on the information in these analysis is strictly at your own risk. There is a very high degree of risk involved in trading. Past results are not indicative of future returns. Good luck :-)
SMT trading explained in less than 4 minutesHow to use and spot Divergences between correlated assets. and use it in your favour.

US30 H4 | Bearish reversal off 78.6% fibo?Price is hovering below our sell entry at 33686.3, which is an overlap resistance, aligning with the 78.6% fibo retracement and 78.6% fibo projection. Our stop loss is at 33929.5, which is slightly above the swing high resistance. Take profit is at 33429.5, which is a pullback support level.
High Risk Investment Warning
Trading Forex/CFDs on margin carries a high level of risk and may not be suitable for all investors. Leverage can work against you.
Forex Capital Markets Limited (www.fxcm.com):
CFDs are complex instruments and come with a high risk of losing money rapidly due to leverage. 70% of retail investor accounts lose money when trading CFDs with this provider. You should consider whether you understand how CFDs work and whether you can afford to take the high risk of losing your money.
Stratos Europe Ltd, previously FXCM EU Ltd (www.fxcm.com):
CFDs are complex instruments and come with a high risk of losing money rapidly due to leverage. 74% of retail investor accounts lose money when trading CFDs with this provider. You should consider whether you understand how CFDs work and whether you can afford to take the high risk of losing your money.
FXCM Australia Pty. Limited (www.fxcm.com):
Trading FX/CFDs carries significant risks. FXCM AU (AFSL 309763), please read the Financial Services Guide, Product Disclosure Statement, Target Market Determination and Terms of Business at www.fxcm.com
Stratos Global LLC (www.fxcm.com):
Losses can exceed deposits.
Please be advised that the information presented on TradingView is provided to FXCM (‘Company’, ‘we’) by a third-party provider (‘TFA Global Pte Ltd’). Please be reminded that you are solely responsible for the trading decisions on your account. There is a very high degree of risk involved in trading. Any information and/or content is intended entirely for research, educational and informational purposes only and does not constitute investment or consultation advice or investment strategy. The information is not tailored to the investment needs of any specific person and therefore does not involve a consideration of any of the investment objectives, financial situation or needs of any viewer that may receive it. Kindly also note that past performance is not a reliable indicator of future results. Actual results may differ materially from those anticipated in forward-looking or past performance statements. We assume no liability as to the accuracy or completeness of any of the information and/or content provided herein and the Company cannot be held responsible for any omission, mistake nor for any loss or damage including without limitation to any loss of profit which may arise from reliance on any information supplied by TFA Global Pte Ltd.
The speaker(s) is neither an employee, agent nor representative of FXCM and is therefore acting independently. The opinions given are their own, constitute general market commentary, and do not constitute the opinion or advice of FXCM or any form of personal or investment advice. FXCM neither endorses nor guarantees offerings of third party speakers, nor is FXCM responsible for the content, veracity or opinions of third-party speakers, presenters or participants.

Dow Jones Trading IdeaBased on Simple Technical Analysis ( Trendline + Support & Resistance )
Risk Disclaimer:
Please be advised that I am not telling anyone how to spend or invest their money. Take all of my analysis as my own opinion, as entertainment, and at your own risk. I assume no responsibility or liability for any errors or omissions in the content of this page, and they are for educational purposes only. Any action you take on the information in these analysis is strictly at your own risk. There is a very high degree of risk involved in trading. Past results are not indicative of future returns. Good luck :-)

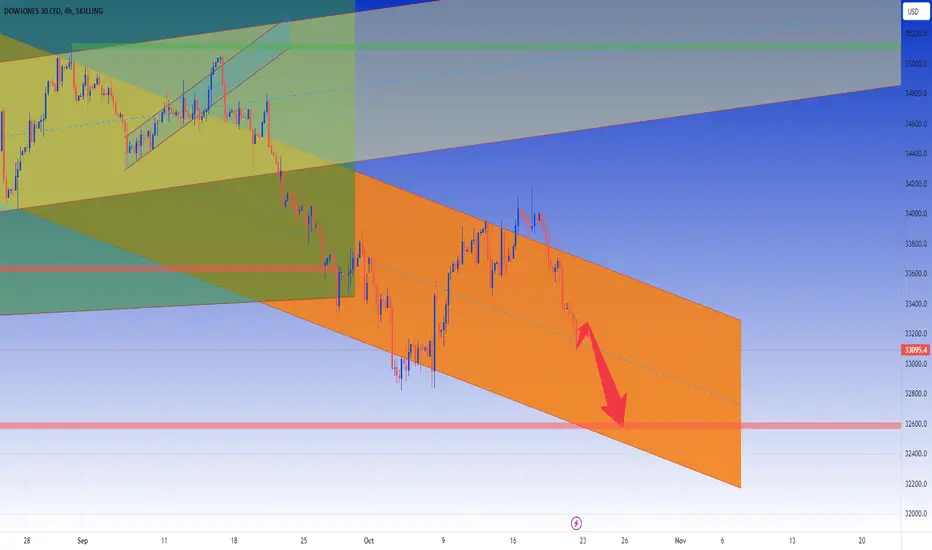
DJ30 H4 | Rising into 23.6% Fibo resistanceDow Jones (DJ30) could rise towards an overlap resistance and potentially reverse from here to drop lower towards our take profit target.
Entry: 33279.95
Why we like it:
There is an overlap resistance that aligns close to the 23.6% Fibonacci retracement level
Stop Loss: 33798.50
Why we like it:
There is an overlap resistance that sits above the 38.2% Fibonacci retracement level
Take Profit: 32722.35
Why we like it:
There is a pullback support level
Please be advised that the information presented on TradingView is provided to Vantage (‘Vantage Global Limited’, ‘we’) by a third-party provider (‘Everest Fortune Group’). Please be reminded that you are solely responsible for the trading decisions on your account. There is a very high degree of risk involved in trading. Any information and/or content is intended entirely for research, educational and informational purposes only and does not constitute investment or consultation advice or investment strategy. The information is not tailored to the investment needs of any specific person and therefore does not involve a consideration of any of the investment objectives, financial situation or needs of any viewer that may receive it. Kindly also note that past performance is not a reliable indicator of future results. Actual results may differ materially from those anticipated in forward-looking or past performance statements. We assume no liability as to the accuracy or completeness of any of the information and/or content provided herein and the Company cannot be held responsible for any omission, mistake nor for any loss or damage including without limitation to any loss of profit which may arise from reliance on any information supplied by Everest Fortune Group.

US30 H4 | Bearish reversal off 61.8% fibo?Price could rise towards our sell entry at 33697.3, which is at the right shoulder, to continue its bearish momentum. It aligns with the 61.8% fibo retracement and 78.6% fibo projection as well. Our stop loss is above the head of the head and shoulders pattern, which is at 33918.4. Take profit is at 33354.4, which is a swing low support level.
High Risk Investment Warning
Trading Forex/CFDs on margin carries a high level of risk and may not be suitable for all investors. Leverage can work against you.
Forex Capital Markets Limited (www.fxcm.com):
CFDs are complex instruments and come with a high risk of losing money rapidly due to leverage. 70% of retail investor accounts lose money when trading CFDs with this provider. You should consider whether you understand how CFDs work and whether you can afford to take the high risk of losing your money.
Stratos Europe Ltd, previously FXCM EU Ltd (www.fxcm.com):
CFDs are complex instruments and come with a high risk of losing money rapidly due to leverage. 74% of retail investor accounts lose money when trading CFDs with this provider. You should consider whether you understand how CFDs work and whether you can afford to take the high risk of losing your money.
FXCM Australia Pty. Limited (www.fxcm.com):
Trading FX/CFDs carries significant risks. FXCM AU (AFSL 309763), please read the Financial Services Guide, Product Disclosure Statement, Target Market Determination and Terms of Business at www.fxcm.com
Stratos Global LLC (www.fxcm.com):
Losses can exceed deposits.
Please be advised that the information presented on TradingView is provided to FXCM (‘Company’, ‘we’) by a third-party provider (‘TFA Global Pte Ltd’). Please be reminded that you are solely responsible for the trading decisions on your account. There is a very high degree of risk involved in trading. Any information and/or content is intended entirely for research, educational and informational purposes only and does not constitute investment or consultation advice or investment strategy. The information is not tailored to the investment needs of any specific person and therefore does not involve a consideration of any of the investment objectives, financial situation or needs of any viewer that may receive it. Kindly also note that past performance is not a reliable indicator of future results. Actual results may differ materially from those anticipated in forward-looking or past performance statements. We assume no liability as to the accuracy or completeness of any of the information and/or content provided herein and the Company cannot be held responsible for any omission, mistake nor for any loss or damage including without limitation to any loss of profit which may arise from reliance on any information supplied by TFA Global Pte Ltd.
The speaker(s) is neither an employee, agent nor representative of FXCM and is therefore acting independently. The opinions given are their own, constitute general market commentary, and do not constitute the opinion or advice of FXCM or any form of personal or investment advice. FXCM neither endorses nor guarantees offerings of third party speakers, nor is FXCM responsible for the content, veracity or opinions of third-party speakers, presenters or participants.
