US30 (High Probability BUY Setup SOON)!!* Here we can see clearly the next moves for DJ30 or US30 today, Forming a Double Bottom Soon ( W ),
* We're expecting a downside move first before we get a bigger uptrend move later on the day,
* We're using smaller time frame for a better view of our analysis, hence we can't predict the duration of our analysis,
* With ADP Non-Farm Employment Change released at 1:15pm (GMT + 00:00) London time,
* While on Wednesday, U.S. stocks closed in choppy trading session, markets had beed down early in the day on the back of a mixed bag of economic data,
* With November Job Openings & Labor Turnover ( JOLTS ) report showed the job market remained strong, bolstering concerns that the Feds could continue raising interest rates as long as there remained a hot market for workers,
* We've got our both EP for SELL & BUY SETUPS,
* We've got our both TP for SELL & BUY SETUPS,
* Keep a close eye on you trading journey,
* Happy pip hunting traders.
* FXKIllA. *
Dj30

DJ30 - Expect trading to remain mixed and volatile.DJ30 - Intraday - We look to Buy at 32824 (stop at 32600)
Intraday, and we are between bespoke support and resistance 32824-33421. Expect trading to remain mixed and volatile. We have a 61.8% Fibonacci pullback level of 32821 from 32439 to 33439. Preferred trade is to buy on dips.
Our profit targets will be 33421 and 33779
Resistance: 33422 / 33779 / 334425
Support: 32824 / 32653 / 32439
Please be advised that the information presented on TradingView is provided to Vantage (‘Vantage Global Limited’, ‘we’) by a third-party provider (‘Signal Centre’). Please be reminded that you are solely responsible for the trading decisions on your account. There is a very high degree of risk involved in trading. Any information and/or content is intended entirely for research, educational and informational purposes only and does not constitute investment or consultation advice or investment strategy. The information is not tailored to the investment needs of any specific person and therefore does not involve a consideration of any of the investment objectives, financial situation or needs of any viewer that may receive it. Kindly also note that past performance is not a reliable indicator of future results. Actual results may differ materially from those anticipated in forward-looking or past performance statements. We assume no liability as to the accuracy or completeness of any of the information and/or content provided herein and the Company cannot be held responsible for any omission, mistake nor for any loss or damage including without limitation to any loss of profit which may arise from reliance on any information supplied by Signal Centre.

Selling DJ30 - Where is the Santa rally?!DJ30 - Intraday - We look to Sell at 33080 (stop at 33480)
4 negative daily performances in succession. There is no clear indication that the downward move is coming to an end. 33080 has been pivotal. There is scope for mild buying at the open but gains should be limited. Bespoke support is located at 31450.
Our profit targets will be 31450 and 28928
Resistance: 33080 / 33432 / 34397
Support: 31450 / 29294 / 28928
Please be advised that the information presented on TradingView is provided to Vantage (‘Vantage Global Limited’, ‘we’) by a third-party provider (‘Signal Centre’). Please be reminded that you are solely responsible for the trading decisions on your account. There is a very high degree of risk involved in trading. Any information and/or content is intended entirely for research, educational and informational purposes only and does not constitute investment or consultation advice or investment strategy. The information is not tailored to the investment needs of any specific person and therefore does not involve a consideration of any of the investment objectives, financial situation or needs of any viewer that may receive it. Kindly also note that past performance is not a reliable indicator of future results. Actual results may differ materially from those anticipated in forward-looking or past performance statements. We assume no liability as to the accuracy or completeness of any of the information and/or content provided herein and the Company cannot be held responsible for any omission, mistake nor for any loss or damage including without limitation to any loss of profit which may arise from reliance on any information supplied by Signal Centre.

DJ30 - Bias remains bearishDJ30 - Intraday - We look to Sell at 33735 (stop at 33885)
The 261.8% Fibonacci extension is located at 34398 from 28612 to 30822. The medium-term bias remains bearish. Bespoke resistance is located at 33735. Rallies continue to attract sellers.
Our profit targets will be 33400 and 32700
Resistance: 33735 / 34000 / 34400
Support: 33400 / 32697 / 32600
Please be advised that the information presented on TradingView is provided to Vantage (‘Vantage Global Limited’, ‘we’) by a third-party provider (‘Signal Centre’). Please be reminded that you are solely responsible for the trading decisions on your account. There is a very high degree of risk involved in trading. Any information and/or content is intended entirely for research, educational and informational purposes only and does not constitute investment or consultation advice or investment strategy. The information is not tailored to the investment needs of any specific person and therefore does not involve a consideration of any of the investment objectives, financial situation or needs of any viewer that may receive it. Kindly also note that past performance is not a reliable indicator of future results. Actual results may differ materially from those anticipated in forward-looking or past performance statements. We assume no liability as to the accuracy or completeness of any of the information and/or content provided herein and the Company cannot be held responsible for any omission, mistake nor for any loss or damage including without limitation to any loss of profit which may arise from reliance on any information supplied by Signal Centre.

us30 Would wait for price to hit AOI
see what reaction price gives us
simple break and retest to go short or
if rejected look for longs up to resistance

US30 - DOW JONES NEXT WEEK MOVE Everything may happen, yes, it is difficult to witness a decline in the Dow Jones index with the weakness of the dollar index, but I trust the technical analysis in this matter and the Dow will continue its decline towards levels of 31300 and may correct slightly to continue its march towards 30200 levels.
🔥💥 Like, Shared and subscription 💥🔥
Note: If you are a beginner trader, you should be aware of these rules:
1: Do not covet
2: Don't trade too much
3: Secure your positions after entering the profit
4: Enter contracts that fit your portfolio
5: Adhere to all recommendations

Took a couple of trades this week. Tell me how i did..Lost out on one because of a slight calculation error but every mistake is a gift to be learned. Getting closer to the be all end all strategy ( maybe im delusional, or maybe im o the right track. Used a trend/percentage changes that happens every 3 months to get my fib figures. I only take trades that have one directional bias that last 24hours. Comment your thoughts down below. LETS KILL THE DJ30 tomorrow🤞✔.

S&P500 SHORT First buy to upper trendline
and bounces and sidaways at the bottom
next week might flooded
First BUY
Second SELL from upper resistance zone


Dj30 long trade possible One can go long in index
At current levels
Sl 30300
Tgt 31250 31400
Ask your financial advisor before taking any action based on my view
Only for educational purposes

DJ30DJ30 at support 29932.6 if it still works well The price is expected to increase in the short term.

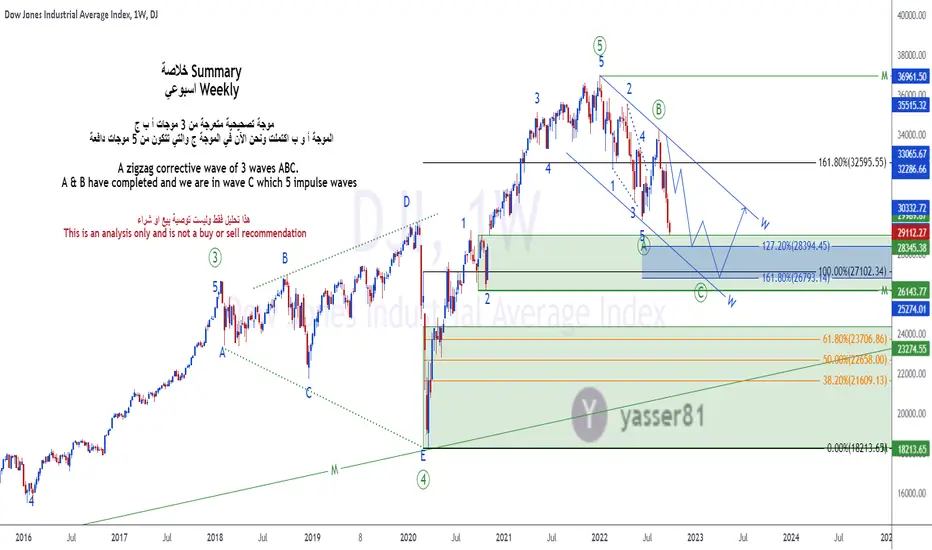
Dow Jones ( DJ30 ) Weekly analysisDow Jones ( DJ30 ) Weekly analysis
A zigzag corrective wave of 3 waves ABC. A & B have completed and we are in wave C which 5 impulse waves
Regards,
SPX500 15min chart, Bullish Direction150pip SL, targeting 1:3RR. Trading 15min RSi Divergence here as entry.

DowJones is looking in a slight buy side todayDowJones is looking in a small buy mode side today ahead of Federal Meet.

DowJones30 will fly soon.Long DowJones30, smart money is Going to fill their bags at 30900-30600 levels.

US30 Long15min RSI Setup, will be a banger! We are also inside a nice 1H Demand that should see some reaction.

US30 ShortThis is what i'll be watching for on US30. 15min RSI Divergence to form, then a huge drop to follow. Atleast a 1:12 trade here coming up.

US30 SHort, massive swing inboundWhere to start.. economy is shit, and the FED keeps printing money leading to an artificial bullish market. what could go wrong right?
*4H Supply Zone tapped into
*4H RSI Divergence is about to finish forming
*4H Pinbar to form showing insane rejection and candlestick confirmation
*15min RSI Divergence for entry.
This could be a killer

US30 ShortHere's my 15min short for US30. We are sitting in a massive 4H Supply Zone, and we have some very clear RSI Divergence as confirmation. Lets get it.

" US30 " Sell Trade With 1500 Pips TargetGood Morning Trader's ,, Let's Explain Together " US30 " Sell Trade With 99% Accurate Area ,,
1 - Why US30 Will Down From This Area ? Because This IS Golden Area In Our Strategy And That's Order Block Area
2- How Many Pips For Target ? 1500 Pips
3- How Many Pips For Stop ? 350 Pips
4- When We Will Enter Sell ? 33000 - 33250
Don't Forget To Put Like And Comment


SPX 500 2008 AND 2022 🤔📉History does not repeat itself, but it rhymes.
Over time we have seen how there are economic recessions every 8 years to 15 years.
The US reported 2 negative quarters which is already a technical recession but the FED tries to hide it with yesterday's news (July 27, 2022), there are still key dates to potentially short almost everything including BTC, CRYPTOCURRENCIES, STOCKS and INDICES. The key dates to keep an eye on the market are:
1. August 5 (NFP) - August 10 (Annual Inflation).
2. September 1 (Non-agricultural employment change).
3. September 21 (FED Open Market Committee Economic Projections).
The economic downturn is here, so Meta must do more with less - Mark Zuckerberg (Wednesday, July 27 in the "Meta Platforms" erning report)

📊US10Y: probable fall📊 The yield on 10-year US bonds has increased by 105% since February of this year. During this time, market participants have paid special attention to the level of 2.74%, that currently acts as the main support. The current trend towards the strengthening of the US dollar would continue to put pressure on the yield on US 10-year bonds and on the economy as a whole. The spread between 2-year and 10-year bonds adds more fuel to the fire. The yield on 2-year bonds is higher than on 10-year bonds:
This graph shows clear signs of a recession, which is no longer in doubt. All signs of the deepest crisis on the face.
☝️ It is necessary to remember:
🔴 In a favorable economic situation, the yield curve has a convex shape, namely, short rates are lower than long ones, that reflects the positive economic expectations of the market❗️
🔴 Inversion - when short is higher than long - this is a signal of an impending recession, but this type usually does not last long❗️
🔴 A flat curve indicates that the market sees hopeless stagnation, which is what we are actually seeing now❗️
Technical analysis speaks more in favor of sales than longs: the right shoulder of the "head and shoulders" reversal pattern is being formed, the base of this model is just the same at the level of 2.74% mentioned earlier. The final moment in this "sell history" is the breaking of the Moving Average down, which indicates the beginning of at least a downward correction. Prospects for downward movement are at the level of 2.39%.
In any case, an alternative scenario assumes a pause in growth, but a downward correction is more likely, that may be less than the declared movement according to the main scenario.
--------------------------
Thanks for support, subscribe and share your ideas here 👇
--------------------------
