BTC - This is Why I Am Now Shorting Bitcoin...In this video, I delve into the considerations that led me to take a short position on Bitcoin at these specific levels. I want to clarify that I'm not advocating for others to follow suit in shorting Bitcoin; rather, I'm elucidating the rationale behind my decision. The video also touches upon the influence of the Dow Jones and Solana on this decision, and I present a slightly less optimistic perspective on BNB.
While the medium-term outlook still anticipates all-time highs, the short-term signals suggest a potential impediment to the crypto market's performance due to a looming recession. Despite this, I posit that ongoing stimulus measures during such economic events act as catalysts for the subsequent upward movement. It seems imprudent to adopt a bullish stance before a correction has run its course, underscoring the fundamental principle behind the formation of AriasWave.
DJI

Hellena | DJI (4H): Short to support area 37041.78.Dear colleagues, I assume that the price has either completed the 5th wave or is completing it. Therefore, I suppose that the price starts its downward movement. I suppose the first target is the support area 37041.78. This is the area of the wave 4 low.
Manage your capital correctly and competently! Only enter trades based on reliable patterns!

🅱️ Bitcoin Is The Dow Jones In 1968 | Elliot Wave TheoryBack in 1968 the two major proponents of the Elliot Wave theory concept where divided as to the wave count of the DJIA.
While AJ Frost would consider the 1966 peak as Wave B of an irregular top in a flat correction, Hamilton Bolton was looking at it as the 5th wave of a bullish impulse.
One thing is certain, while they disagreed on the count they both agreed that what should follow was a new bull-market regardless of the count and they were right.
We ended up with a triple zig-zag followed by a new bull-market:
We have the same situation today with Bitcoin, people are divided between the third and fifth waves.
One interpretation calls for the top to be April 2021 with the low in November 2022 being Wave C of a flat and Wave 4 of the impulse in a higher degree:
While some others are calling for new lows taking the November 2021 irregular top as Wave 5 of the bigger impulse:
Well, there is actually a big difference with the Dow Jones forecasters from the past.
While they had a different count as to the irregular top, both agreed that what would be now equivalent to the November 2022 low in Bitcoin was the bottom in the Dow Jones before a new major leg up or bull market, our Cryptocurrency analysts, some, are still divided between new lows and a new bull-market.
Now, let me offer you my count, it is pretty simple.
The 2017 peak is definitely the end of a major 5-up wave, no doubt about that, we can easily draw a 5-up wave pattern with multiple extensions.
What follows is a correction, you can draw it in any way you like and here we have an A-B-C or Zig-Zag from Dec. '17 to Dec. '18.
The next wave can be either an inverted Zig-Zag or another 5-up wave, makes no difference, from Dec. '18 through June '19.
This is followed by another correction ending in March 2020 and here a new 5-up wave pattern starts.
From March 2020 through April 2021 we have another impulse and April 2021 marks the orthodox end of this bull market.
What follows is a correction, classic EW theory and you can see it on this chart.
If you want to be conservative or lets just say not bullish, you can say that another correction can follow after the Nov. 2022 low, this is possible and you can draw an upward Zig-Zag or whatever you like, we can only really confirm the wave count in retrospect.
But, if you consider go past market action and the way Elliot Wave theory works, we are set for a new 5 waves up impulse.
Which is really just the fifth wave of a higher degree since the correction from April 2021 through November 2022 is only Wave 4, which tends to be complex, hard to read and long. We have all these characteristics here...
Bitcoin is going bullish... Can any Elliotter confirm/comment if I am right or wrong?
Namaste.

Market Update 3/1/2024Too lazy to type again. Just watch the video. Its pretty straight forward.
As before, Id still like to see a drop back to the day TF hulls .
I am hoping this corresponds to MARA starting under 21.5 and then I can grab it when we start a week back above 21.5. And by above, I dont mean 25-30% above like it did last week.

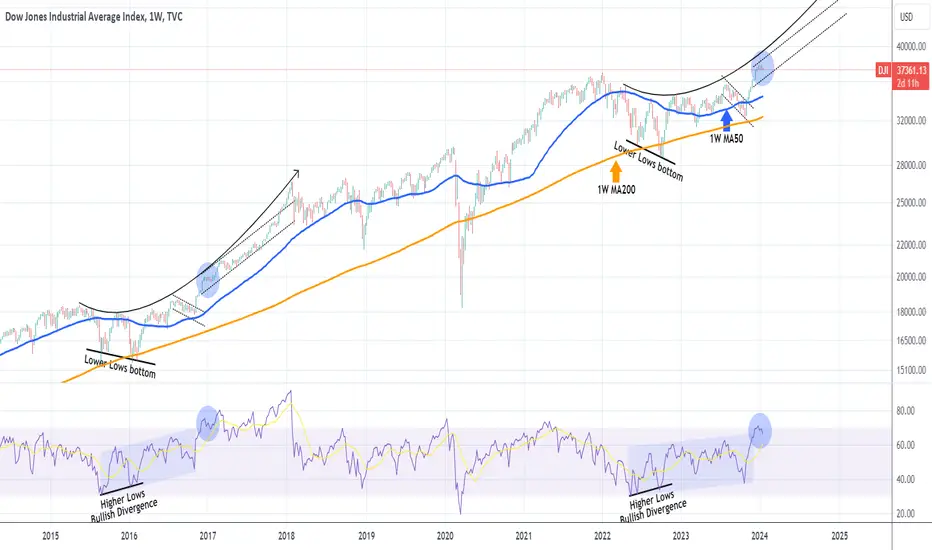
DOW JONES Why you don't want to miss this rally.Dow Jones (DJI) is pulling back on a technical correction as the 1W RSI got overbought (above the 70.00 mark) on the December 26 1W candle. That was basically the first time since June 01 2021 it got overbought and that time also gave a technical pull-back.
What draws our attention more than that time though is the December 19 2016 pull-back when the 1W RSI was again overbought. The difference here is that the price action and patterns that preceded that pull-back/ consolidation are very similar. A Lower Lows bottom on the 1W MA200 (orange trend-line) that took place on a 1W RSI Higher Lows Bullish Divergence, gave way to a break and sustainable rise above the 1W MA50 (blue trend-line). Following the current pull-back/ consolidation we are at, a very strong Channel Up took place.
As a result, even though the sentiment is bearish on the short-term, possibly until the January 31 Fed Meeting, it is clear that the long-term trend is bullish. Every such correction has high probabilities from now on to be a buy opportunity. The target can be as high as 43000 within 2024.
-------------------------------------------------------------------------------
** Please LIKE 👍, FOLLOW ✅, SHARE 🙌 and COMMENT ✍ if you enjoy this idea! Also share your ideas and charts in the comments section below! This is best way to keep it relevant, support us, keep the content here free and allow the idea to reach as many people as possible. **
-------------------------------------------------------------------------------
💸💸💸💸💸💸
👇 👇 👇 👇 👇 👇
Dow failed to breakout of the 1929 & 2000 Trend - Crash IncomingThese are serious setups, I found a trendline that connected to the Feb 2020 top and it drop from there the next day. This is BIG we failed to breakout of the trendline connecting 1929 to 2000, it went above and came back under, this is VERY Bearish. First target 26000 under that it gets nasty.

[BA] BOEING CO. BUY SETUPlooking for a rebound soon and recovery this year.
possible targets : 330$ , 425$

DOW JONES: Top is being formed, 1D RSI Bearish Divergence.Dow Jones has been trading sideways since the December 28th 2023 High, having tested that Resistance after another three times. Naturally the 4H timeframe is neutral and the 1D technical outlook is about to as well (RSI = 56.255, MACD = 185.180, ADX = 33.836). The 1D RSI in particular is under a LH trendline, which is of the same shape as August 1st 2023, May 1st 2023 and December 13th 2022, all major market tops of the past 13 months.
This is a strong technical Bearish Divergence and consequently we expect a pullback to at least the 1D MA50. Based on those past peaks and corrections though, we should be expecting at least a 0.382 Fibonacci pullback, thus our target is near the S2 level (TP = 36,000).
## If you like our free content follow our profile to get more daily ideas. ##
## Comments and likes are greatly appreciated. ##

$DJI Looks okay but $SPX showing more strength, $VIX weak#CPI data is out and it came out a lil higher than expected
TVC:DJI broke out of the small downtrend officially yesterday
However, volume was weak, likely because of CPI data today
Keep an eye on RSI & $ Flow for guidance in direction.
Want to see break above for RSI.
Holding 36kish is a good sign for AMEX:DIA
---------------------------------
Not much on NASDAQ:NDX so focus on SP:SPX it is.
RSI shows this to could be picking up steam soon. Looks interesting. However, the $ FLOW could be better.
TVC:VIX is weakening. While it roared louder than last time it's already whimpering and cowering.
Being weak can be more fuel to the bull case we mentioned a few times.
Bumps here & there but #stocks looks to be higher.
Tons more data, for more info, see out profile

Hellena | DJI (4H): Long to area of 38153.16.Dear Colleagues, I believe that the price will still go higher, completing wave 5. Or the price will continue wave 3. I expect a small correction, after which the target will be reached in the area of 38153.16.
Manage your capital correctly and competently! Only enter trades based on reliable patterns!

$DJI still rangebound, $VIX weakening again, Yields mixedGood morning update.
The TVC:DJI is still within the range. Logical as investors are awaiting CPI on Thursday. This will guide on cuts to #InterestRates.
The SP:SPX showing some strength & currently in small trend higher.
But the CLOSING is VERY IMPORTANT. Day range is nice but always respect the closing.
TVC:VIX is weakening again.
TVC:RUT is still in a rut 😆
There's a lot of mixed data!
---------
#Yields 2yr & less are looking weak & trading under all short term avg's.
Longer term are looking better, normalization of curve?
Weekly shows huge selloff but RSI is stabilizing.
US #Dollar looking to take its current downtrend out.
TVC:DXY
That's it for now, ENJOY your day!!!

U.S Equity Index’s Overview – A Repeating PatternU.S Equity Index’s Overview – A Repeating Pattern
The Bull Thesis – Ascending Triangles
The 200 day (blue line on each chart) is squeezing price up towards each red resistance line making each chart look like an ascending triangle (evident on every chart). With the 200 day as underside support for price and the 200 day sloping upwards, things remain positive.
The Bear Caution – Throw overs, Transportation Lag and the Hidden Wedge
We need to be aware and cautious of a throw over top on each chart which is always a possibility. Price on each chart would need to fall back below the red support line (pricing having only been thrown over the red line to come back down again).
The DJ:DJT – Transportation (Chart 1) is lagging behind all the other charts and has not taken out its Nov 2021 or Jul 2023 highs. This relative weakness in Transportation is worrying as this index offers an early indication of potentially less manufacturing and goods being transported, with this chart lagging and failing to take out its highs, it could be an early indication of a more pronounced slowdown in the economy. This chart we need to keep a very close eye on. If DJT fails to rise above its red line and loses the 200 Day, this could be a very bad signal.
We also need to be aware of how one important chart is showing a rising wedge pattern (Chart 3 – Major Market Index TVC:XMI ). This old school chart is watched by the OG traders and investors as a more general market chart. Lets keep an eye on the upper diagonal on the rising wedge for resistance on this one. A rejection here could be something of an early warning sign and obviously losing the red support line would confirm this.
Charts 4 - 6
4. S&P 500 SP:SPX
5. NASDAQ NASDAQ:NDX &
6. US Small Cap 3000 TVC:RUA
All these charts appear to be about to break into all time highs, however they are slightly lagging the Dow Jones Industrials TVC:DJI and the Major Market Index TVC:XMI which have broken all time highs. In the Charts 4 - 6 break out above their red lines (above recent all time highs), this could be another confirmation signal of bullish momentum. Obviously a rejection at this level does not bode well.
SUMMARY
In this hard to navigate market environment we need to pay attention to DJT (Chart 1) and XMI (Chart3) as they provide clear boundaries that we can watch for hidden bear signal warnings. On the contrary, in the even these charts and charts 4 - 6 breach their respective resistance levels mentioned above we can be assured that the wind is at out back in this currently confusingly bullish market.
If you like this overview please let me know and I will complete similar overviews for other markets and indices.
Thanks for reading
PUKA

DOW JONES Correction has started. Where can it stop?Dow Jones (DJI) started a strong decline since our December 29 2023 sell call (see chart below), the strongest since the remarkable rally started on the October 29 bottom:
On today's analysis, we want to look into the same market dynamics and the pattern we drew 10 days ago but this time on the 1D time-frame. What stands out the most is that this time on the January 02 2024 High, the RSI peak that was made a few days back on December 19 2023 (hence the Bearish Divergence) was a (much) Higher High that the previous two (red arrows down) on the Higher Highs trend-line (July 26 2023 and April 13 2023), that was made on the vastly overbought level of 87.50 (highest since January 11 2018).
Our short-term target remains 36750, which represents the 0.618 Fibonacci retracement level from the Jan 02 High. The other feature on this 1D chart that stands out is the 38.50 1D RSI Support, which provided rebounds on May 25 2023 (long-term) and August 24 2023 (short-term). That RSI Support reveals where our first buy attempt should be. Price-wise that could be as low was the 0.5 Fibonacci retracement level (35100) of the October 27 Low. By the time it potentially makes contact with it, the 1D MA200 (orange trend-line) could be there as well.
A medium-term candidate is also a -4.50% range from the Jan 02 High, which would give us 36150 and is where the 1D MA50 (blue trend-line) is headed right now.
-------------------------------------------------------------------------------
** Please LIKE 👍, FOLLOW ✅, SHARE 🙌 and COMMENT ✍ if you enjoy this idea! Also share your ideas and charts in the comments section below! This is best way to keep it relevant, support us, keep the content here free and allow the idea to reach as many people as possible. **
-------------------------------------------------------------------------------
💸💸💸💸💸💸
👇 👇 👇 👇 👇 👇

$DJI now in short term downtrend, NDX, SPX & RUT already wereLooks like the TVC:DJI is in a short term downtrend.
NASDAQ:NDX SP:SPX & TVC:RUT all are in short term down trends which begin couple days or so ago.
TVC:VIX is at higher end of the recent pattern and it keeps poking it.
*(TOOK THIS FROM ANOTHER POST
Remember, the more something is poked the weaker it becomes
Picture paper holding a marble
Poke with a needle
Poke enough & that marble falls
Same works to the upside)*
The TVC:TNX or10 yr #yield looks to be setting up decently on the 4hr intraday.
#stocks

DJI Dow Jones Fell 8.60% After the Last U.S. Credit DowngradeOn Tuesday, Fitch Ratings downgraded the US debt rating from the highest AAA rating to AA+, citing concerns over "a steady deterioration in standards of governance."
This downgrade occurred in the wake of last-minute negotiations among lawmakers to secure a debt ceiling deal earlier this year, which posed a risk of the nation's first default.
Following a similar credit downgrade in the past, the DJI Dow Jones Industrial Average experienced an 8.60% decline over a period of 3 months. The downgrade by S&P, one of the three major credit rating firms, took place on Aug. 5, 2011, after another significant debt ceiling battle.
As of today, the U.S. 10-year Treasury yield has risen to 4.15%, reaching its highest level since November 2022.
If we are to fell -8.60%, the Price Target for DJI is $32500.
Looking forward to read your opinion about it!

$DJI vs $NDX vs RatesSince the "outside" day. The DJ:DJI index has flip flopped above and below the top part of the outside day line.
It wants to push higher but when NASDAQ:NDX craters, like it's doing today, it's a lil tough.
Since we're doing intraday charts, let's do DJ:DJI as well.
What's the biggest thing that sticks out to you on the last chart?
Hint: Look at the bottom 2 panes.
It could all tie in with a bump in higher rates. IMO not a top. Not enough euphoria. But could be a short term top. We'll see.

DOW JONES: Under the 4H MA50 for the first time in 2 months.Dow Jones has turned neutral on the 4H technical outlook (RSI = 55.920, MACD = 42.900, ADX = 19.367) as today it crossed under the 4H MA50 for the first time since November 1st. Even though the price remains inside the two month Channel Up, this 4H MA50 crossing constitutes the first validated sell signal coming off the big Bearish Divergence on the 1D RSI which is trading inside a Channel Down.
Even though the S1 level is the first level of Support, we expect the pullback to correct a sizeable portion of that rally and target the 1D MA50 (TP = 36,000) around the S2 level with a relative tolerance range up to the 0.382 Fibonacci level.
## If you like our free content follow our profile to get more daily ideas. ##
## Comments and likes are greatly appreciated. ##

USA Recession begins, now!USA economy expected to get hit now and DJIA reaches 161.8% target for wave 3.

Breakout in Dow Jones Industrial Average (DJI)...Chart is self explanatory. Levels of breakout, possible up-moves (where stock may find resistances) and support (close below which, setup will be invalidated) are clearly defined.
Disclaimer: This is for demonstration and educational purpose only. This is not buying or selling recommendations. Please consult your financial advisor before taking any trade.

Current View on BTC and Market 12/10/2023Watch video. Too lazy to type what I said.
It would be nice if they had a speech to text thing for this so that it would write what I said.

DOW JONES Key trade focused on the MA50 (4h).Dow Jones has been trading inside a Channel Up since the October 27th Low.
The MA50 (4h) has been the main support throughout this time, having stayed unbroken since November 1st.
Trading Plan:
1. Buy on the current market price as long as the MA50 (4h) holds.
2. If the MA50 (4h) breaks, sell.
Targets:
1. 38550 (+4.06% rise, the lowest throughout the Channel Up).
2. 36400 (the MA200 4h).
Tips:
1. The RSI (4h) has been trading under a Falling Resistance, which indicates a potential Bearish Divergence. It favors a break under the Channel Up.
Please like, follow and comment!!
Notes:
Past trading plan:

DOW JONES Huge Bearish Divergence on 4HDow Jones (DJI) is trading within a very aggressive Channel Up since the October 27 bottom that has seen it rise almost by +17%, making new a All Time High (ATH) in the process. In the meantime it is about to hit the Higher Highs trend-line that has been acting as a Resistance, rejecting similar Channel Up patterns since April 14.
What is more alarming than this Resistance, is the Channel Down that has emerged on the 4H RSI. The other two similar Channel Down patterns that emerged after the RSI got overbought, did so right before the index peaked on the Higher Highs trend-line, starting two corrective Bearish Megaphone patterns. Those structures reached at least the 0.5 Fibonacci retracement level measured from the previous Higher Low, and the 0.618 Fibonacci level from the bottom of the (blue) Channel Up.
Based on this occurrence, we expect yet another Higher Highs rejection that will test at least the 0.618 Fib at 36750, which is our current sell target. Potentially, if the selling pressure is pilled up and transitions to the 1D time-frame, it can reach as low as the 0.5 Fibonacci from the October bottom at 35150.
-------------------------------------------------------------------------------
** Please LIKE 👍, FOLLOW ✅, SHARE 🙌 and COMMENT ✍ if you enjoy this idea! Also share your ideas and charts in the comments section below! This is best way to keep it relevant, support us, keep the content here free and allow the idea to reach as many people as possible. **
-------------------------------------------------------------------------------
💸💸💸💸💸💸
👇 👇 👇 👇 👇 👇

Abnormal DistributionGoing against the norm. Modeling stock markets using non-normal distributions.
That is the only way to take into account the massive volatility that markets can reach.
arxiv.org
Laplace Distributions manage to analyze prices better than normal ones.
It is, as if, stock market is not normal, as in abnormal. As if it defies all physics.
2020 surely suggests that. Rest assured, 2020 was not the worst violation of "normal" physics.
The 2020 Swan may have made headlines, but 2008 is surely unforgettable for young and old alike. It is an example of how deep and unpredictable a crisis can become.
Before the crisis, a plausible risk assessment would give us the following region.
This assumption would end up catastrophic.
A 2-sigma difference may not seem much, but it ended up being a 40% gap.
The 2020 crash shown before, reached a 6-sigma deviation in a shorter timeframe than the following ones. Comparing apples-to-apples with the other charts, 2020 was less than 2-sigma on 300-month length. Suddenly, 2008 looks, and was in fact, more painful than 2020.
Sticking to the same interval (monthly) of analysis and with the same length, we go back in time, in 1980s, just after stagflation ended.
Once again, investors were baffled to see markets grow and grow, above all expectations.
Curiously, Black Monday occurred on the exact 4-sigma limit on the 300M length.
Moving swiftly on, we reach the "Roaring '20s".
Spoiler Alert, the same happened.
Price reached above any possible expectation .
An investor in 1926 would do an analysis based on their historical data. They could not have known the future price action. The 2-sigma channel we drew in 1926 ended up deviating up to 6-sigma.
As we all know, The Great Depression followed up. That was a similar >6-sigma event.
Price reached below any possible expectation .
If you believe 2-sigma is all that Dow can do, don't think twice...
...think quadruply (as in 4-sigma)
The 2-sigma limit was dwarfed...
...from the scale of the events that followed.
After all, stock markets must go in places where nobody believes possible.
No second thoughts must flood our minds to reach the top.
All hope must be lost to reach the bottom.
Extra Charts:
A small-looking but deadly bear trap could be all it takes to create a massive bubble.
Dividing by M2SL reveals that equities are not that overpriced. They are sitting comfortably at the mean.
Has Big Tech grown enough?
For 20 years, consumers were the result of the growth of these companies. Now, governments need digital payment systems, digital identities, IoT. All of these will come mainly from existing corporations, not so much from government production.
The .com bubble was uncharted territory for technology.
Now, supply has developed, and believe it or not, we are still in charted territory. The IXIC/SPX ratio (technology dominance) hasn't even managed to make an all-time high.
Tread lightly, for this is hallowed ground.
-Father Grigori
